This pipeline uses various statistical tests to identify genes whose promoter methylation levels correlated to selected clinical features.
Testing the association between 20596 genes and 8 clinical features across 23 samples, statistically thresholded by Q value < 0.05, 6 clinical features related to at least one genes.
-
3 genes correlated to 'GENDER'.
-
ALG11__1 , UTP14C , KIF4B
-
5 genes correlated to 'HISTOLOGICAL.TYPE'.
-
ME1 , FGFR1OP , ZNF552 , RBP7 , SPAG8
-
14 genes correlated to 'DISTANT.METASTASIS'.
-
RAB21 , SETD6 , FAM38A , TTC12 , NTN3 , ...
-
15 genes correlated to 'LYMPH.NODE.METASTASIS'.
-
C1ORF88 , CCND2 , HNRNPA3 , ANKRD13D , DYRK1B , ...
-
79 genes correlated to 'COMPLETENESS.OF.RESECTION'.
-
C14ORF73 , HAAO , BEGAIN , GRID1 , ARMC4 , ...
-
37 genes correlated to 'NEOPLASM.DISEASESTAGE'.
-
ATP6V0E2 , LOC401431 , LOC652276 , HES4 , C4ORF48 , ...
-
No genes correlated to 'AGE', and 'NUMBER.OF.LYMPH.NODES'.
Complete statistical result table is provided in Supplement Table 1
Table 1. Get Full Table This table shows the clinical features, statistical methods used, and the number of genes that are significantly associated with each clinical feature at Q value < 0.05.
| Clinical feature | Statistical test | Significant genes | Associated with | Associated with | ||
|---|---|---|---|---|---|---|
| AGE | Spearman correlation test | N=0 | ||||
| GENDER | t test | N=3 | male | N=2 | female | N=1 |
| HISTOLOGICAL TYPE | ANOVA test | N=5 | ||||
| DISTANT METASTASIS | ANOVA test | N=14 | ||||
| LYMPH NODE METASTASIS | ANOVA test | N=15 | ||||
| COMPLETENESS OF RESECTION | ANOVA test | N=79 | ||||
| NUMBER OF LYMPH NODES | Spearman correlation test | N=0 | ||||
| NEOPLASM DISEASESTAGE | ANOVA test | N=37 |
Table S1. Basic characteristics of clinical feature: 'AGE'
| AGE | Mean (SD) | 67.13 (8.6) |
| Significant markers | N = 0 |
Table S2. Basic characteristics of clinical feature: 'GENDER'
| GENDER | Labels | N |
| FEMALE | 11 | |
| MALE | 12 | |
| Significant markers | N = 3 | |
| Higher in MALE | 2 | |
| Higher in FEMALE | 1 |
Table S3. Get Full Table List of 3 genes differentially expressed by 'GENDER'
| T(pos if higher in 'MALE') | ttestP | Q | AUC | |
|---|---|---|---|---|
| ALG11__1 | 6.83 | 1.2e-06 | 0.0247 | 0.9697 |
| UTP14C | 6.83 | 1.2e-06 | 0.0247 | 0.9697 |
| KIF4B | -6.84 | 1.822e-06 | 0.0375 | 0.9924 |
Figure S1. Get High-res Image As an example, this figure shows the association of ALG11__1 to 'GENDER'. P value = 1.2e-06 with T-test analysis.
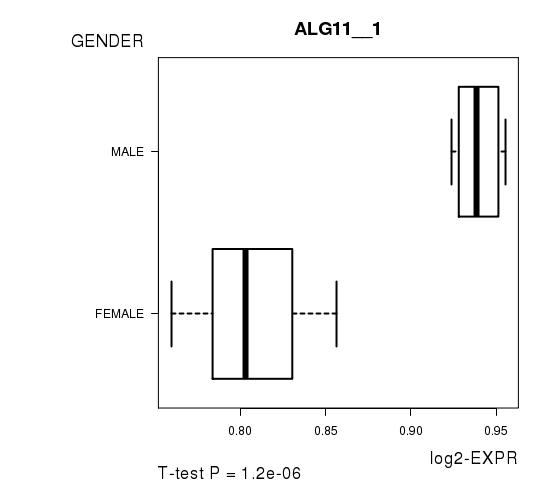
Table S4. Basic characteristics of clinical feature: 'HISTOLOGICAL.TYPE'
| HISTOLOGICAL.TYPE | Labels | N |
| PANCREAS-ADENOCARCINOMA DUCTAL TYPE | 20 | |
| PANCREAS-ADENOCARCINOMA-OTHER SUBTYPE | 2 | |
| PANCREAS-COLLOID (MUCINOUS NON-CYSTIC) CARCINOMA | 1 | |
| Significant markers | N = 5 |
Table S5. Get Full Table List of 5 genes differentially expressed by 'HISTOLOGICAL.TYPE'
| ANOVA_P | Q | |
|---|---|---|
| ME1 | 8.002e-19 | 1.65e-14 |
| FGFR1OP | 1.005e-14 | 2.07e-10 |
| ZNF552 | 3.778e-12 | 7.78e-08 |
| RBP7 | 4.832e-12 | 9.95e-08 |
| SPAG8 | 1.601e-09 | 3.3e-05 |
Figure S2. Get High-res Image As an example, this figure shows the association of ME1 to 'HISTOLOGICAL.TYPE'. P value = 8e-19 with ANOVA analysis.
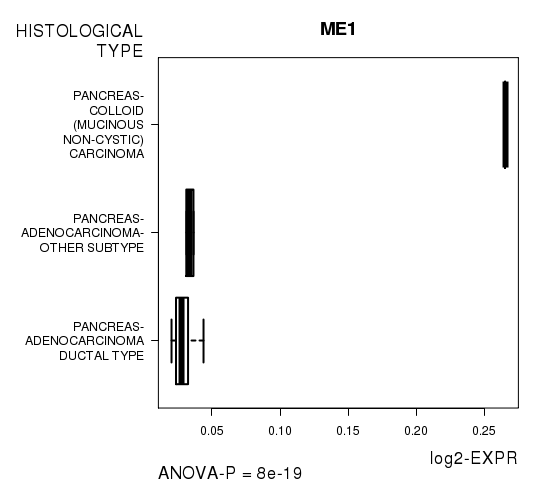
Table S6. Basic characteristics of clinical feature: 'DISTANT.METASTASIS'
| DISTANT.METASTASIS | Labels | N |
| M0 | 2 | |
| M1 | 1 | |
| MX | 20 | |
| Significant markers | N = 14 |
Table S7. Get Full Table List of top 10 genes differentially expressed by 'DISTANT.METASTASIS'
| ANOVA_P | Q | |
|---|---|---|
| RAB21 | 1.035e-16 | 2.13e-12 |
| SETD6 | 4.233e-14 | 8.72e-10 |
| FAM38A | 5.286e-13 | 1.09e-08 |
| TTC12 | 7.391e-12 | 1.52e-07 |
| NTN3 | 1.471e-09 | 3.03e-05 |
| TRIM4 | 1.616e-08 | 0.000333 |
| SLCO4C1 | 6.074e-08 | 0.00125 |
| GUSB | 6.242e-08 | 0.00129 |
| KATNAL2__1 | 8.655e-08 | 0.00178 |
| TCEB3B | 8.655e-08 | 0.00178 |
Figure S3. Get High-res Image As an example, this figure shows the association of RAB21 to 'DISTANT.METASTASIS'. P value = 1.04e-16 with ANOVA analysis.
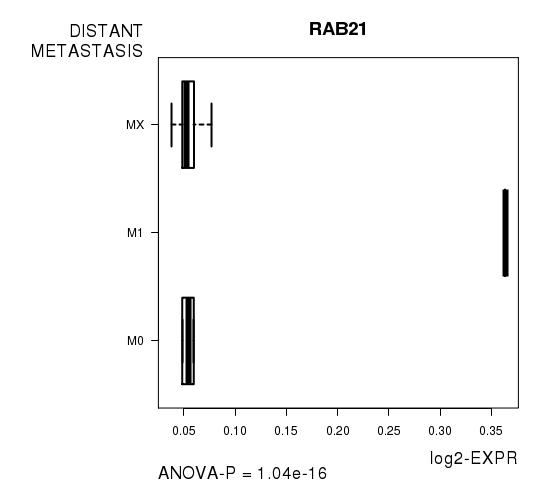
Table S8. Basic characteristics of clinical feature: 'LYMPH.NODE.METASTASIS'
| LYMPH.NODE.METASTASIS | Labels | N |
| N0 | 8 | |
| N1 | 14 | |
| N1B | 1 | |
| Significant markers | N = 15 |
Table S9. Get Full Table List of top 10 genes differentially expressed by 'LYMPH.NODE.METASTASIS'
| ANOVA_P | Q | |
|---|---|---|
| C1ORF88 | 2.575e-13 | 5.3e-09 |
| CCND2 | 7.452e-12 | 1.53e-07 |
| HNRNPA3 | 1.111e-10 | 2.29e-06 |
| ANKRD13D | 3.241e-09 | 6.67e-05 |
| DYRK1B | 5.755e-09 | 0.000119 |
| SORT1 | 1.501e-08 | 0.000309 |
| LHFPL5 | 7.133e-08 | 0.00147 |
| ZNF655 | 2.358e-07 | 0.00486 |
| BASP1__1 | 2.736e-07 | 0.00563 |
| IFNAR1 | 4.618e-07 | 0.00951 |
Figure S4. Get High-res Image As an example, this figure shows the association of C1ORF88 to 'LYMPH.NODE.METASTASIS'. P value = 2.58e-13 with ANOVA analysis.
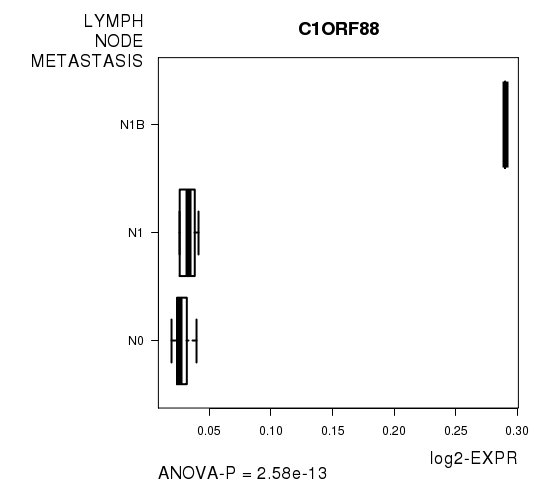
Table S10. Basic characteristics of clinical feature: 'COMPLETENESS.OF.RESECTION'
| COMPLETENESS.OF.RESECTION | Labels | N |
| R0 | 13 | |
| R1 | 9 | |
| RX | 1 | |
| Significant markers | N = 79 |
Table S11. Get Full Table List of top 10 genes differentially expressed by 'COMPLETENESS.OF.RESECTION'
| ANOVA_P | Q | |
|---|---|---|
| C14ORF73 | 7.086e-30 | 1.46e-25 |
| HAAO | 5.254e-23 | 1.08e-18 |
| BEGAIN | 7.541e-19 | 1.55e-14 |
| GRID1 | 1.117e-18 | 2.3e-14 |
| ARMC4 | 1.231e-17 | 2.53e-13 |
| LASS3 | 2.305e-17 | 4.75e-13 |
| ZNF230 | 1.349e-16 | 2.78e-12 |
| GPATCH2__1 | 1.632e-16 | 3.36e-12 |
| SPATA17__1 | 1.632e-16 | 3.36e-12 |
| C5ORF42 | 9.036e-16 | 1.86e-11 |
Figure S5. Get High-res Image As an example, this figure shows the association of C14ORF73 to 'COMPLETENESS.OF.RESECTION'. P value = 7.09e-30 with ANOVA analysis.

Table S12. Basic characteristics of clinical feature: 'NUMBER.OF.LYMPH.NODES'
| NUMBER.OF.LYMPH.NODES | Mean (SD) | 2.22 (2.7) |
| Significant markers | N = 0 |
Table S13. Basic characteristics of clinical feature: 'NEOPLASM.DISEASESTAGE'
| NEOPLASM.DISEASESTAGE | Labels | N |
| STAGE IA | 2 | |
| STAGE IB | 1 | |
| STAGE IIA | 3 | |
| STAGE IIB | 15 | |
| STAGE III | 1 | |
| STAGE IV | 1 | |
| Significant markers | N = 37 |
Table S14. Get Full Table List of top 10 genes differentially expressed by 'NEOPLASM.DISEASESTAGE'
| ANOVA_P | Q | |
|---|---|---|
| ATP6V0E2 | 4.35e-27 | 8.96e-23 |
| LOC401431 | 4.35e-27 | 8.96e-23 |
| LOC652276 | 6.025e-26 | 1.24e-21 |
| HES4 | 1.042e-22 | 2.15e-18 |
| C4ORF48 | 5.243e-20 | 1.08e-15 |
| SCHIP1 | 1.432e-18 | 2.95e-14 |
| RAB21 | 1.795e-13 | 3.7e-09 |
| TAS2R3 | 5.627e-11 | 1.16e-06 |
| SETD6 | 6.312e-11 | 1.3e-06 |
| C1ORF104__1 | 1.758e-10 | 3.62e-06 |
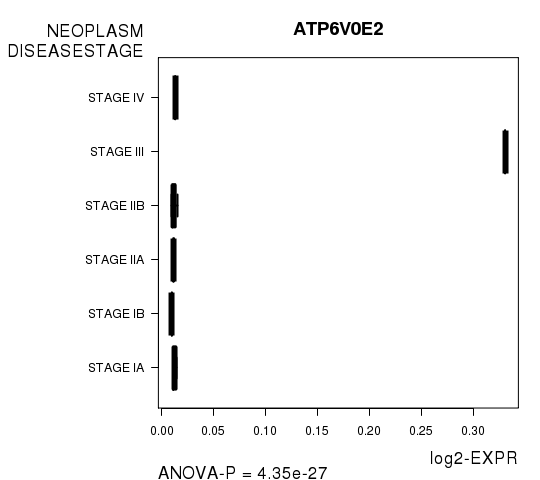
Figure S6. Get High-res Image As an example, this figure shows the association of ATP6V0E2 to 'NEOPLASM.DISEASESTAGE'. P value = 4.35e-27 with ANOVA analysis.
-
Expresson data file = PAAD-TP.meth.by_min_expr_corr.data.txt
-
Clinical data file = PAAD-TP.clin.merged.picked.txt
-
Number of patients = 23
-
Number of genes = 20596
-
Number of clinical features = 8
For continuous numerical clinical features, Spearman's rank correlation coefficients (Spearman 1904) and two-tailed P values were estimated using 'cor.test' function in R
For two-class clinical features, two-tailed Student's t test with unequal variance (Lehmann and Romano 2005) was applied to compare the log2-expression levels between the two clinical classes using 't.test' function in R
For multi-class clinical features (ordinal or nominal), one-way analysis of variance (Howell 2002) was applied to compare the log2-expression levels between different clinical classes using 'anova' function in R
For multiple hypothesis correction, Q value is the False Discovery Rate (FDR) analogue of the P value (Benjamini and Hochberg 1995), defined as the minimum FDR at which the test may be called significant. We used the 'Benjamini and Hochberg' method of 'p.adjust' function in R to convert P values into Q values.
This is an experimental feature. The full results of the analysis summarized in this report can be downloaded from the TCGA Data Coordination Center.