This pipeline uses various statistical tests to identify mRNAs whose expression levels correlated to selected clinical features.
Testing the association between 18603 genes and 7 clinical features across 18 samples, statistically thresholded by Q value < 0.05, 2 clinical features related to at least one genes.
-
9 genes correlated to 'GENDER'.
-
XIST|7503 , NLGN4Y|22829 , ZFY|7544 , RPS4Y1|6192 , UTY|7404 , ...
-
7 genes correlated to 'NEOPLASM.DISEASESTAGE'.
-
CCNT1|904 , ZC3HAV1L|92092 , TAF1L|138474 , ZNF192|7745 , UHMK1|127933 , ...
-
No genes correlated to 'AGE', 'DISTANT.METASTASIS', 'LYMPH.NODE.METASTASIS', 'COMPLETENESS.OF.RESECTION', and 'NUMBER.OF.LYMPH.NODES'.
Complete statistical result table is provided in Supplement Table 1
Table 1. Get Full Table This table shows the clinical features, statistical methods used, and the number of genes that are significantly associated with each clinical feature at Q value < 0.05.
| Clinical feature | Statistical test | Significant genes | Associated with | Associated with | ||
|---|---|---|---|---|---|---|
| AGE | Spearman correlation test | N=0 | ||||
| GENDER | t test | N=9 | male | N=6 | female | N=3 |
| DISTANT METASTASIS | ANOVA test | N=0 | ||||
| LYMPH NODE METASTASIS | t test | N=0 | ||||
| COMPLETENESS OF RESECTION | ANOVA test | N=0 | ||||
| NUMBER OF LYMPH NODES | Spearman correlation test | N=0 | ||||
| NEOPLASM DISEASESTAGE | ANOVA test | N=7 |
Table S1. Basic characteristics of clinical feature: 'AGE'
| AGE | Mean (SD) | 64.94 (8.4) |
| Significant markers | N = 0 |
Table S2. Basic characteristics of clinical feature: 'GENDER'
| GENDER | Labels | N |
| FEMALE | 10 | |
| MALE | 8 | |
| Significant markers | N = 9 | |
| Higher in MALE | 6 | |
| Higher in FEMALE | 3 |
Table S3. Get Full Table List of 9 genes differentially expressed by 'GENDER'
| T(pos if higher in 'MALE') | ttestP | Q | AUC | |
|---|---|---|---|---|
| XIST|7503 | -27.05 | 1.384e-14 | 2.55e-10 | 1 |
| NLGN4Y|22829 | 27.25 | 9.312e-13 | 1.71e-08 | 1 |
| ZFY|7544 | 19.95 | 3.289e-10 | 6.06e-06 | 1 |
| RPS4Y1|6192 | 32.26 | 5.773e-10 | 1.06e-05 | 1 |
| UTY|7404 | 33.87 | 6.866e-10 | 1.26e-05 | 1 |
| PRKY|5616 | 13.28 | 1.188e-09 | 2.19e-05 | 1 |
| DDX3Y|8653 | 26.31 | 2.967e-09 | 5.46e-05 | 1 |
| TSIX|9383 | -18.37 | 1.08e-08 | 0.000199 | 1 |
| HDHD1A|8226 | -7.12 | 2.448e-06 | 0.0451 | 0.9875 |
Figure S1. Get High-res Image As an example, this figure shows the association of XIST|7503 to 'GENDER'. P value = 1.38e-14 with T-test analysis.
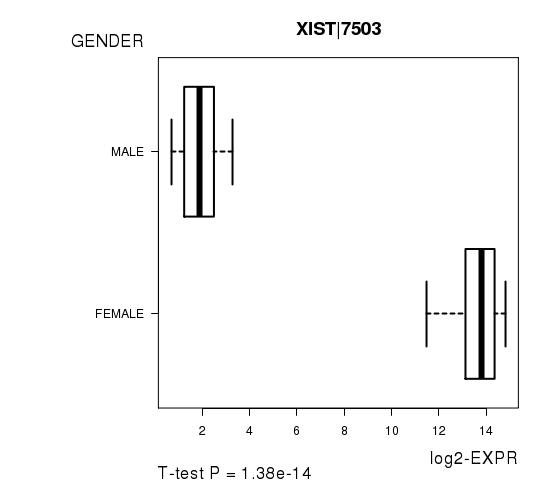
Table S4. Basic characteristics of clinical feature: 'DISTANT.METASTASIS'
| DISTANT.METASTASIS | Labels | N |
| M0 | 3 | |
| M1 | 1 | |
| MX | 14 | |
| Significant markers | N = 0 |
Table S5. Basic characteristics of clinical feature: 'LYMPH.NODE.METASTASIS'
| LYMPH.NODE.METASTASIS | Labels | N |
| N0 | 8 | |
| N1 | 10 | |
| Significant markers | N = 0 |
Table S6. Basic characteristics of clinical feature: 'COMPLETENESS.OF.RESECTION'
| COMPLETENESS.OF.RESECTION | Labels | N |
| R0 | 13 | |
| R1 | 4 | |
| RX | 1 | |
| Significant markers | N = 0 |
Table S7. Basic characteristics of clinical feature: 'NUMBER.OF.LYMPH.NODES'
| NUMBER.OF.LYMPH.NODES | Mean (SD) | 1.78 (2.7) |
| Significant markers | N = 0 |
Table S8. Basic characteristics of clinical feature: 'NEOPLASM.DISEASESTAGE'
| NEOPLASM.DISEASESTAGE | Labels | N |
| STAGE IA | 2 | |
| STAGE IB | 1 | |
| STAGE IIA | 3 | |
| STAGE IIB | 10 | |
| STAGE III | 1 | |
| STAGE IV | 1 | |
| Significant markers | N = 7 |
Table S9. Get Full Table List of 7 genes differentially expressed by 'NEOPLASM.DISEASESTAGE'
| ANOVA_P | Q | |
|---|---|---|
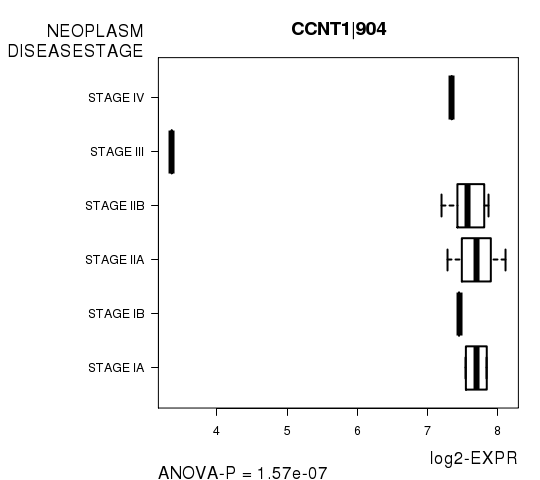
| CCNT1|904 | 1.572e-07 | 0.00292 |
| ZC3HAV1L|92092 | 1.662e-07 | 0.00309 |
| TAF1L|138474 | 3.862e-07 | 0.00718 |
| ZNF192|7745 | 5.154e-07 | 0.00958 |
| UHMK1|127933 | 5.479e-07 | 0.0102 |
| ANKRD36BP1|84832 | 7.551e-07 | 0.014 |
| C19ORF56|51398 | 2.182e-06 | 0.0406 |
Figure S2. Get High-res Image As an example, this figure shows the association of CCNT1|904 to 'NEOPLASM.DISEASESTAGE'. P value = 1.57e-07 with ANOVA analysis.
-
Expresson data file = PAAD-TP.uncv2.mRNAseq_RSEM_normalized_log2.txt
-
Clinical data file = PAAD-TP.clin.merged.picked.txt
-
Number of patients = 18
-
Number of genes = 18603
-
Number of clinical features = 7
For continuous numerical clinical features, Spearman's rank correlation coefficients (Spearman 1904) and two-tailed P values were estimated using 'cor.test' function in R
For two-class clinical features, two-tailed Student's t test with unequal variance (Lehmann and Romano 2005) was applied to compare the log2-expression levels between the two clinical classes using 't.test' function in R
For multi-class clinical features (ordinal or nominal), one-way analysis of variance (Howell 2002) was applied to compare the log2-expression levels between different clinical classes using 'anova' function in R
For multiple hypothesis correction, Q value is the False Discovery Rate (FDR) analogue of the P value (Benjamini and Hochberg 1995), defined as the minimum FDR at which the test may be called significant. We used the 'Benjamini and Hochberg' method of 'p.adjust' function in R to convert P values into Q values.
This is an experimental feature. The full results of the analysis summarized in this report can be downloaded from the TCGA Data Coordination Center.