This pipeline computes the correlation between significant copy number variation (cnv focal) genes and selected clinical features.
Testing the association between copy number variation 47 arm-level results and 6 clinical features across 155 patients, 2 significant findings detected with Q value < 0.25.
-
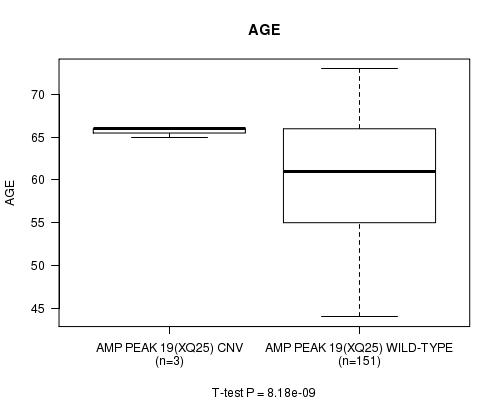
Amp Peak 19(Xq25) cnv correlated to 'AGE'.
-
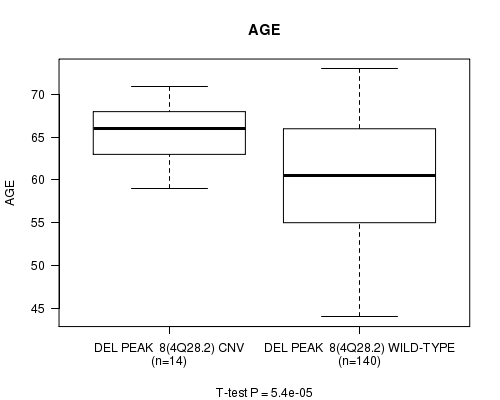
Del Peak 8(4q28.2) cnv correlated to 'AGE'.
Table 1. Get Full Table Overview of the association between significant copy number variation of 47 arm-level results and 6 clinical features. Shown in the table are P values (Q values). Thresholded by Q value < 0.25, 2 significant findings detected.
|
Clinical Features |
Time to Death |
AGE |
LYMPH NODE METASTASIS |
COMPLETENESS OF RESECTION |
NUMBER OF LYMPH NODES |
TUMOR STAGECODE |
||
| nCNV (%) | nWild-Type | logrank test | t-test | Fisher's exact test | Fisher's exact test | t-test | t-test | |
| Amp Peak 19(Xq25) | 0 (0%) | 152 |
1 (1.00) |
8.18e-09 (1.92e-06) |
1 (1.00) |
1 (1.00) |
0.00151 (0.348) |
|
| Del Peak 8(4q28 2) | 0 (0%) | 141 |
1 (1.00) |
5.4e-05 (0.0126) |
1 (1.00) |
1 (1.00) |
0.142 (1.00) |
|
| Amp Peak 1(1q21 3) | 0 (0%) | 145 |
1 (1.00) |
0.617 (1.00) |
0.304 (1.00) |
0.728 (1.00) |
0.518 (1.00) |
|
| Amp Peak 2(3q26 2) | 0 (0%) | 131 |
1 (1.00) |
0.107 (1.00) |
0.283 (1.00) |
1 (1.00) |
0.272 (1.00) |
|
| Amp Peak 3(7p15 3) | 0 (0%) | 124 |
1 (1.00) |
0.399 (1.00) |
0.511 (1.00) |
0.0474 (1.00) |
0.341 (1.00) |
|
| Amp Peak 4(7q34) | 0 (0%) | 127 |
1 (1.00) |
0.125 (1.00) |
1 (1.00) |
0.342 (1.00) |
0.605 (1.00) |
|
| Amp Peak 5(8p11 22) | 0 (0%) | 140 |
1 (1.00) |
0.375 (1.00) |
0.0382 (1.00) |
0.44 (1.00) |
0.266 (1.00) |
|
| Amp Peak 6(8q21 13) | 0 (0%) | 115 |
1 (1.00) |
0.0411 (1.00) |
0.359 (1.00) |
0.83 (1.00) |
0.571 (1.00) |
|
| Amp Peak 7(11q13 2) | 0 (0%) | 147 |
1 (1.00) |
0.622 (1.00) |
0.0437 (1.00) |
0.154 (1.00) |
0.288 (1.00) |
|
| Amp Peak 8(12q24 32) | 0 (0%) | 148 |
1 (1.00) |
0.984 (1.00) |
0.172 (1.00) |
0.229 (1.00) |
0.407 (1.00) |
|
| Amp Peak 9(14q21 1) | 0 (0%) | 147 |
1 (1.00) |
0.00156 (0.355) |
0.567 (1.00) |
0.291 (1.00) |
0.683 (1.00) |
|
| Amp Peak 10(20q13 33) | 0 (0%) | 143 |
1 (1.00) |
0.00502 (1.00) |
0.36 (1.00) |
0.0382 (1.00) |
0.00149 (0.348) |
|
| Amp Peak 11(21q21 3) | 0 (0%) | 150 |
1 (1.00) |
0.0233 (1.00) |
0.448 (1.00) |
0.611 (1.00) |
0.534 (1.00) |
|
| Amp Peak 12(Xp22 11) | 0 (0%) | 150 |
1 (1.00) |
0.704 (1.00) |
0.448 (1.00) |
1 (1.00) |
0.644 (1.00) |
|
| Amp Peak 13(Xp22 11) | 0 (0%) | 150 |
1 (1.00) |
0.129 (1.00) |
0.448 (1.00) |
0.604 (1.00) |
0.644 (1.00) |
|
| Amp Peak 14(Xp21 1) | 0 (0%) | 151 |
1 (1.00) |
0.124 (1.00) |
0.377 (1.00) |
1 (1.00) |
0.87 (1.00) |
|
| Amp Peak 15(Xq12) | 0 (0%) | 152 |
1 (1.00) |
0.642 (1.00) |
1 (1.00) |
0.519 (1.00) |
0.00151 (0.348) |
|
| Amp Peak 16(Xq21 1) | 0 (0%) | 148 |
1 (1.00) |
0.725 (1.00) |
0.567 (1.00) |
0.405 (1.00) |
0.783 (1.00) |
|
| Amp Peak 17(Xq21 1) | 0 (0%) | 150 |
1 (1.00) |
0.331 (1.00) |
0.0937 (1.00) |
0.611 (1.00) |
0.351 (1.00) |
|
| Amp Peak 18(Xq21 31) | 0 (0%) | 150 |
1 (1.00) |
0.234 (1.00) |
1 (1.00) |
0.611 (1.00) |
0.00151 (0.348) |
|
| Amp Peak 20(Xq25) | 0 (0%) | 149 |
1 (1.00) |
0.728 (1.00) |
0.511 (1.00) |
0.399 (1.00) |
0.826 (1.00) |
|
| Amp Peak 21(Xq27 1) | 0 (0%) | 146 |
1 (1.00) |
0.294 (1.00) |
0.598 (1.00) |
1 (1.00) |
0.0015 (0.348) |
|
| Del Peak 1(1p31 3) | 0 (0%) | 136 |
1 (1.00) |
0.78 (1.00) |
0.69 (1.00) |
0.652 (1.00) |
0.81 (1.00) |
|
| Del Peak 2(1p21 3) | 0 (0%) | 143 |
1 (1.00) |
0.837 (1.00) |
0.348 (1.00) |
0.501 (1.00) |
0.282 (1.00) |
|
| Del Peak 3(1q23 1) | 0 (0%) | 148 |
1 (1.00) |
0.609 (1.00) |
1 (1.00) |
1 (1.00) |
0.00151 (0.348) |
|
| Del Peak 4(1q42 13) | 0 (0%) | 141 |
1 (1.00) |
0.154 (1.00) |
0.654 (1.00) |
1 (1.00) |
0.705 (1.00) |
|
| Del Peak 5(2q22 1) | 0 (0%) | 136 |
1 (1.00) |
0.0933 (1.00) |
1 (1.00) |
0.817 (1.00) |
0.564 (1.00) |
|
| Del Peak 6(3p13) | 0 (0%) | 129 |
1 (1.00) |
0.326 (1.00) |
1 (1.00) |
0.728 (1.00) |
0.751 (1.00) |
|
| Del Peak 7(3q29) | 0 (0%) | 145 |
1 (1.00) |
0.243 (1.00) |
1 (1.00) |
1 (1.00) |
0.977 (1.00) |
|
| Del Peak 9(5q11 2) | 0 (0%) | 132 |
1 (1.00) |
0.234 (1.00) |
0.00227 (0.514) |
1 (1.00) |
0.0738 (1.00) |
|
| Del Peak 10(5q21 1) | 0 (0%) | 129 |
1 (1.00) |
0.0187 (1.00) |
0.164 (1.00) |
0.485 (1.00) |
0.29 (1.00) |
|
| Del Peak 11(6q15) | 0 (0%) | 105 |
1 (1.00) |
0.0507 (1.00) |
0.0494 (1.00) |
0.587 (1.00) |
0.0275 (1.00) |
|
| Del Peak 12(7q36 1) | 0 (0%) | 148 |
1 (1.00) |
0.329 (1.00) |
0.131 (1.00) |
1 (1.00) |
0.414 (1.00) |
|
| Del Peak 13(8p21 3) | 0 (0%) | 62 |
1 (1.00) |
0.296 (1.00) |
0.0473 (1.00) |
0.864 (1.00) |
0.0104 (1.00) |
|
| Del Peak 14(8p11 21) | 0 (0%) | 103 |
1 (1.00) |
0.174 (1.00) |
0.776 (1.00) |
0.0433 (1.00) |
0.607 (1.00) |
|
| Del Peak 15(9p22 3) | 0 (0%) | 141 |
1 (1.00) |
0.24 (1.00) |
0.00914 (1.00) |
0.774 (1.00) |
0.0994 (1.00) |
|
| Del Peak 16(10q23 31) | 0 (0%) | 97 |
1 (1.00) |
0.997 (1.00) |
0.0469 (1.00) |
0.889 (1.00) |
0.348 (1.00) |
|
| Del Peak 17(11q23 2) | 0 (0%) | 136 |
1 (1.00) |
0.69 (1.00) |
0.692 (1.00) |
0.805 (1.00) |
0.0614 (1.00) |
|
| Del Peak 18(12p13 2) | 0 (0%) | 123 |
1 (1.00) |
0.767 (1.00) |
0.119 (1.00) |
0.719 (1.00) |
0.49 (1.00) |
|
| Del Peak 19(13q14 13) | 0 (0%) | 84 |
1 (1.00) |
0.0126 (1.00) |
0.285 (1.00) |
0.497 (1.00) |
0.263 (1.00) |
|
| Del Peak 20(16q24 1) | 0 (0%) | 91 |
1 (1.00) |
0.201 (1.00) |
0.27 (1.00) |
0.51 (1.00) |
0.153 (1.00) |
|
| Del Peak 21(17p13 1) | 0 (0%) | 115 |
1 (1.00) |
0.48 (1.00) |
0.119 (1.00) |
0.863 (1.00) |
0.276 (1.00) |
|
| Del Peak 22(17q21 31) | 0 (0%) | 126 |
1 (1.00) |
0.645 (1.00) |
0.738 (1.00) |
0.317 (1.00) |
0.367 (1.00) |
|
| Del Peak 23(18q22 1) | 0 (0%) | 115 |
1 (1.00) |
0.834 (1.00) |
0.527 (1.00) |
0.773 (1.00) |
0.585 (1.00) |
|
| Del Peak 24(18q23) | 0 (0%) | 109 |
1 (1.00) |
0.144 (1.00) |
0.0394 (1.00) |
0.495 (1.00) |
0.167 (1.00) |
|
| Del Peak 25(21q22 2) | 0 (0%) | 103 |
1 (1.00) |
0.838 (1.00) |
0.042 (1.00) |
0.504 (1.00) |
0.145 (1.00) |
|
| Del Peak 26(21q22 3) | 0 (0%) | 105 |
1 (1.00) |
0.672 (1.00) |
0.0208 (1.00) |
0.543 (1.00) |
0.112 (1.00) |
P value = 8.18e-09 (t-test), Q value = 1.9e-06
Table S1. Gene #19: 'Amp Peak 19(Xq25)' versus Clinical Feature #2: 'AGE'
| nPatients | Mean (Std.Dev) | |
|---|---|---|
| ALL | 154 | 60.4 (6.9) |
| AMP PEAK 19(XQ25) CNV | 3 | 65.7 (0.6) |
| AMP PEAK 19(XQ25) WILD-TYPE | 151 | 60.3 (6.9) |
Figure S1. Get High-res Image Gene #19: 'Amp Peak 19(Xq25)' versus Clinical Feature #2: 'AGE'
P value = 5.4e-05 (t-test), Q value = 0.013
Table S2. Gene #29: 'Del Peak 8(4q28.2)' versus Clinical Feature #2: 'AGE'
| nPatients | Mean (Std.Dev) | |
|---|---|---|
| ALL | 154 | 60.4 (6.9) |
| DEL PEAK 8(4Q28.2) CNV | 14 | 65.2 (3.5) |
| DEL PEAK 8(4Q28.2) WILD-TYPE | 140 | 59.9 (6.9) |
Figure S2. Get High-res Image Gene #29: 'Del Peak 8(4q28.2)' versus Clinical Feature #2: 'AGE'
-
Mutation data file = all_lesions.conf_99.cnv.cluster.txt
-
Clinical data file = PRAD-TP.clin.merged.picked.txt
-
Number of patients = 155
-
Number of significantly arm-level cnvs = 47
-
Number of selected clinical features = 6
-
Exclude genes that fewer than K tumors have mutations, K = 3
For survival clinical features, the Kaplan-Meier survival curves of tumors with and without gene mutations were plotted and the statistical significance P values were estimated by logrank test (Bland and Altman 2004) using the 'survdiff' function in R
For continuous numerical clinical features, two-tailed Student's t test with unequal variance (Lehmann and Romano 2005) was applied to compare the clinical values between tumors with and without gene mutations using 't.test' function in R
For binary or multi-class clinical features (nominal or ordinal), two-tailed Fisher's exact tests (Fisher 1922) were used to estimate the P values using the 'fisher.test' function in R
For multiple hypothesis correction, Q value is the False Discovery Rate (FDR) analogue of the P value (Benjamini and Hochberg 1995), defined as the minimum FDR at which the test may be called significant. We used the 'Benjamini and Hochberg' method of 'p.adjust' function in R to convert P values into Q values.
This is an experimental feature. The full results of the analysis summarized in this report can be downloaded from the TCGA Data Coordination Center.