This pipeline uses various statistical tests to identify genes whose promoter methylation levels correlated to selected clinical features.
Testing the association between 20063 genes and 4 clinical features across 153 samples, statistically thresholded by Q value < 0.05, 2 clinical features related to at least one genes.
-
7 genes correlated to 'LYMPH.NODE.METASTASIS'.
-
DYRK2 , DLEU2__2 , KCNJ2 , RRM2 , TDRKH , ...
-
4 genes correlated to 'COMPLETENESS.OF.RESECTION'.
-
WHAMM , CD36 , TGM4 , ZNF219
-
No genes correlated to 'AGE', and 'NUMBER.OF.LYMPH.NODES'.
Complete statistical result table is provided in Supplement Table 1
Table 1. Get Full Table This table shows the clinical features, statistical methods used, and the number of genes that are significantly associated with each clinical feature at Q value < 0.05.
| Clinical feature | Statistical test | Significant genes | Associated with | Associated with | ||
|---|---|---|---|---|---|---|
| AGE | Spearman correlation test | N=0 | ||||
| LYMPH NODE METASTASIS | t test | N=7 | n1 | N=0 | n0 | N=7 |
| COMPLETENESS OF RESECTION | ANOVA test | N=4 | ||||
| NUMBER OF LYMPH NODES | Spearman correlation test | N=0 |
Table S1. Basic characteristics of clinical feature: 'AGE'
| AGE | Mean (SD) | 60.23 (6.8) |
| Significant markers | N = 0 |
Table S2. Basic characteristics of clinical feature: 'LYMPH.NODE.METASTASIS'
| LYMPH.NODE.METASTASIS | Labels | N |
| N0 | 120 | |
| N1 | 15 | |
| Significant markers | N = 7 | |
| Higher in N1 | 0 | |
| Higher in N0 | 7 |
Table S3. Get Full Table List of 7 genes differentially expressed by 'LYMPH.NODE.METASTASIS'
| T(pos if higher in 'N1') | ttestP | Q | AUC | |
|---|---|---|---|---|
| DYRK2 | -6.73 | 3.523e-09 | 7.07e-05 | 0.745 |
| DLEU2__2 | -6.24 | 3.859e-08 | 0.000774 | 0.8217 |
| KCNJ2 | -5.67 | 9.209e-08 | 0.00185 | 0.7428 |
| RRM2 | -5.87 | 2.088e-07 | 0.00419 | 0.7717 |
| TDRKH | -5.53 | 2.57e-07 | 0.00515 | 0.7023 |
| NME1-NME2__2 | -5.79 | 1.69e-06 | 0.0339 | 0.775 |
| NME2__1 | -5.79 | 1.69e-06 | 0.0339 | 0.775 |
Figure S1. Get High-res Image As an example, this figure shows the association of DYRK2 to 'LYMPH.NODE.METASTASIS'. P value = 3.52e-09 with T-test analysis.

Table S4. Basic characteristics of clinical feature: 'COMPLETENESS.OF.RESECTION'
| COMPLETENESS.OF.RESECTION | Labels | N |
| R0 | 115 | |
| R1 | 30 | |
| RX | 2 | |
| Significant markers | N = 4 |
Table S5. Get Full Table List of 4 genes differentially expressed by 'COMPLETENESS.OF.RESECTION'
| ANOVA_P | Q | |
|---|---|---|
| WHAMM | 1.927e-20 | 3.87e-16 |
| CD36 | 2.317e-08 | 0.000465 |
| TGM4 | 1.32e-07 | 0.00265 |
| ZNF219 | 1.173e-06 | 0.0235 |
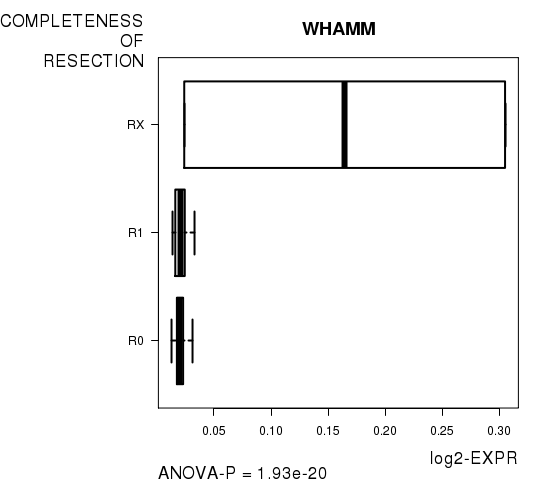
Figure S2. Get High-res Image As an example, this figure shows the association of WHAMM to 'COMPLETENESS.OF.RESECTION'. P value = 1.93e-20 with ANOVA analysis.
-
Expresson data file = PRAD-TP.meth.by_min_expr_corr.data.txt
-
Clinical data file = PRAD-TP.clin.merged.picked.txt
-
Number of patients = 153
-
Number of genes = 20063
-
Number of clinical features = 4
For continuous numerical clinical features, Spearman's rank correlation coefficients (Spearman 1904) and two-tailed P values were estimated using 'cor.test' function in R
For two-class clinical features, two-tailed Student's t test with unequal variance (Lehmann and Romano 2005) was applied to compare the log2-expression levels between the two clinical classes using 't.test' function in R
For multi-class clinical features (ordinal or nominal), one-way analysis of variance (Howell 2002) was applied to compare the log2-expression levels between different clinical classes using 'anova' function in R
For multiple hypothesis correction, Q value is the False Discovery Rate (FDR) analogue of the P value (Benjamini and Hochberg 1995), defined as the minimum FDR at which the test may be called significant. We used the 'Benjamini and Hochberg' method of 'p.adjust' function in R to convert P values into Q values.
This is an experimental feature. The full results of the analysis summarized in this report can be downloaded from the TCGA Data Coordination Center.