This pipeline uses various statistical tests to identify mRNAs whose expression levels correlated to selected clinical features.
Testing the association between 18257 genes and 4 clinical features across 154 samples, statistically thresholded by Q value < 0.05, 3 clinical features related to at least one genes.
-
1 gene correlated to 'AGE'.
-
ADAP2|55803
-
4 genes correlated to 'LYMPH.NODE.METASTASIS'.
-
CRHR2|1395 , NKX6-2|84504 , NUP62CL|54830 , SEC24A|10802
-
1 gene correlated to 'COMPLETENESS.OF.RESECTION'.
-
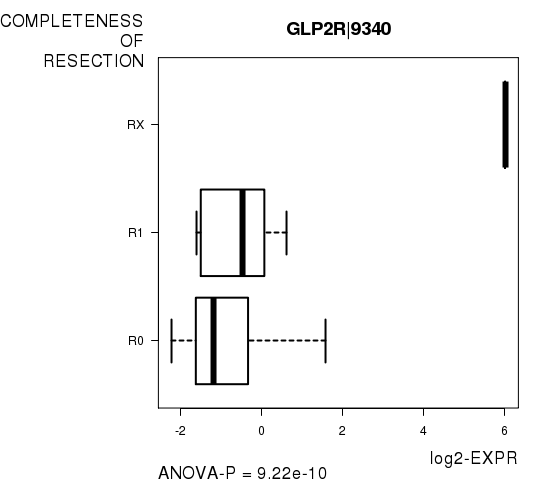
GLP2R|9340
-
No genes correlated to 'NUMBER.OF.LYMPH.NODES'
Complete statistical result table is provided in Supplement Table 1
Table 1. Get Full Table This table shows the clinical features, statistical methods used, and the number of genes that are significantly associated with each clinical feature at Q value < 0.05.
| Clinical feature | Statistical test | Significant genes | Associated with | Associated with | ||
|---|---|---|---|---|---|---|
| AGE | Spearman correlation test | N=1 | older | N=1 | younger | N=0 |
| LYMPH NODE METASTASIS | t test | N=4 | n1 | N=2 | n0 | N=2 |
| COMPLETENESS OF RESECTION | ANOVA test | N=1 | ||||
| NUMBER OF LYMPH NODES | Spearman correlation test | N=0 |
Table S1. Basic characteristics of clinical feature: 'AGE'
| AGE | Mean (SD) | 60.46 (6.9) |
| Significant markers | N = 1 | |
| pos. correlated | 1 | |
| neg. correlated | 0 |
Table S2. Get Full Table List of one gene significantly correlated to 'AGE' by Spearman correlation test
| SpearmanCorr | corrP | Q | |
|---|---|---|---|
| ADAP2|55803 | 0.3828 | 1.041e-06 | 0.019 |
Figure S1. Get High-res Image As an example, this figure shows the association of ADAP2|55803 to 'AGE'. P value = 1.04e-06 with Spearman correlation analysis. The straight line presents the best linear regression.
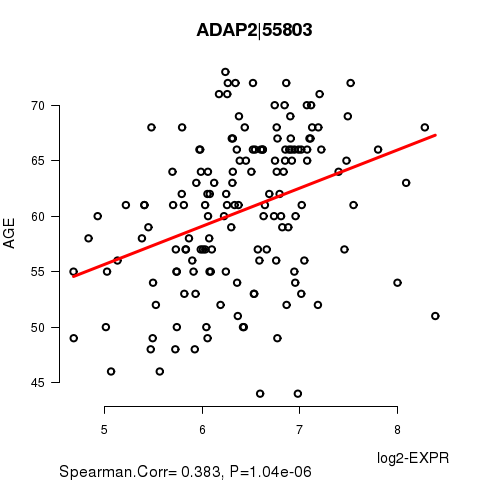
Table S3. Basic characteristics of clinical feature: 'LYMPH.NODE.METASTASIS'
| LYMPH.NODE.METASTASIS | Labels | N |
| N0 | 121 | |
| N1 | 15 | |
| Significant markers | N = 4 | |
| Higher in N1 | 2 | |
| Higher in N0 | 2 |
Table S4. Get Full Table List of 4 genes differentially expressed by 'LYMPH.NODE.METASTASIS'
| T(pos if higher in 'N1') | ttestP | Q | AUC | |
|---|---|---|---|---|
| CRHR2|1395 | -8.37 | 7.97e-08 | 0.00145 | 0.9429 |
| NKX6-2|84504 | -6.35 | 2.202e-07 | 0.00402 | 0.8547 |
| NUP62CL|54830 | 6.2 | 1.301e-06 | 0.0237 | 0.8225 |
| SEC24A|10802 | 5.66 | 2.035e-06 | 0.0371 | 0.7708 |
Figure S2. Get High-res Image As an example, this figure shows the association of CRHR2|1395 to 'LYMPH.NODE.METASTASIS'. P value = 7.97e-08 with T-test analysis.
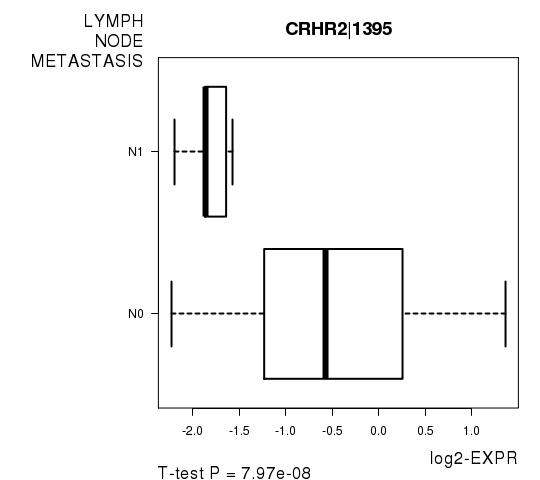
Table S5. Basic characteristics of clinical feature: 'COMPLETENESS.OF.RESECTION'
| COMPLETENESS.OF.RESECTION | Labels | N |
| R0 | 117 | |
| R1 | 29 | |
| RX | 2 | |
| Significant markers | N = 1 |
Table S6. Get Full Table List of one gene differentially expressed by 'COMPLETENESS.OF.RESECTION'
| ANOVA_P | Q | |
|---|---|---|
| GLP2R|9340 | 9.218e-10 | 1.68e-05 |
Figure S3. Get High-res Image As an example, this figure shows the association of GLP2R|9340 to 'COMPLETENESS.OF.RESECTION'. P value = 9.22e-10 with ANOVA analysis.
-
Expresson data file = PRAD-TP.uncv2.mRNAseq_RSEM_normalized_log2.txt
-
Clinical data file = PRAD-TP.clin.merged.picked.txt
-
Number of patients = 154
-
Number of genes = 18257
-
Number of clinical features = 4
For continuous numerical clinical features, Spearman's rank correlation coefficients (Spearman 1904) and two-tailed P values were estimated using 'cor.test' function in R
For two-class clinical features, two-tailed Student's t test with unequal variance (Lehmann and Romano 2005) was applied to compare the log2-expression levels between the two clinical classes using 't.test' function in R
For multi-class clinical features (ordinal or nominal), one-way analysis of variance (Howell 2002) was applied to compare the log2-expression levels between different clinical classes using 'anova' function in R
For multiple hypothesis correction, Q value is the False Discovery Rate (FDR) analogue of the P value (Benjamini and Hochberg 1995), defined as the minimum FDR at which the test may be called significant. We used the 'Benjamini and Hochberg' method of 'p.adjust' function in R to convert P values into Q values.
This is an experimental feature. The full results of the analysis summarized in this report can be downloaded from the TCGA Data Coordination Center.