This pipeline computes the correlation between significant arm-level copy number variations (cnvs) and subtypes.
Testing the association between copy number variation 29 arm-level results and 8 molecular subtypes across 187 patients, 7 significant findings detected with Q value < 0.25.
-
7p gain cnv correlated to 'CN_CNMF'.
-
8q gain cnv correlated to 'CN_CNMF'.
-
8p loss cnv correlated to 'METHLYATION_CNMF'.
-
16q loss cnv correlated to 'CN_CNMF'.
-
17p loss cnv correlated to 'CN_CNMF'.
-
18p loss cnv correlated to 'CN_CNMF'.
-
18q loss cnv correlated to 'CN_CNMF'.
Table 1. Get Full Table Overview of the association between significant copy number variation of 29 arm-level results and 8 molecular subtypes. Shown in the table are P values (Q values). Thresholded by Q value < 0.25, 7 significant findings detected.
|
Molecular subtypes |
CN CNMF |
METHLYATION CNMF |
MRNASEQ CNMF |
MRNASEQ CHIERARCHICAL |
MIRSEQ CNMF |
MIRSEQ CHIERARCHICAL |
MIRSEQ MATURE CNMF |
MIRSEQ MATURE CHIERARCHICAL |
||
| nCNV (%) | nWild-Type | Fisher's exact test | Fisher's exact test | Fisher's exact test | Fisher's exact test | Fisher's exact test | Fisher's exact test | Chi-square test | Fisher's exact test | |
| 7p gain | 0 (0%) | 171 |
0.000281 (0.0624) |
0.126 (1.00) |
0.109 (1.00) |
0.139 (1.00) |
0.17 (1.00) |
0.592 (1.00) |
0.36 (1.00) |
0.499 (1.00) |
| 8q gain | 0 (0%) | 168 |
5.57e-05 (0.0124) |
0.0536 (1.00) |
0.0856 (1.00) |
0.243 (1.00) |
0.12 (1.00) |
0.00324 (0.706) |
0.0495 (1.00) |
0.549 (1.00) |
| 8p loss | 0 (0%) | 140 |
0.00278 (0.609) |
2.75e-05 (0.0062) |
0.00326 (0.707) |
0.0331 (1.00) |
0.0193 (1.00) |
1 (1.00) |
0.0158 (1.00) |
0.623 (1.00) |
| 16q loss | 0 (0%) | 163 |
3.66e-05 (0.0082) |
0.00974 (1.00) |
0.18 (1.00) |
0.199 (1.00) |
0.0754 (1.00) |
0.103 (1.00) |
0.028 (1.00) |
0.897 (1.00) |
| 17p loss | 0 (0%) | 166 |
6.43e-06 (0.00146) |
0.0292 (1.00) |
0.0996 (1.00) |
0.0171 (1.00) |
0.705 (1.00) |
0.907 (1.00) |
0.0711 (1.00) |
0.276 (1.00) |
| 18p loss | 0 (0%) | 169 |
2.52e-05 (0.00569) |
0.0512 (1.00) |
0.363 (1.00) |
0.257 (1.00) |
0.0156 (1.00) |
0.122 (1.00) |
0.185 (1.00) |
0.0973 (1.00) |
| 18q loss | 0 (0%) | 163 |
1.1e-08 (2.51e-06) |
0.015 (1.00) |
0.0886 (1.00) |
0.219 (1.00) |
0.0398 (1.00) |
0.182 (1.00) |
0.153 (1.00) |
0.32 (1.00) |
| 1p gain | 0 (0%) | 184 |
0.0678 (1.00) |
0.182 (1.00) |
0.496 (1.00) |
0.41 (1.00) |
0.439 (1.00) |
0.625 (1.00) |
||
| 1q gain | 0 (0%) | 182 |
0.139 (1.00) |
0.476 (1.00) |
0.551 (1.00) |
0.3 (1.00) |
0.324 (1.00) |
0.201 (1.00) |
0.256 (1.00) |
0.7 (1.00) |
| 3p gain | 0 (0%) | 182 |
0.254 (1.00) |
0.773 (1.00) |
0.0637 (1.00) |
0.362 (1.00) |
0.17 (1.00) |
0.155 (1.00) |
0.23 (1.00) |
0.7 (1.00) |
| 3q gain | 0 (0%) | 181 |
0.138 (1.00) |
0.931 (1.00) |
0.0198 (1.00) |
0.00561 (1.00) |
0.055 (1.00) |
0.0354 (1.00) |
0.605 (1.00) |
1 (1.00) |
| 7q gain | 0 (0%) | 173 |
0.00226 (0.498) |
0.125 (1.00) |
0.182 (1.00) |
0.227 (1.00) |
0.477 (1.00) |
0.598 (1.00) |
0.543 (1.00) |
0.832 (1.00) |
| 8p gain | 0 (0%) | 179 |
0.0103 (1.00) |
0.126 (1.00) |
0.396 (1.00) |
0.0935 (1.00) |
0.852 (1.00) |
0.395 (1.00) |
0.396 (1.00) |
0.77 (1.00) |
| 9p gain | 0 (0%) | 184 |
0.0678 (1.00) |
0.128 (1.00) |
0.644 (1.00) |
0.625 (1.00) |
0.862 (1.00) |
0.41 (1.00) |
0.206 (1.00) |
1 (1.00) |
| 9q gain | 0 (0%) | 181 |
0.0762 (1.00) |
0.355 (1.00) |
0.132 (1.00) |
0.229 (1.00) |
0.569 (1.00) |
0.56 (1.00) |
0.674 (1.00) |
1 (1.00) |
| 10q gain | 0 (0%) | 183 |
0.278 (1.00) |
0.419 (1.00) |
0.211 (1.00) |
0.3 (1.00) |
0.55 (1.00) |
0.172 (1.00) |
0.441 (1.00) |
1 (1.00) |
| 12q gain | 0 (0%) | 184 |
0.201 (1.00) |
0.664 (1.00) |
0.567 (1.00) |
1 (1.00) |
0.181 (1.00) |
0.625 (1.00) |
||
| 16p gain | 0 (0%) | 184 |
0.598 (1.00) |
0.342 (1.00) |
0.776 (1.00) |
0.261 (1.00) |
0.496 (1.00) |
1 (1.00) |
0.439 (1.00) |
0.625 (1.00) |
| 16q gain | 0 (0%) | 184 |
0.598 (1.00) |
0.342 (1.00) |
0.776 (1.00) |
0.261 (1.00) |
0.496 (1.00) |
1 (1.00) |
0.439 (1.00) |
0.625 (1.00) |
| 5q loss | 0 (0%) | 182 |
0.0138 (1.00) |
0.147 (1.00) |
0.0637 (1.00) |
0.362 (1.00) |
0.09 (1.00) |
0.0892 (1.00) |
0.749 (1.00) |
1 (1.00) |
| 6q loss | 0 (0%) | 180 |
0.0157 (1.00) |
0.215 (1.00) |
0.0714 (1.00) |
0.0935 (1.00) |
0.319 (1.00) |
0.176 (1.00) |
0.663 (1.00) |
1 (1.00) |
| 8q loss | 0 (0%) | 183 |
0.278 (1.00) |
0.486 (1.00) |
0.329 (1.00) |
0.388 (1.00) |
0.834 (1.00) |
0.309 (1.00) |
0.423 (1.00) |
0.396 (1.00) |
| 10p loss | 0 (0%) | 182 |
0.439 (1.00) |
0.424 (1.00) |
0.551 (1.00) |
0.3 (1.00) |
0.234 (1.00) |
0.0246 (1.00) |
0.705 (1.00) |
1 (1.00) |
| 10q loss | 0 (0%) | 182 |
0.439 (1.00) |
0.671 (1.00) |
0.625 (1.00) |
0.866 (1.00) |
0.545 (1.00) |
1 (1.00) |
0.705 (1.00) |
1 (1.00) |
| 12p loss | 0 (0%) | 177 |
0.198 (1.00) |
0.0307 (1.00) |
0.139 (1.00) |
0.0123 (1.00) |
0.0682 (1.00) |
0.252 (1.00) |
0.0135 (1.00) |
0.615 (1.00) |
| 13q loss | 0 (0%) | 175 |
0.00145 (0.32) |
0.311 (1.00) |
0.0284 (1.00) |
0.0349 (1.00) |
0.449 (1.00) |
0.648 (1.00) |
0.343 (1.00) |
0.81 (1.00) |
| 20p loss | 0 (0%) | 182 |
0.363 (1.00) |
0.0317 (1.00) |
0.211 (1.00) |
0.133 (1.00) |
0.0473 (1.00) |
0.0246 (1.00) |
0.0171 (1.00) |
0.271 (1.00) |
| 21q loss | 0 (0%) | 183 |
0.278 (1.00) |
0.634 (1.00) |
0.329 (1.00) |
0.0963 (1.00) |
0.352 (1.00) |
0.83 (1.00) |
0.638 (1.00) |
1 (1.00) |
| 22q loss | 0 (0%) | 182 |
0.0646 (1.00) |
0.476 (1.00) |
0.377 (1.00) |
0.452 (1.00) |
1 (1.00) |
1 (1.00) |
0.338 (1.00) |
1 (1.00) |
P value = 0.000281 (Fisher's exact test), Q value = 0.062
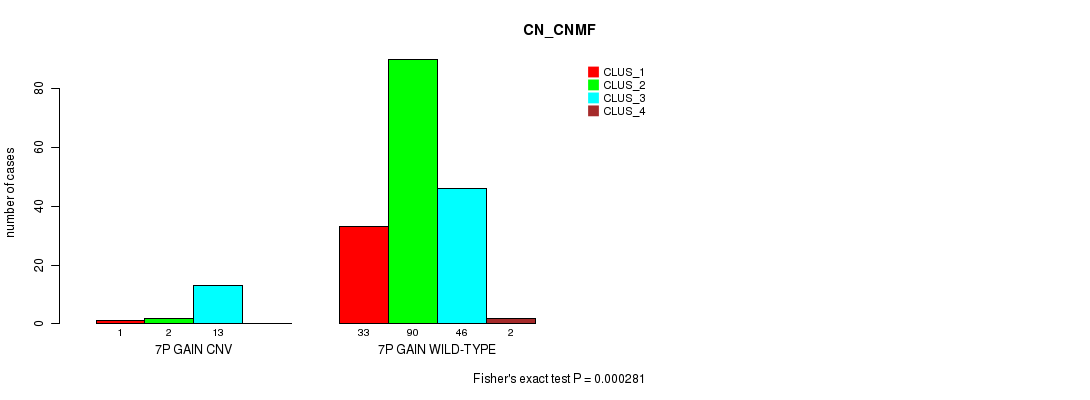
Table S1. Gene #5: '7p gain' versus Molecular Subtype #1: 'CN_CNMF'
| nPatients | CLUS_1 | CLUS_2 | CLUS_3 | CLUS_4 |
|---|---|---|---|---|
| ALL | 34 | 92 | 59 | 2 |
| 7P GAIN CNV | 1 | 2 | 13 | 0 |
| 7P GAIN WILD-TYPE | 33 | 90 | 46 | 2 |
Figure S1. Get High-res Image Gene #5: '7p gain' versus Molecular Subtype #1: 'CN_CNMF'
P value = 5.57e-05 (Fisher's exact test), Q value = 0.012
Table S2. Gene #8: '8q gain' versus Molecular Subtype #1: 'CN_CNMF'
| nPatients | CLUS_1 | CLUS_2 | CLUS_3 | CLUS_4 |
|---|---|---|---|---|
| ALL | 34 | 92 | 59 | 2 |
| 8Q GAIN CNV | 2 | 2 | 15 | 0 |
| 8Q GAIN WILD-TYPE | 32 | 90 | 44 | 2 |
Figure S2. Get High-res Image Gene #8: '8q gain' versus Molecular Subtype #1: 'CN_CNMF'

P value = 2.75e-05 (Fisher's exact test), Q value = 0.0062
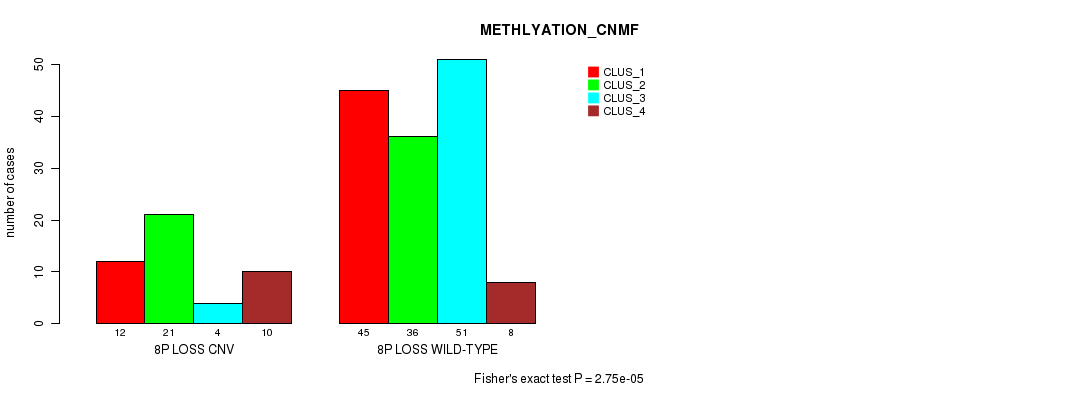
Table S3. Gene #17: '8p loss' versus Molecular Subtype #2: 'METHLYATION_CNMF'
| nPatients | CLUS_1 | CLUS_2 | CLUS_3 | CLUS_4 |
|---|---|---|---|---|
| ALL | 57 | 57 | 55 | 18 |
| 8P LOSS CNV | 12 | 21 | 4 | 10 |
| 8P LOSS WILD-TYPE | 45 | 36 | 51 | 8 |
Figure S3. Get High-res Image Gene #17: '8p loss' versus Molecular Subtype #2: 'METHLYATION_CNMF'
P value = 3.66e-05 (Fisher's exact test), Q value = 0.0082
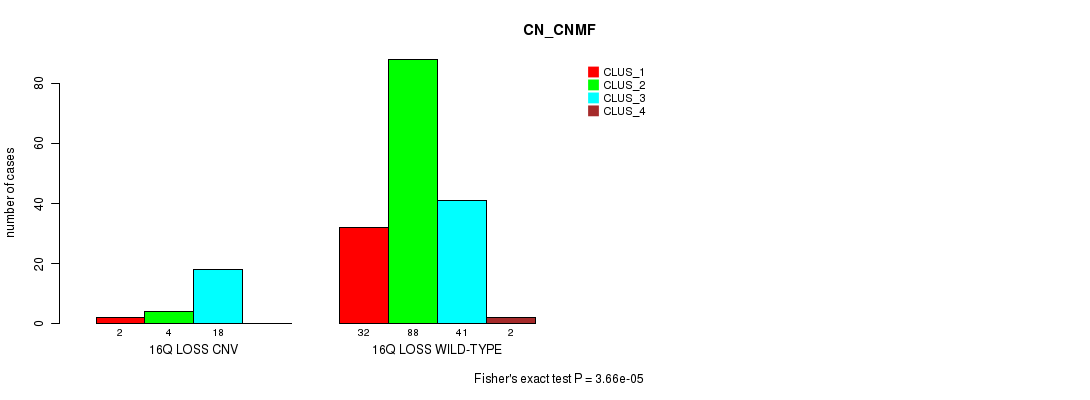
Table S4. Gene #23: '16q loss' versus Molecular Subtype #1: 'CN_CNMF'
| nPatients | CLUS_1 | CLUS_2 | CLUS_3 | CLUS_4 |
|---|---|---|---|---|
| ALL | 34 | 92 | 59 | 2 |
| 16Q LOSS CNV | 2 | 4 | 18 | 0 |
| 16Q LOSS WILD-TYPE | 32 | 88 | 41 | 2 |
Figure S4. Get High-res Image Gene #23: '16q loss' versus Molecular Subtype #1: 'CN_CNMF'
P value = 6.43e-06 (Fisher's exact test), Q value = 0.0015
Table S5. Gene #24: '17p loss' versus Molecular Subtype #1: 'CN_CNMF'
| nPatients | CLUS_1 | CLUS_2 | CLUS_3 | CLUS_4 |
|---|---|---|---|---|
| ALL | 34 | 92 | 59 | 2 |
| 17P LOSS CNV | 0 | 4 | 17 | 0 |
| 17P LOSS WILD-TYPE | 34 | 88 | 42 | 2 |
Figure S5. Get High-res Image Gene #24: '17p loss' versus Molecular Subtype #1: 'CN_CNMF'

P value = 2.52e-05 (Fisher's exact test), Q value = 0.0057
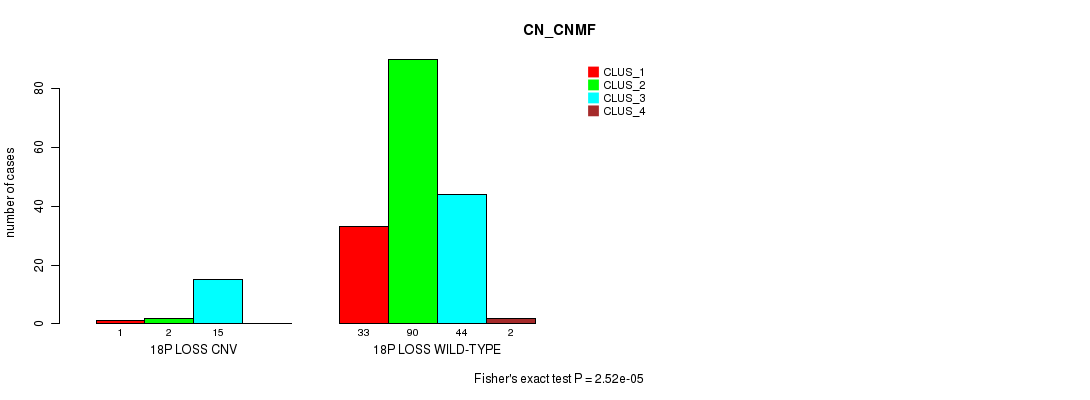
Table S6. Gene #25: '18p loss' versus Molecular Subtype #1: 'CN_CNMF'
| nPatients | CLUS_1 | CLUS_2 | CLUS_3 | CLUS_4 |
|---|---|---|---|---|
| ALL | 34 | 92 | 59 | 2 |
| 18P LOSS CNV | 1 | 2 | 15 | 0 |
| 18P LOSS WILD-TYPE | 33 | 90 | 44 | 2 |
Figure S6. Get High-res Image Gene #25: '18p loss' versus Molecular Subtype #1: 'CN_CNMF'
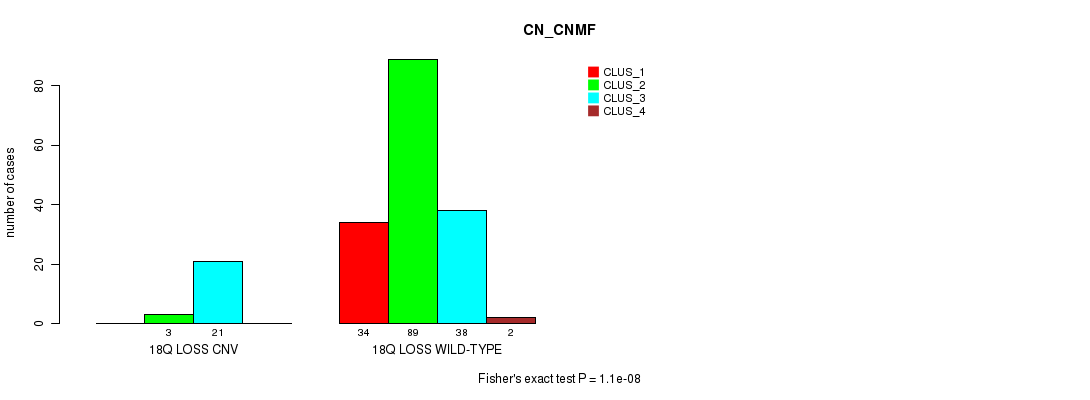
P value = 1.1e-08 (Fisher's exact test), Q value = 2.5e-06
Table S7. Gene #26: '18q loss' versus Molecular Subtype #1: 'CN_CNMF'
| nPatients | CLUS_1 | CLUS_2 | CLUS_3 | CLUS_4 |
|---|---|---|---|---|
| ALL | 34 | 92 | 59 | 2 |
| 18Q LOSS CNV | 0 | 3 | 21 | 0 |
| 18Q LOSS WILD-TYPE | 34 | 89 | 38 | 2 |
Figure S7. Get High-res Image Gene #26: '18q loss' versus Molecular Subtype #1: 'CN_CNMF'
-
Mutation data file = broad_values_by_arm.mutsig.cluster.txt
-
Molecular subtypes file = PRAD-TP.transferedmergedcluster.txt
-
Number of patients = 187
-
Number of significantly arm-level cnvs = 29
-
Number of molecular subtypes = 8
-
Exclude genes that fewer than K tumors have mutations, K = 3
For binary or multi-class clinical features (nominal or ordinal), two-tailed Fisher's exact tests (Fisher 1922) were used to estimate the P values using the 'fisher.test' function in R
For multi-class clinical features (nominal or ordinal), Chi-square tests (Greenwood and Nikulin 1996) were used to estimate the P values using the 'chisq.test' function in R
For multiple hypothesis correction, Q value is the False Discovery Rate (FDR) analogue of the P value (Benjamini and Hochberg 1995), defined as the minimum FDR at which the test may be called significant. We used the 'Benjamini and Hochberg' method of 'p.adjust' function in R to convert P values into Q values.
This is an experimental feature. The full results of the analysis summarized in this report can be downloaded from the TCGA Data Coordination Center.