This pipeline uses various statistical tests to identify mRNAs whose expression levels correlated to selected clinical features.
Testing the association between 17814 genes and 9 clinical features across 69 samples, statistically thresholded by Q value < 0.05, 4 clinical features related to at least one genes.
-
11 genes correlated to 'GENDER'.
-
DDX3Y , RPS4Y1 , RPS4Y2 , EIF1AY , JARID1D , ...
-
10 genes correlated to 'HISTOLOGICAL.TYPE'.
-
TLE6 , FBXO2 , PLCB2 , AGR3 , RAB27B , ...
-
16 genes correlated to 'COMPLETENESS.OF.RESECTION'.
-
CASQ2 , LDB3 , NNAT , PSD , STMN4 , ...
-
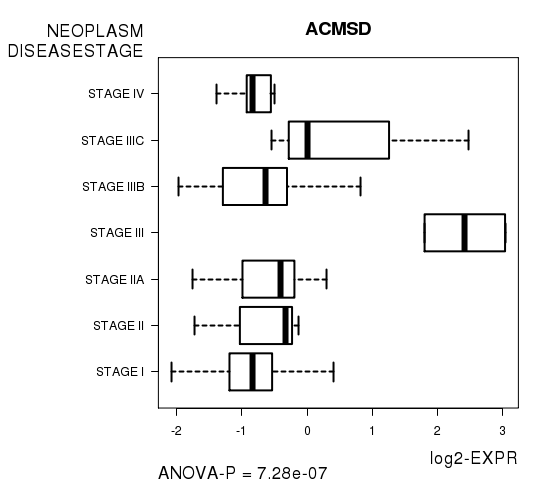
2 genes correlated to 'NEOPLASM.DISEASESTAGE'.
-
ACMSD , LHFPL3
-
No genes correlated to 'Time to Death', 'AGE', 'DISTANT.METASTASIS', 'LYMPH.NODE.METASTASIS', and 'NUMBER.OF.LYMPH.NODES'.
Complete statistical result table is provided in Supplement Table 1
Table 1. Get Full Table This table shows the clinical features, statistical methods used, and the number of genes that are significantly associated with each clinical feature at Q value < 0.05.
| Clinical feature | Statistical test | Significant genes | Associated with | Associated with | ||
|---|---|---|---|---|---|---|
| Time to Death | Cox regression test | N=0 | ||||
| AGE | Spearman correlation test | N=0 | ||||
| GENDER | t test | N=11 | male | N=11 | female | N=0 |
| HISTOLOGICAL TYPE | t test | N=10 | rectal mucinous adenocarcinoma | N=8 | rectal adenocarcinoma | N=2 |
| DISTANT METASTASIS | t test | N=0 | ||||
| LYMPH NODE METASTASIS | ANOVA test | N=0 | ||||
| COMPLETENESS OF RESECTION | ANOVA test | N=16 | ||||
| NUMBER OF LYMPH NODES | Spearman correlation test | N=0 | ||||
| NEOPLASM DISEASESTAGE | ANOVA test | N=2 |
Table S1. Basic characteristics of clinical feature: 'Time to Death'
| Time to Death | Duration (Months) | 0.9-52 (median=4) |
| censored | N = 40 | |
| death | N = 4 | |
| Significant markers | N = 0 |
Table S2. Basic characteristics of clinical feature: 'AGE'
| AGE | Mean (SD) | 66.62 (11) |
| Significant markers | N = 0 |
Table S3. Basic characteristics of clinical feature: 'GENDER'
| GENDER | Labels | N |
| FEMALE | 31 | |
| MALE | 38 | |
| Significant markers | N = 11 | |
| Higher in MALE | 11 | |
| Higher in FEMALE | 0 |
Table S4. Get Full Table List of top 10 genes differentially expressed by 'GENDER'
| T(pos if higher in 'MALE') | ttestP | Q | AUC | |
|---|---|---|---|---|
| DDX3Y | 12.63 | 2.827e-19 | 5.04e-15 | 0.9635 |
| RPS4Y1 | 12 | 2.772e-17 | 4.94e-13 | 0.9228 |
| RPS4Y2 | 11.53 | 1.686e-16 | 3e-12 | 0.9635 |
| EIF1AY | 11 | 1.948e-16 | 3.47e-12 | 0.9576 |
| JARID1D | 10.56 | 7.559e-16 | 1.35e-11 | 0.9482 |
| CYORF15A | 10.06 | 1.466e-14 | 2.61e-10 | 0.9465 |
| UTY | 8.06 | 3.114e-11 | 5.55e-07 | 0.9134 |
| CYORF15B | 7.86 | 5.263e-11 | 9.37e-07 | 0.9049 |
| ZFY | 7.56 | 1.75e-10 | 3.12e-06 | 0.893 |
| TTTY14 | 5.79 | 2.479e-07 | 0.00441 | 0.9011 |
Figure S1. Get High-res Image As an example, this figure shows the association of DDX3Y to 'GENDER'. P value = 2.83e-19 with T-test analysis.
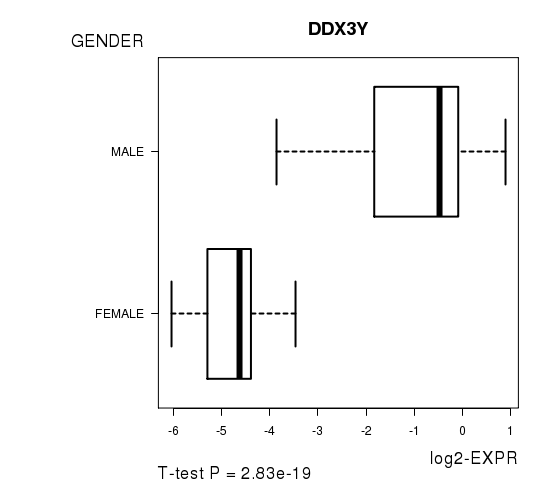
Table S5. Basic characteristics of clinical feature: 'HISTOLOGICAL.TYPE'
| HISTOLOGICAL.TYPE | Labels | N |
| RECTAL ADENOCARCINOMA | 58 | |
| RECTAL MUCINOUS ADENOCARCINOMA | 7 | |
| Significant markers | N = 10 | |
| Higher in RECTAL MUCINOUS ADENOCARCINOMA | 8 | |
| Higher in RECTAL ADENOCARCINOMA | 2 |
Table S6. Get Full Table List of 10 genes differentially expressed by 'HISTOLOGICAL.TYPE'
| T(pos if higher in 'RECTAL MUCINOUS ADENOCARCINOMA') | ttestP | Q | AUC | |
|---|---|---|---|---|
| TLE6 | 13.32 | 1.328e-18 | 2.37e-14 | 0.9828 |
| FBXO2 | -7.35 | 8.488e-10 | 1.51e-05 | 0.8522 |
| PLCB2 | 7.42 | 4.681e-08 | 0.000834 | 0.9163 |
| AGR3 | 6.7 | 2.069e-07 | 0.00369 | 0.8695 |
| RAB27B | 6.58 | 2.286e-07 | 0.00407 | 0.8695 |
| BACE2 | 6.35 | 2.907e-07 | 0.00518 | 0.8473 |
| OXCT1 | 5.87 | 7.735e-07 | 0.0138 | 0.9015 |
| CARD6 | 6.01 | 9.658e-07 | 0.0172 | 0.8399 |
| USP42 | -5.76 | 1.952e-06 | 0.0348 | 0.8399 |
| TTLL7 | 7.32 | 1.956e-06 | 0.0348 | 0.9458 |
Figure S2. Get High-res Image As an example, this figure shows the association of TLE6 to 'HISTOLOGICAL.TYPE'. P value = 1.33e-18 with T-test analysis.
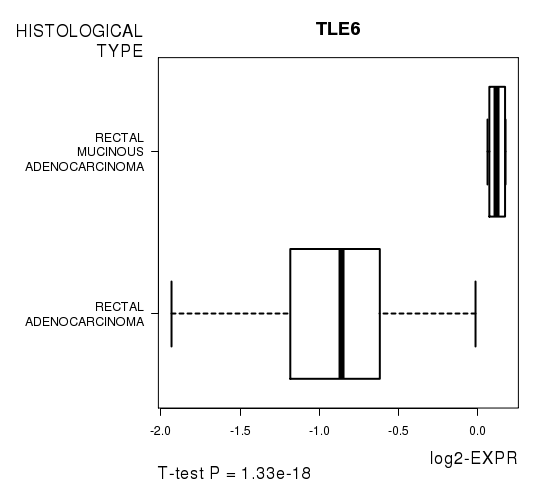
Table S7. Basic characteristics of clinical feature: 'DISTANT.METASTASIS'
| DISTANT.METASTASIS | Labels | N |
| M0 | 57 | |
| M1 | 12 | |
| Significant markers | N = 0 |
Table S8. Basic characteristics of clinical feature: 'LYMPH.NODE.METASTASIS'
| LYMPH.NODE.METASTASIS | Labels | N |
| N0 | 42 | |
| N1 | 14 | |
| N1A | 1 | |
| N2 | 12 | |
| Significant markers | N = 0 |
Table S9. Basic characteristics of clinical feature: 'COMPLETENESS.OF.RESECTION'
| COMPLETENESS.OF.RESECTION | Labels | N |
| R0 | 57 | |
| R1 | 1 | |
| R2 | 10 | |
| Significant markers | N = 16 |
Table S10. Get Full Table List of top 10 genes differentially expressed by 'COMPLETENESS.OF.RESECTION'
| ANOVA_P | Q | |
|---|---|---|
| CASQ2 | 8.109e-11 | 1.44e-06 |
| LDB3 | 3.545e-10 | 6.31e-06 |
| NNAT | 7.166e-10 | 1.28e-05 |
| PSD | 1.319e-08 | 0.000235 |
| STMN4 | 2.034e-08 | 0.000362 |
| DMN | 7.983e-08 | 0.00142 |
| GPM6A | 5.838e-07 | 0.0104 |
| MYH3 | 6.403e-07 | 0.0114 |
| SYT4 | 7.534e-07 | 0.0134 |
| KIAA1881 | 1.054e-06 | 0.0188 |
Figure S3. Get High-res Image As an example, this figure shows the association of CASQ2 to 'COMPLETENESS.OF.RESECTION'. P value = 8.11e-11 with ANOVA analysis.
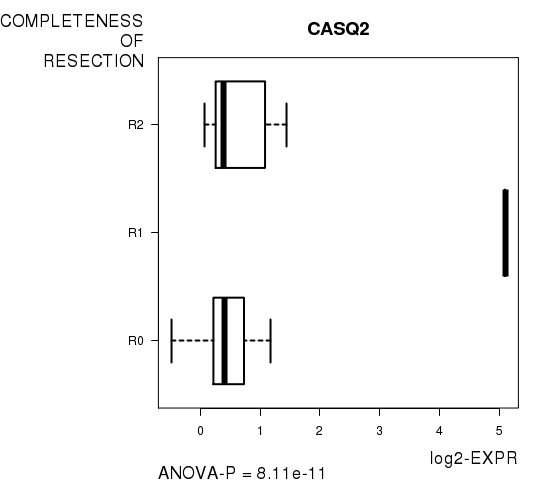
Table S11. Basic characteristics of clinical feature: 'NUMBER.OF.LYMPH.NODES'
| NUMBER.OF.LYMPH.NODES | Mean (SD) | 2.19 (5.1) |
| Significant markers | N = 0 |
Table S12. Basic characteristics of clinical feature: 'NEOPLASM.DISEASESTAGE'
| NEOPLASM.DISEASESTAGE | Labels | N |
| STAGE I | 18 | |
| STAGE II | 3 | |
| STAGE IIA | 20 | |
| STAGE III | 2 | |
| STAGE IIIB | 10 | |
| STAGE IIIC | 4 | |
| STAGE IV | 11 | |
| Significant markers | N = 2 |
Table S13. Get Full Table List of 2 genes differentially expressed by 'NEOPLASM.DISEASESTAGE'
| ANOVA_P | Q | |
|---|---|---|
| ACMSD | 7.275e-07 | 0.013 |
| LHFPL3 | 1.601e-06 | 0.0285 |
Figure S4. Get High-res Image As an example, this figure shows the association of ACMSD to 'NEOPLASM.DISEASESTAGE'. P value = 7.28e-07 with ANOVA analysis.
-
Expresson data file = READ-TP.medianexp.txt
-
Clinical data file = READ-TP.clin.merged.picked.txt
-
Number of patients = 69
-
Number of genes = 17814
-
Number of clinical features = 9
For survival clinical features, Wald's test in univariate Cox regression analysis with proportional hazards model (Andersen and Gill 1982) was used to estimate the P values using the 'coxph' function in R. Kaplan-Meier survival curves were plot using the four quartile subgroups of patients based on expression levels
For continuous numerical clinical features, Spearman's rank correlation coefficients (Spearman 1904) and two-tailed P values were estimated using 'cor.test' function in R
For two-class clinical features, two-tailed Student's t test with unequal variance (Lehmann and Romano 2005) was applied to compare the log2-expression levels between the two clinical classes using 't.test' function in R
For multi-class clinical features (ordinal or nominal), one-way analysis of variance (Howell 2002) was applied to compare the log2-expression levels between different clinical classes using 'anova' function in R
For multiple hypothesis correction, Q value is the False Discovery Rate (FDR) analogue of the P value (Benjamini and Hochberg 1995), defined as the minimum FDR at which the test may be called significant. We used the 'Benjamini and Hochberg' method of 'p.adjust' function in R to convert P values into Q values.
This is an experimental feature. The full results of the analysis summarized in this report can be downloaded from the TCGA Data Coordination Center.