This pipeline computes the correlation between significantly recurrent gene mutations and molecular subtypes.
Testing the association between mutation status of 3 genes and 7 molecular subtypes across 69 patients, 4 significant findings detected with P value < 0.05 and Q value < 0.25.
-
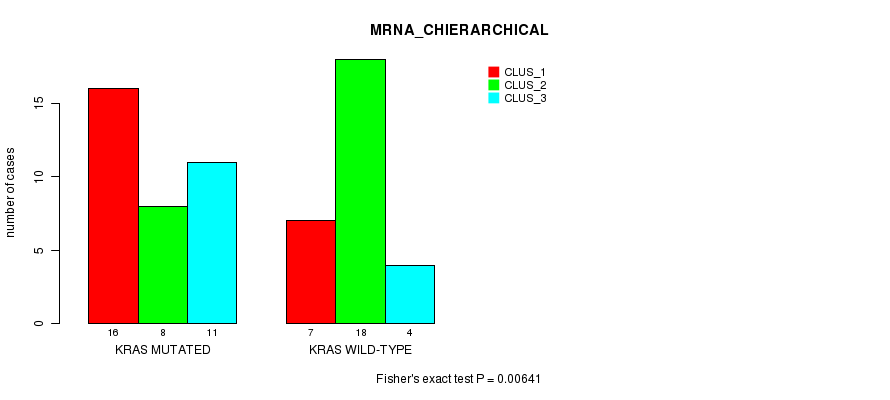
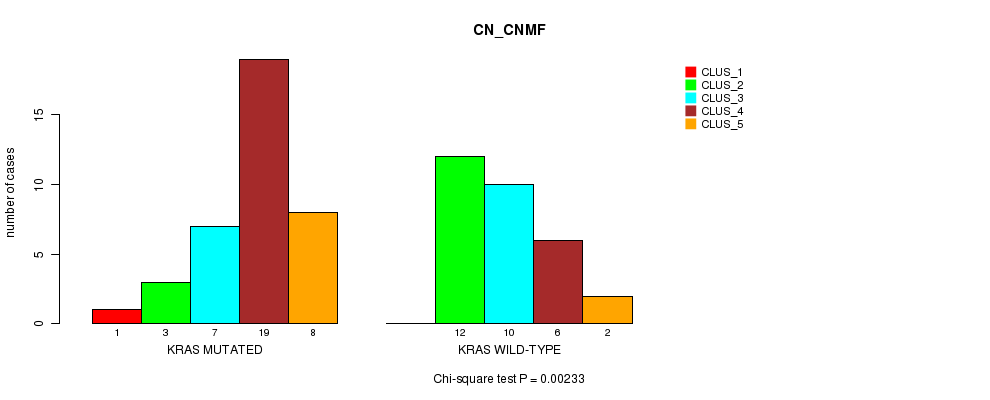
KRAS mutation correlated to 'MRNA_CHIERARCHICAL' and 'CN_CNMF'.
-
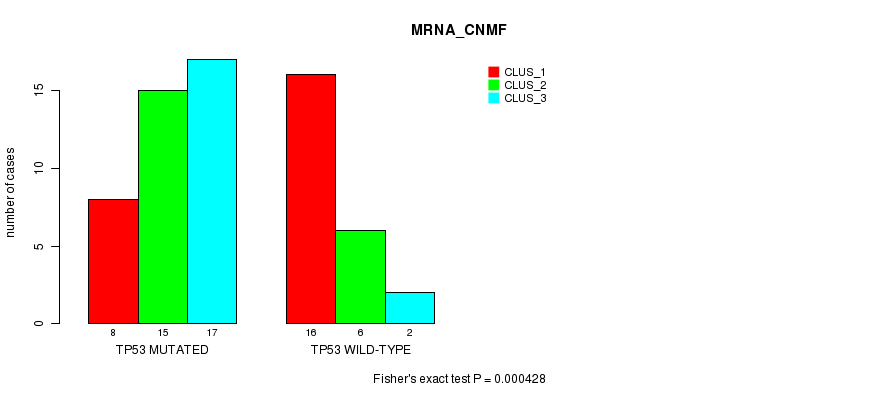
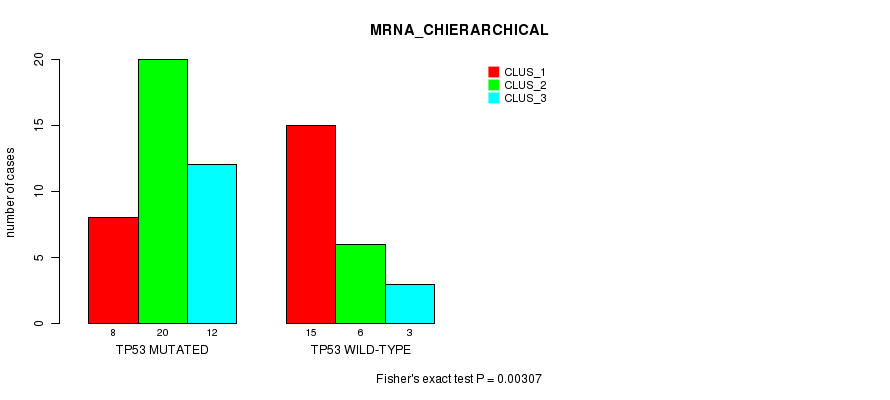
TP53 mutation correlated to 'MRNA_CNMF' and 'MRNA_CHIERARCHICAL'.
Table 1. Get Full Table Overview of the association between mutation status of 3 genes and 7 molecular subtypes. Shown in the table are P values (Q values). Thresholded by P value < 0.05 and Q value < 0.25, 4 significant findings detected.
|
Clinical Features |
MRNA CNMF |
MRNA CHIERARCHICAL |
CN CNMF |
RPPA CNMF |
RPPA CHIERARCHICAL |
MIRSEQ CNMF |
MIRSEQ CHIERARCHICAL |
||
| nMutated (%) | nWild-Type | Fisher's exact test | Fisher's exact test | Chi-square test | Fisher's exact test | Chi-square test | Fisher's exact test | Fisher's exact test | |
| KRAS | 38 (55%) | 31 |
0.249 (1.00) |
0.00641 (0.115) |
0.00233 (0.0467) |
0.83 (1.00) |
0.817 (1.00) |
0.292 (1.00) |
0.0465 (0.79) |
| TP53 | 45 (65%) | 24 |
0.000428 (0.00899) |
0.00307 (0.0584) |
0.21 (1.00) |
0.16 (1.00) |
0.603 (1.00) |
0.812 (1.00) |
0.288 (1.00) |
| APC | 57 (83%) | 12 |
0.568 (1.00) |
0.849 (1.00) |
0.0561 (0.897) |
0.362 (1.00) |
0.598 (1.00) |
0.337 (1.00) |
1 (1.00) |
P value = 0.00641 (Fisher's exact test), Q value = 0.12
Table S1. Gene #2: 'KRAS MUTATION STATUS' versus Clinical Feature #2: 'MRNA_CHIERARCHICAL'
| nPatients | CLUS_1 | CLUS_2 | CLUS_3 |
|---|---|---|---|
| ALL | 23 | 26 | 15 |
| KRAS MUTATED | 16 | 8 | 11 |
| KRAS WILD-TYPE | 7 | 18 | 4 |
Figure S1. Get High-res Image Gene #2: 'KRAS MUTATION STATUS' versus Clinical Feature #2: 'MRNA_CHIERARCHICAL'
P value = 0.00233 (Chi-square test), Q value = 0.047
Table S2. Gene #2: 'KRAS MUTATION STATUS' versus Clinical Feature #3: 'CN_CNMF'
| nPatients | CLUS_1 | CLUS_2 | CLUS_3 | CLUS_4 | CLUS_5 |
|---|---|---|---|---|---|
| ALL | 1 | 15 | 17 | 25 | 10 |
| KRAS MUTATED | 1 | 3 | 7 | 19 | 8 |
| KRAS WILD-TYPE | 0 | 12 | 10 | 6 | 2 |
Figure S2. Get High-res Image Gene #2: 'KRAS MUTATION STATUS' versus Clinical Feature #3: 'CN_CNMF'
P value = 0.000428 (Fisher's exact test), Q value = 0.009
Table S3. Gene #3: 'TP53 MUTATION STATUS' versus Clinical Feature #1: 'MRNA_CNMF'
| nPatients | CLUS_1 | CLUS_2 | CLUS_3 |
|---|---|---|---|
| ALL | 24 | 21 | 19 |
| TP53 MUTATED | 8 | 15 | 17 |
| TP53 WILD-TYPE | 16 | 6 | 2 |
Figure S3. Get High-res Image Gene #3: 'TP53 MUTATION STATUS' versus Clinical Feature #1: 'MRNA_CNMF'
P value = 0.00307 (Fisher's exact test), Q value = 0.058
Table S4. Gene #3: 'TP53 MUTATION STATUS' versus Clinical Feature #2: 'MRNA_CHIERARCHICAL'
| nPatients | CLUS_1 | CLUS_2 | CLUS_3 |
|---|---|---|---|
| ALL | 23 | 26 | 15 |
| TP53 MUTATED | 8 | 20 | 12 |
| TP53 WILD-TYPE | 15 | 6 | 3 |
Figure S4. Get High-res Image Gene #3: 'TP53 MUTATION STATUS' versus Clinical Feature #2: 'MRNA_CHIERARCHICAL'
-
Mutation data file = READ-TP.mutsig.cluster.txt
-
Molecular subtypes file = READ-TP.transferedmergedcluster.txt
-
Number of patients = 69
-
Number of significantly mutated genes = 3
-
Number of Molecular subtypes = 7
-
Exclude genes that fewer than K tumors have mutations, K = 3
For binary or multi-class clinical features (nominal or ordinal), two-tailed Fisher's exact tests (Fisher 1922) were used to estimate the P values using the 'fisher.test' function in R
For multi-class clinical features (nominal or ordinal), Chi-square tests (Greenwood and Nikulin 1996) were used to estimate the P values using the 'chisq.test' function in R
For multiple hypothesis correction, Q value is the False Discovery Rate (FDR) analogue of the P value (Benjamini and Hochberg 1995), defined as the minimum FDR at which the test may be called significant. We used the 'Benjamini and Hochberg' method of 'p.adjust' function in R to convert P values into Q values.
This is an experimental feature. The full results of the analysis summarized in this report can be downloaded from the TCGA Data Coordination Center.