This report serves to describe the mutational landscape and properties of a given individual set, as well as rank genes and genesets according to mutational significance. MutSig v2.0 and MutSigCV v0.9 merged result was used to generate the results found in this report.
-
Working with individual set: READ-TP
-
Number of patients in set: 69
The input for this pipeline is a set of individuals with the following files associated for each:
-
An annotated .maf file describing the mutations called for the respective individual, and their properties.
-
A .wig file that contains information about the coverage of the sample.
-
MAF used for this analysis:READ-TP.final_analysis_set.maf
-
Significantly mutated genes (q ≤ 0.1): 3
-
Mutations seen in COSMIC: 222
-
Significantly mutated genes in COSMIC territory: 10
-
Significantly mutated genesets: 111
-
Read 38 MAFs of type "Broad"
-
Read 35 MAFs of type "Baylor-SOLiD"
-
Total number of mutations in input MAFs: 29413
-
After removing 257 invalidated mutations: 29156
-
After removing 200 noncoding mutations: 28956
-
After collapsing adjacent/redundant mutations: 21679
-
Number of mutations before filtering: 21679
-
After removing 200 mutations outside gene set: 21479
-
After removing 172 mutations outside category set: 21307
-
After removing 2 "impossible" mutations in
-
gene-patient-category bins of zero coverage: 20933
Table 1. Get Full Table Table representing breakdown of mutations by type.
| type | count |
|---|---|
| De_novo_Start_InFrame | 4 |
| De_novo_Start_OutOfFrame | 30 |
| Frame_Shift_Del | 151 |
| Frame_Shift_Ins | 155 |
| In_Frame_Del | 27 |
| In_Frame_Ins | 7 |
| Missense_Mutation | 14471 |
| Nonsense_Mutation | 1779 |
| Nonstop_Mutation | 6 |
| Read-through | 10 |
| Silent | 4629 |
| Splice_Site | 38 |
| Total | 21307 |
Table 2. Get Full Table A breakdown of mutation rates per category discovered for this individual set.
| category | n | N | rate | rate_per_mb | relative_rate |
|---|---|---|---|---|---|
| *CpG->T | 4919 | 99673101 | 0.000049 | 49 | 5.4 |
| *Cp(A/C/T)->mut | 6673 | 832257993 | 8e-06 | 8 | 0.89 |
| A->mut | 2743 | 908854391 | 3e-06 | 3 | 0.33 |
| *CpG->(G/A) | 135 | 99673101 | 1.4e-06 | 1.4 | 0.15 |
| indel+null | 2050 | 1840785523 | 1.1e-06 | 1.1 | 0.12 |
| double_null | 157 | 1840785523 | 8.5e-08 | 0.085 | 0.0094 |
| Total | 16677 | 1840785523 | 9.1e-06 | 9.1 | 1 |
The x axis represents the samples. The y axis represents the exons, one row per exon, and they are sorted by average coverage across samples. For exons with exactly the same average coverage, they are sorted next by the %GC of the exon. (The secondary sort is especially useful for the zero-coverage exons at the bottom).
Figure 1.
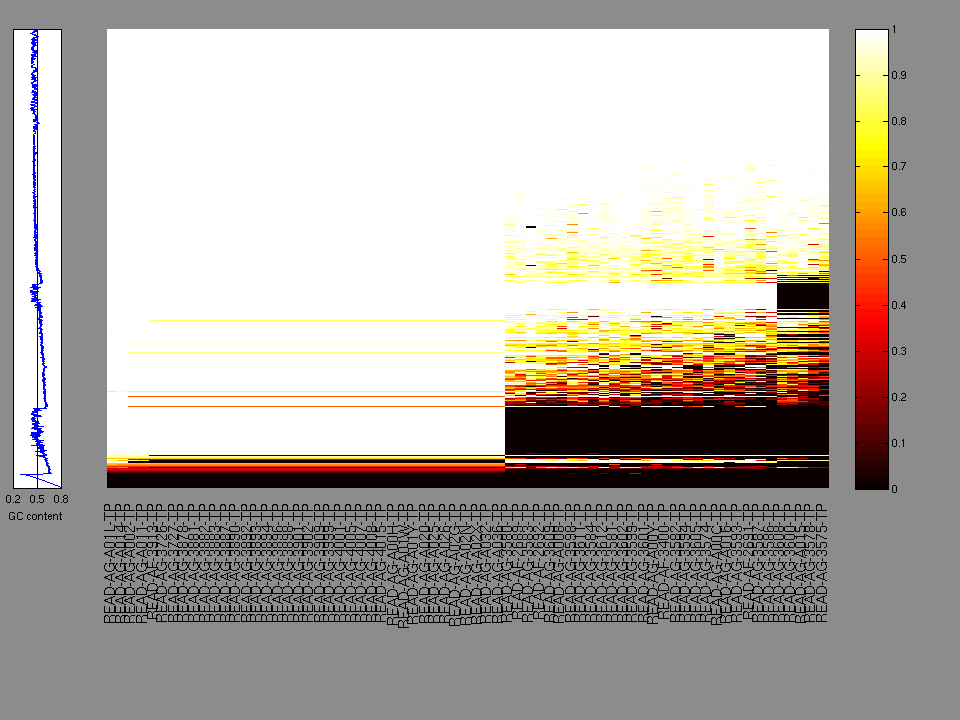
Figure 2. Patients counts and rates file used to generate this plot: READ-TP.patients.counts_and_rates.txt
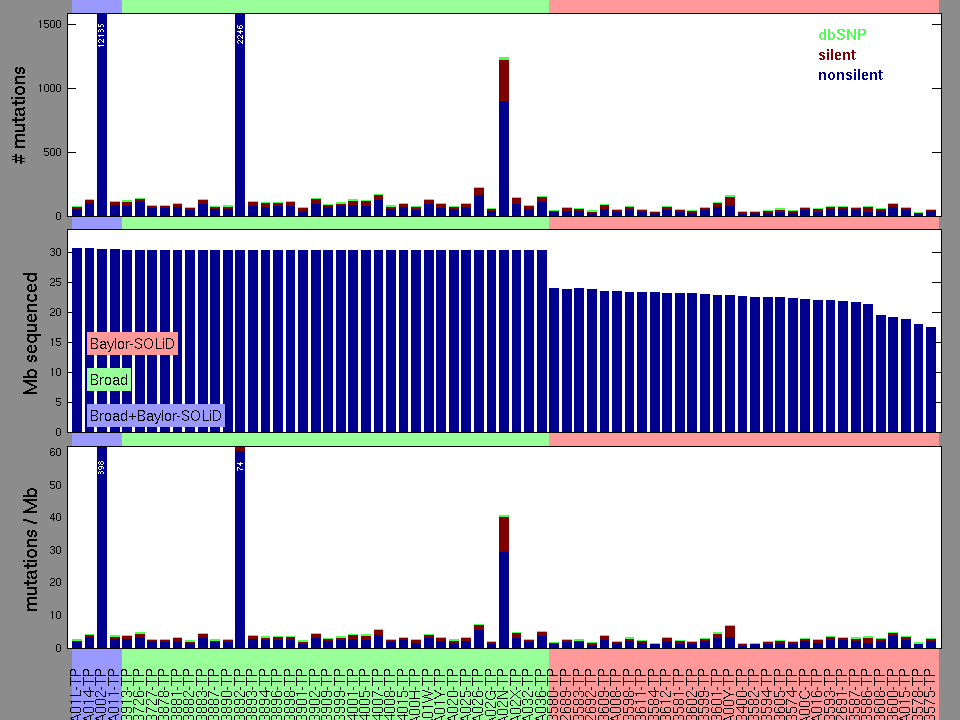
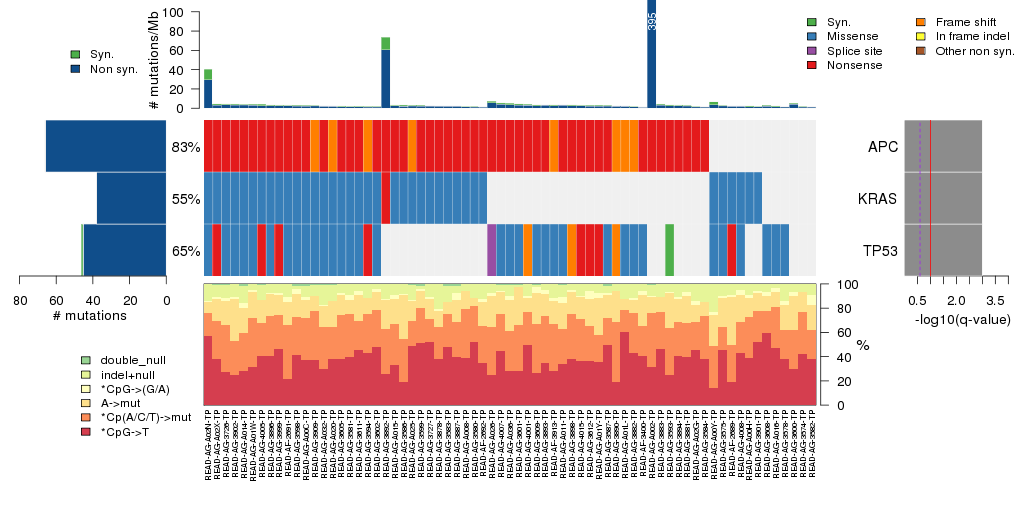
Figure 3. Get High-res Image The matrix in the center of the figure represents individual mutations in patient samples, color-coded by type of mutation, for the significantly mutated genes. The rate of synonymous and non-synonymous mutations is displayed at the top of the matrix. The barplot on the left of the matrix shows the number of mutations in each gene. The percentages represent the fraction of tumors with at least one mutation in the specified gene. The barplot to the right of the matrix displays the q-values for the most significantly mutated genes. The purple boxplots below the matrix (only displayed if required columns are present in the provided MAF) represent the distributions of allelic fractions observed in each sample. The plot at the bottom represents the base substitution distribution of individual samples, using the same categories that were used to calculate significance.
Column Descriptions:
-
N = number of sequenced bases in this gene across the individual set
-
n = number of (nonsilent) mutations in this gene across the individual set
-
npat = number of patients (individuals) with at least one nonsilent mutation
-
nsite = number of unique sites having a non-silent mutation
-
nsil = number of silent mutations in this gene across the individual set
-
n1 = number of nonsilent mutations of type: *CpG->T
-
n2 = number of nonsilent mutations of type: *Cp(A/C/T)->mut
-
n3 = number of nonsilent mutations of type: A->mut
-
n4 = number of nonsilent mutations of type: *CpG->(G/A)
-
n5 = number of nonsilent mutations of type: indel+null
-
n6 = number of nonsilent mutations of type: double_null
-
p_cons = p-value for enrichment of mutations at evolutionarily most-conserved sites in gene
-
p_joint = p-value for clustering + conservation
-
p = p-value (overall)
-
q = q-value, False Discovery Rate (Benjamini-Hochberg procedure)
Table 3. Get Full Table A Ranked List of Significantly Mutated Genes. Number of significant genes found: 3. Number of genes displayed: 35. Click on a gene name to display its stick figure depicting the distribution of mutations and mutation types across the chosen gene (this feature may not be available for all significant genes).
| rank | gene | description | N | n | npat | nsite | nsil | n1 | n2 | n3 | n4 | n5 | n6 | p_cons | p_joint | p_cv | p | q |
|---|---|---|---|---|---|---|---|---|---|---|---|---|---|---|---|---|---|---|
| 1 | APC | adenomatous polyposis coli | 576224 | 66 | 57 | 56 | 0 | 1 | 4 | 4 | 0 | 39 | 18 | 0.97 | 0 | 6.6e-15 | 0 | 0 |
| 2 | KRAS | v-Ki-ras2 Kirsten rat sarcoma viral oncogene homolog | 48604 | 38 | 38 | 8 | 0 | 0 | 36 | 1 | 0 | 1 | 0 | 0.0029 | 0 | 8.1e-11 | 0 | 0 |
| 3 | TP53 | tumor protein p53 | 79667 | 45 | 45 | 30 | 1 | 19 | 6 | 6 | 2 | 12 | 0 | 6e-07 | 0 | 5e-15 | 0 | 0 |
| 4 | NRAS | neuroblastoma RAS viral (v-ras) oncogene homolog | 40433 | 5 | 5 | 4 | 0 | 0 | 3 | 2 | 0 | 0 | 0 | 0.49 | 0.026 | 0.00034 | 0.00011 | 0.5 |
| 5 | FBXW7 | F-box and WD repeat domain containing 7 | 177744 | 12 | 9 | 10 | 0 | 6 | 2 | 2 | 0 | 2 | 0 | 0.08 | 0.079 | 0.00036 | 0.00032 | 1 |
| 6 | SMAD2 | SMAD family member 2 | 98964 | 5 | 5 | 5 | 0 | 0 | 3 | 1 | 0 | 1 | 0 | 0.37 | 0.02 | 0.0056 | 0.0011 | 1 |
| 7 | ERBB2 | v-erb-b2 erythroblastic leukemia viral oncogene homolog 2, neuro/glioblastoma derived oncogene homolog (avian) | 227547 | 4 | 4 | 2 | 1 | 4 | 0 | 0 | 0 | 0 | 0 | 0.031 | 0.00013 | 1 | 0.0013 | 1 |
| 8 | SMAD4 | SMAD family member 4 | 115264 | 8 | 8 | 6 | 0 | 2 | 3 | 3 | 0 | 0 | 0 | 0.2 | 0.26 | 0.00054 | 0.0014 | 1 |
| 9 | PPPDE1 | 38842 | 2 | 1 | 2 | 0 | 0 | 1 | 0 | 0 | 1 | 0 | 0.37 | 0.29 | 0.00051 | 0.0014 | 1 | |
| 10 | ZNF706 | zinc finger protein 706 | 15822 | 1 | 1 | 1 | 0 | 0 | 0 | 0 | 0 | 1 | 0 | NaN | NaN | 0.0018 | 0.0018 | 1 |
| 11 | PFDN1 | prefoldin subunit 1 | 22914 | 1 | 1 | 1 | 0 | 0 | 0 | 0 | 0 | 1 | 0 | NaN | NaN | 0.0021 | 0.0021 | 1 |
| 12 | ELF3 | E74-like factor 3 (ets domain transcription factor, epithelial-specific ) | 71547 | 3 | 3 | 3 | 0 | 0 | 0 | 0 | 0 | 3 | 0 | 0.35 | 0.083 | 0.0027 | 0.0021 | 1 |
| 13 | MARCKSL1 | MARCKS-like 1 | 28945 | 2 | 2 | 1 | 0 | 0 | 0 | 0 | 0 | 2 | 0 | 0.2 | 0.091 | 0.0034 | 0.0028 | 1 |
| 14 | TCF7L2 | transcription factor 7-like 2 (T-cell specific, HMG-box) | 119026 | 7 | 7 | 7 | 1 | 2 | 3 | 0 | 0 | 2 | 0 | 0.085 | 0.11 | 0.003 | 0.0031 | 1 |
| 15 | KIAA1804 | 162266 | 11 | 9 | 9 | 0 | 7 | 3 | 1 | 0 | 0 | 0 | 0.051 | 0.05 | 0.0094 | 0.0041 | 1 | |
| 16 | PALMD | palmdelphin | 114488 | 3 | 2 | 3 | 0 | 1 | 1 | 0 | 0 | 1 | 0 | 0.28 | 0.041 | 0.013 | 0.0047 | 1 |
| 17 | DYNLRB2 | dynein, light chain, roadblock-type 2 | 20963 | 1 | 1 | 1 | 0 | 0 | 0 | 0 | 0 | 1 | 0 | NaN | NaN | 0.005 | 0.005 | 1 |
| 18 | NIT2 | nitrilase family, member 2 | 58349 | 2 | 2 | 1 | 0 | 0 | 1 | 0 | 0 | 1 | 0 | 0.16 | 0.069 | 0.0087 | 0.0051 | 1 |
| 19 | GLRX | glutaredoxin (thioltransferase) | 22470 | 1 | 1 | 1 | 0 | 0 | 0 | 0 | 0 | 1 | 0 | NaN | NaN | 0.0056 | 0.0056 | 1 |
| 20 | TLL2 | tolloid-like 2 | 209091 | 3 | 3 | 2 | 2 | 2 | 0 | 1 | 0 | 0 | 0 | 0.22 | 0.001 | 0.82 | 0.0067 | 1 |
| 21 | BOLA3 | bolA homolog 3 (E. coli) | 24127 | 1 | 1 | 1 | 0 | 0 | 0 | 0 | 0 | 1 | 0 | NaN | NaN | 0.0077 | 0.0077 | 1 |
| 22 | KRTAP5-5 | keratin associated protein 5-5 | 34487 | 2 | 2 | 1 | 0 | 0 | 0 | 0 | 2 | 0 | 0 | 0.0062 | 0.013 | 0.078 | 0.0081 | 1 |
| 23 | HEBP2 | heme binding protein 2 | 34871 | 1 | 1 | 1 | 0 | 0 | 0 | 0 | 0 | 1 | 0 | NaN | NaN | 0.0082 | 0.0082 | 1 |
| 24 | PECAM1 | platelet/endothelial cell adhesion molecule (CD31 antigen) | 74138 | 1 | 1 | 1 | 0 | 0 | 1 | 0 | 0 | 0 | 0 | NaN | NaN | 0.0082 | 0.0082 | 1 |
| 25 | IQCK | IQ motif containing K | 56949 | 2 | 2 | 2 | 0 | 1 | 0 | 0 | 0 | 1 | 0 | 0.3 | 0.21 | 0.005 | 0.0084 | 1 |
| 26 | SIP1 | survival of motor neuron protein interacting protein 1 | 54290 | 2 | 2 | 2 | 0 | 0 | 0 | 0 | 0 | 2 | 0 | 0.24 | 0.74 | 0.0015 | 0.0087 | 1 |
| 27 | GLT8D2 | glycosyltransferase 8 domain containing 2 | 74554 | 2 | 2 | 2 | 1 | 0 | 1 | 0 | 0 | 1 | 0 | 0.64 | 0.23 | 0.0053 | 0.0093 | 1 |
| 28 | FAM123B | family with sequence similarity 123B | 190503 | 8 | 6 | 8 | 1 | 0 | 2 | 1 | 0 | 5 | 0 | 0.71 | 0.14 | 0.0085 | 0.0094 | 1 |
| 29 | C6orf125 | chromosome 6 open reading frame 125 | 25522 | 1 | 1 | 1 | 0 | 0 | 0 | 0 | 0 | 1 | 0 | NaN | NaN | 0.01 | 0.01 | 1 |
| 30 | MAPK10 | mitogen-activated protein kinase 10 | 99738 | 4 | 4 | 4 | 0 | 0 | 1 | 1 | 0 | 2 | 0 | 0.64 | 0.67 | 0.002 | 0.01 | 1 |
| 31 | C6orf162 | chromosome 6 open reading frame 162 | 20829 | 1 | 1 | 1 | 0 | 0 | 0 | 0 | 0 | 1 | 0 | NaN | NaN | 0.011 | 0.011 | 1 |
| 32 | HSPB3 | heat shock 27kDa protein 3 | 30908 | 1 | 1 | 1 | 0 | 0 | 0 | 0 | 0 | 1 | 0 | NaN | NaN | 0.011 | 0.011 | 1 |
| 33 | BAG5 | BCL2-associated athanogene 5 | 80849 | 4 | 2 | 3 | 0 | 2 | 0 | 0 | 0 | 2 | 0 | 0.14 | 0.049 | 0.034 | 0.012 | 1 |
| 34 | FAM49B | family with sequence similarity 49, member B | 70006 | 2 | 2 | 2 | 0 | 0 | 0 | 0 | 0 | 2 | 0 | 0.16 | 0.42 | 0.004 | 0.013 | 1 |
| 35 | TRIM69 | tripartite motif-containing 69 | 99933 | 2 | 2 | 2 | 1 | 0 | 1 | 0 | 0 | 1 | 0 | 0.0073 | 0.015 | 0.12 | 0.013 | 1 |
In this analysis, COSMIC is used as a filter to increase power by restricting the territory of each gene. Cosmic version: v48.
Table 4. Get Full Table Significantly mutated genes (COSMIC territory only). To access the database please go to: COSMIC. Number of significant genes found: 10. Number of genes displayed: 10
| rank | gene | description | n | cos | n_cos | N_cos | cos_ev | p | q |
|---|---|---|---|---|---|---|---|---|---|
| 1 | KRAS | v-Ki-ras2 Kirsten rat sarcoma viral oncogene homolog | 38 | 52 | 37 | 3588 | 363199 | 1.6e-13 | 7.2e-10 |
| 2 | TP53 | tumor protein p53 | 45 | 824 | 45 | 56856 | 17987 | 1.6e-12 | 2.4e-09 |
| 3 | APC | adenomatous polyposis coli | 66 | 839 | 50 | 57891 | 1048 | 1.6e-12 | 2.4e-09 |
| 4 | NRAS | neuroblastoma RAS viral (v-ras) oncogene homolog | 5 | 33 | 5 | 2277 | 5755 | 3.1e-11 | 3.5e-08 |
| 5 | FBXW7 | F-box and WD repeat domain containing 7 | 12 | 91 | 6 | 6279 | 329 | 4.5e-11 | 4.1e-08 |
| 6 | SMAD4 | SMAD family member 4 | 8 | 159 | 6 | 10971 | 39 | 1.2e-09 | 9.2e-07 |
| 7 | KRTAP5-5 | keratin associated protein 5-5 | 2 | 1 | 2 | 69 | 2 | 1.9e-07 | 0.00012 |
| 8 | ERBB2 | v-erb-b2 erythroblastic leukemia viral oncogene homolog 2, neuro/glioblastoma derived oncogene homolog (avian) | 4 | 42 | 3 | 2898 | 6 | 3e-06 | 0.0017 |
| 9 | PIK3CA | phosphoinositide-3-kinase, catalytic, alpha polypeptide | 7 | 220 | 4 | 15180 | 1382 | 0.000013 | 0.0067 |
| 10 | LRP1B | low density lipoprotein-related protein 1B (deleted in tumors) | 20 | 18 | 2 | 1242 | 2 | 0.000063 | 0.028 |
Note:
n - number of (nonsilent) mutations in this gene across the individual set.
cos = number of unique mutated sites in this gene in COSMIC
n_cos = overlap between n and cos.
N_cos = number of individuals times cos.
cos_ev = total evidence: number of reports in COSMIC for mutations seen in this gene.
p = p-value for seeing the observed amount of overlap in this gene)
q = q-value, False Discovery Rate (Benjamini-Hochberg procedure)
Table 5. Get Full Table A Ranked List of Significantly Mutated Genesets. (Source: MSigDB GSEA Cannonical Pathway Set).Number of significant genesets found: 111. Number of genesets displayed: 10
| rank | geneset | description | genes | N_genes | mut_tally | N | n | npat | nsite | nsil | n1 | n2 | n3 | n4 | n5 | n6 | p | q |
|---|---|---|---|---|---|---|---|---|---|---|---|---|---|---|---|---|---|---|
| 1 | WNT_SIGNALING | Wnt signaling genes | APC, ARHA, AXIN1, C2orf31, CCND1, CCND2, CCND3, CSNK1E, CSNK1E, LOC400927, CTNNB1, DIPA, DVL1, DVL2, DVL3, FBXW2, FOSL1, FRAT1, FZD1, FZD10, FZD2, FZD3, FZD5, FZD6, FZD7, FZD8, FZD9, GSK3B, JUN, LDLR, MAPK10, MAPK9, MYC, PAFAH1B1, PLAU, PPP2R5C, PPP2R5E, PRKCA, PRKCB1, PRKCD, PRKCE, PRKCG, PRKCH, PRKCI, PRKCM, PRKCQ, PRKCZ, PRKD1, RAC1, RHOA, SFRP4, TCF7, WNT1, WNT10A, WNT10B, WNT11, WNT16, WNT2, WNT2B, WNT3, WNT4, WNT5A, WNT5B, WNT6, WNT7A, WNT7B | 57 | APC(66), AXIN1(1), CTNNB1(4), DVL2(1), DVL3(2), FBXW2(1), FZD1(1), FZD10(2), FZD3(3), FZD6(3), GSK3B(1), LDLR(1), MAPK10(4), MAPK9(2), PLAU(1), PPP2R5C(1), PRKCA(2), PRKCE(2), PRKCG(2), PRKCH(1), PRKCQ(1), PRKD1(5), RHOA(1), SFRP4(1), TCF7(3), WNT10B(1), WNT2(1), WNT2B(2), WNT6(1) | 5514820 | 117 | 58 | 107 | 13 | 15 | 27 | 8 | 0 | 49 | 18 | <1.00e-15 | <8.25e-14 |
| 2 | TELPATHWAY | Telomerase is a ribonucleotide protein that adds telomeric repeats to the 3' ends of chromosomes. | AKT1, BCL2, EGFR, G22P1, HSPCA, IGF1R, KRAS2, MYC, POLR2A, PPP2CA, PRKCA, RB1, TEP1, TERF1, TERT, TNKS, TP53, XRCC5 | 15 | EGFR(1), IGF1R(1), PRKCA(2), RB1(3), TERF1(1), TP53(45), XRCC5(2) | 2767314 | 55 | 48 | 40 | 6 | 22 | 9 | 9 | 2 | 13 | 0 | <1.00e-15 | <8.25e-14 |
| 3 | HSA04810_REGULATION_OF_ACTIN_CYTOSKELETON | Genes involved in regulation of actin cytoskeleton | ABI2, ACTN1, ACTN2, ACTN3, ACTN4, APC, APC2, ARAF, ARHGEF1, ARHGEF12, ARHGEF4, ARHGEF6, ARHGEF7, ARPC1A, ARPC1B, ARPC2, ARPC3, ARPC4, ARPC5, ARPC5L, BAIAP2, BCAR1, BDKRB1, BDKRB2, BRAF, C3orf10, CD14, CDC42, CFL1, CFL2, CHRM1, CHRM2, CHRM3, CHRM4, CHRM5, CRK, CRKL, CSK, CYFIP1, CYFIP2, DIAPH1, DIAPH2, DIAPH3, DOCK1, EGF, EGFR, EZR, F2, F2R, FGD1, FGD3, FGF1, FGF10, FGF11, FGF12, FGF13, FGF14, FGF16, FGF17, FGF18, FGF19, FGF2, FGF20, FGF21, FGF22, FGF23, FGF3, FGF4, FGF5, FGF6, FGF7, FGF8, FGF9, FGFR1, FGFR2, FGFR3, FGFR4, FN1, GIT1, GNA12, GNA13, GNG12, GRLF1, GSN, HRAS, INS, IQGAP1, IQGAP2, IQGAP3, ITGA1, ITGA10, ITGA11, ITGA2, ITGA2B, ITGA3, ITGA4, ITGA5, ITGA6, ITGA7, ITGA8, ITGA9, ITGAD, ITGAE, ITGAL, ITGAM, ITGAV, ITGAX, ITGB1, ITGB2, ITGB3, ITGB4, ITGB5, ITGB6, ITGB7, ITGB8, KRAS, LIMK1, LIMK2, LOC200025, LOC645126, LOC653888, MAP2K1, MAP2K2, MAPK1, MAPK3, MLCK, MOS, MRAS, MRCL3, MRLC2, MSN, MYH10, MYH14, MYH9, MYL2, MYL5, MYL7, MYL8P, MYL9, MYLC2PL, MYLK, MYLK2, MYLPF, NCKAP1, NCKAP1L, NRAS, PAK1, PAK2, PAK3, PAK4, PAK6, PAK7, PDGFA, PDGFB, PDGFRA, PDGFRB, PFN1, PFN2, PFN3, PFN4, PIK3CA, PIK3CB, PIK3CD, PIK3CG, PIK3R1, PIK3R2, PIK3R3, PIK3R5, PIP4K2A, PIP4K2B, PIP4K2C, PIP5K1A, PIP5K1B, PIP5K1C, PIP5K3, PPP1CA, PPP1CB, PPP1CC, PPP1R12A, PPP1R12B, PTK2, PXN, RAC1, RAC2, RAC3, RAF1, RDX, RHOA, ROCK1, ROCK2, RRAS, RRAS2, SCIN, SLC9A1, SOS1, SOS2, SSH1, SSH2, SSH3, TIAM1, TIAM2, TMSB4X, TMSB4Y, TMSL3, VAV1, VAV2, VAV3, VCL, WAS, WASF1, WASF2, WASL | 203 | ABI2(1), ACTN1(2), ACTN2(1), ACTN3(1), ACTN4(1), APC(66), ARHGEF1(1), ARHGEF12(2), ARHGEF4(1), ARHGEF6(3), ARPC2(1), ARPC5L(1), BAIAP2(1), BDKRB2(1), BRAF(2), CDC42(1), CHRM2(3), CHRM4(1), CHRM5(1), CSK(2), CYFIP1(1), CYFIP2(1), DIAPH2(3), DIAPH3(2), DOCK1(2), EGFR(1), F2(1), FGD1(2), FGD3(1), FGF11(1), FGF12(1), FGF13(1), FGF19(1), FGF20(1), FGF5(2), FGFR1(1), FGFR2(5), FN1(4), GIT1(1), GRLF1(5), IQGAP1(3), IQGAP2(3), ITGA10(4), ITGA11(2), ITGA2(1), ITGA2B(2), ITGA4(5), ITGA6(1), ITGA8(3), ITGA9(2), ITGAD(1), ITGAE(2), ITGAL(3), ITGAM(3), ITGAV(4), ITGAX(2), ITGB2(1), ITGB3(2), ITGB4(1), ITGB5(1), ITGB8(1), KRAS(38), LIMK1(1), LIMK2(1), MAP2K1(1), MAP2K2(1), MAPK3(1), MOS(1), MSN(3), MYH10(2), MYH14(3), MYH9(3), MYL9(2), MYLK(3), MYLK2(1), NCKAP1(1), NCKAP1L(4), NRAS(5), PAK1(1), PAK2(1), PAK3(2), PAK7(3), PDGFRA(4), PDGFRB(1), PIK3CA(7), PIK3CD(1), PIK3CG(2), PIK3R1(5), PIK3R3(4), PIP5K1B(1), PIP5K1C(1), PPP1CB(1), PPP1CC(1), PPP1R12A(1), PPP1R12B(4), RAF1(2), RDX(1), RHOA(1), ROCK1(7), ROCK2(4), RRAS2(1), SCIN(1), SLC9A1(2), SOS1(2), SOS2(2), SSH1(2), SSH3(1), TIAM1(5), TIAM2(2), VAV1(2), VAV2(2), VAV3(2), VCL(1), WASF1(2), WASL(2) | 26346557 | 332 | 66 | 291 | 70 | 74 | 124 | 38 | 4 | 72 | 20 | 1.11e-15 | 8.25e-14 |
| 4 | ALKPATHWAY | Activin receptor-like kinase 3 (ALK3) is required during gestation for cardiac muscle development. | ACVR1, APC, ATF2, AXIN1, BMP10, BMP2, BMP4, BMP5, BMP7, BMPR1A, BMPR2, CHRD, CTNNB1, DVL1, FZD1, GATA4, GSK3B, MADH1, MADH4, MADH5, MADH6, MAP3K7, MEF2C, MYL2, NKX2-5, NOG, NPPA, NPPB, RFC1, TCF1, TGFB1, TGFB2, TGFB3, TGFBR1, TGFBR2, TGFBR3, WNT1 | 31 | ACVR1(1), APC(66), ATF2(1), AXIN1(1), BMP10(1), BMP2(1), BMP4(1), BMP5(1), BMP7(1), BMPR2(3), CTNNB1(4), FZD1(1), GSK3B(1), MAP3K7(2), MEF2C(2), NPPB(1), RFC1(4), TGFB2(4), TGFBR1(3), TGFBR3(3) | 3414527 | 102 | 59 | 92 | 3 | 13 | 19 | 9 | 0 | 43 | 18 | 1.11e-15 | 8.25e-14 |
| 5 | HSA04664_FC_EPSILON_RI_SIGNALING_PATHWAY | Genes involved in Fc epsilon RI signaling pathway | AKT1, AKT2, AKT3, BTK, CSF2, FCER1A, FCER1G, FYN, GAB2, GRB2, HRAS, IL13, IL3, IL4, IL5, INPP5D, KRAS, LAT, LCP2, LYN, MAP2K1, MAP2K2, MAP2K3, MAP2K4, MAP2K6, MAP2K7, MAPK1, MAPK10, MAPK11, MAPK12, MAPK13, MAPK14, MAPK3, MAPK8, MAPK9, MS4A2, NRAS, PDK1, PIK3CA, PIK3CB, PIK3CD, PIK3CG, PIK3R1, PIK3R2, PIK3R3, PIK3R5, PLA2G10, PLA2G12A, PLA2G12B, PLA2G1B, PLA2G2A, PLA2G2D, PLA2G2E, PLA2G2F, PLA2G3, PLA2G4A, PLA2G5, PLA2G6, PLCG1, PLCG2, PRKCA, PRKCB1, PRKCD, PRKCE, RAC1, RAC2, RAC3, RAF1, SOS1, SOS2, SYK, TNF, VAV1, VAV2, VAV3 | 74 | AKT2(1), AKT3(1), BTK(1), FCER1A(1), FYN(1), GRB2(1), INPP5D(2), KRAS(38), LAT(1), LCP2(1), MAP2K1(1), MAP2K2(1), MAP2K3(4), MAP2K4(2), MAP2K6(1), MAPK10(4), MAPK13(1), MAPK3(1), MAPK8(5), MAPK9(2), MS4A2(2), NRAS(5), PDK1(2), PIK3CA(7), PIK3CD(1), PIK3CG(2), PIK3R1(5), PIK3R3(4), PLA2G4A(3), PLA2G6(2), PLCG2(4), PRKCA(2), PRKCE(2), RAF1(2), SOS1(2), SOS2(2), SYK(3), VAV1(2), VAV2(2), VAV3(2) | 6895491 | 126 | 49 | 95 | 19 | 28 | 63 | 16 | 2 | 15 | 2 | 1.11e-15 | 8.25e-14 |
| 6 | ST_WNT_BETA_CATENIN_PATHWAY | Beta-catenin is degraded in the absence of Wnt signaling; when extracellular Wnt binds Frizzled receptors, beta-catenin accumulates in the nucleus and may promote cell survival. | AKT1, AKT2, AKT3, ANKRD6, APC, AXIN1, AXIN2, C22orf2, CER1, CSNK1A1, CTNNB1, DACT1, DKK1, DKK2, DKK3, DKK4, DVL1, FRAT1, FSTL1, GSK3A, GSK3B, IDAX, LAMR1, LRP1, MVP, NKD1, NKD2, PIN1, PSEN1, PTPRA, SENP2, SFRP1, TSHB, WIF1 | 29 | AKT2(1), AKT3(1), APC(66), AXIN1(1), AXIN2(2), CTNNB1(4), DACT1(1), DKK1(2), DKK2(1), DKK4(3), FSTL1(1), GSK3B(1), LRP1(3), SENP2(1), SFRP1(1), TSHB(1) | 3759900 | 90 | 59 | 80 | 4 | 8 | 14 | 11 | 0 | 39 | 18 | 1.33e-15 | 8.25e-14 |
| 7 | HSA04370_VEGF_SIGNALING_PATHWAY | Genes involved in VEGF signaling pathway | AKT1, AKT2, AKT3, BAD, CASP9, CDC42, CHP, HRAS, KDR, KRAS, MAP2K1, MAP2K2, MAPK1, MAPK11, MAPK12, MAPK13, MAPK14, MAPK3, MAPKAPK2, MAPKAPK3, NFAT5, NFATC1, NFATC2, NFATC3, NFATC4, NOS3, NRAS, PIK3CA, PIK3CB, PIK3CD, PIK3CG, PIK3R1, PIK3R2, PIK3R3, PIK3R5, PLA2G10, PLA2G12A, PLA2G12B, PLA2G1B, PLA2G2A, PLA2G2D, PLA2G2E, PLA2G2F, PLA2G3, PLA2G4A, PLA2G5, PLA2G6, PLCG1, PLCG2, PPP3CA, PPP3CB, PPP3CC, PPP3R1, PPP3R2, PRKCA, PRKCB1, PRKCG, PTGS2, PTK2, PXN, RAC1, RAC2, RAC3, RAF1, SH2D2A, SHC2, SPHK1, SPHK2, SRC, VEGFA | 69 | AKT2(1), AKT3(1), CDC42(1), KDR(2), KRAS(38), MAP2K1(1), MAP2K2(1), MAPK13(1), MAPK3(1), NFATC1(1), NFATC2(2), NFATC3(1), NFATC4(1), NRAS(5), PIK3CA(7), PIK3CD(1), PIK3CG(2), PIK3R1(5), PIK3R3(4), PLA2G4A(3), PLA2G6(2), PLCG2(4), PPP3CA(2), PPP3CB(1), PPP3CC(1), PRKCA(2), PRKCG(2), PTGS2(1), RAF1(2), SH2D2A(1), SHC2(1), SPHK1(1) | 6915053 | 99 | 50 | 68 | 19 | 27 | 50 | 10 | 0 | 10 | 2 | 1.44e-15 | 8.25e-14 |
| 8 | TIDPATHWAY | On ligand binding, interferon gamma receptors stimulate JAK2 kinase to phosphorylate STAT transcription factors, which promote expression of interferon responsive genes. | DNAJA3, HSPA1A, IFNG, IFNGR1, IFNGR2, IKBKB, JAK2, LIN7A, NFKB1, NFKBIA, RB1, RELA, TIP-1, TNF, TNFRSF1A, TNFRSF1B, TP53, USH1C, WT1 | 17 | DNAJA3(1), IFNGR1(1), IFNGR2(1), IKBKB(2), JAK2(3), NFKB1(3), RB1(3), TP53(45), USH1C(3), WT1(2) | 1809425 | 64 | 48 | 49 | 6 | 25 | 14 | 7 | 2 | 15 | 1 | 1.55e-15 | 8.25e-14 |
| 9 | TGFBPATHWAY | The TGF-beta receptor responds to ligand binding by activating the SMAD family of transcriptional regulations, commonly blocking cell growth. | APC, CDH1, CREBBP, EP300, MADH2, MADH3, MADH4, MADH7, MADHIP, MAP2K1, MAP3K7, MAP3K7IP1, MAPK3, SKIL, TGFB1, TGFB2, TGFB3, TGFBR1, TGFBR2 | 13 | APC(66), CDH1(1), CREBBP(4), EP300(2), MAP2K1(1), MAP3K7(2), MAPK3(1), SKIL(1), TGFB2(4), TGFBR1(3) | 2554178 | 85 | 57 | 75 | 4 | 5 | 10 | 8 | 0 | 44 | 18 | 1.78e-15 | 8.25e-14 |
| 10 | ST_FAS_SIGNALING_PATHWAY | The Fas receptor induces apoptosis and NF-kB activation when bound to Fas ligand. | ADPRT, ALG2, BAK1, BAX, BFAR, BIRC4, BTK, CAD, CASP10, CASP3, CASP8, CASP8AP2, CD7, CDK2AP1, CSNK1A1, DAXX, DEDD, DEDD2, DFFA, DIABLO, EGFR, EPHB2, FADD, FAF1, FAIM2, FREQ, HRB, HSPB1, IL1A, IL8, MAP2K4, MAP2K7, MAP3K1, MAP3K5, MAPK1, MAPK10, MAPK8, MAPK8IP1, MAPK8IP2, MAPK8IP3, MAPK9, MCP, MET, NFAT5, NFKB1, NFKB2, NFKBIA, NFKBIB, NFKBIE, NFKBIL1, NFKBIL2, NR0B2, PFN1, PFN2, PTPN13, RALBP1, RIPK1, ROCK1, SMPD1, TNFRSF6, TNFRSF6B, TP53, TPX2, TRAF2, TUFM, VIL2 | 59 | BTK(1), CAD(1), CASP3(1), CASP8AP2(6), DAXX(1), DEDD(1), DFFA(1), EGFR(1), EPHB2(1), IL8(1), MAP2K4(2), MAP3K1(2), MAP3K5(1), MAPK10(4), MAPK8(5), MAPK8IP3(1), MAPK9(2), MET(1), NFKB1(3), NFKB2(2), PTPN13(9), RALBP1(2), ROCK1(7), TP53(45), TPX2(1) | 6826271 | 102 | 50 | 87 | 17 | 34 | 28 | 17 | 3 | 20 | 0 | 2.00e-15 | 8.25e-14 |
In brief, we tabulate the number of mutations and the number of covered bases for each gene. The counts are broken down by mutation context category: four context categories that are discovered by MutSig, and one for indel and 'null' mutations, which include indels, nonsense mutations, splice-site mutations, and non-stop (read-through) mutations. For each gene, we calculate the probability of seeing the observed constellation of mutations, i.e. the product P1 x P2 x ... x Pm, or a more extreme one, given the background mutation rates calculated across the dataset. [1]
This is an experimental feature. The full results of the analysis summarized in this report can be downloaded from the TCGA Data Coordination Center.