This pipeline computes the correlation between significant arm-level copy number variations (cnvs) and selected clinical features.
Testing the association between copy number variation 47 arm-level results and 3 clinical features across 22 patients, one significant finding detected with Q value < 0.25.
-
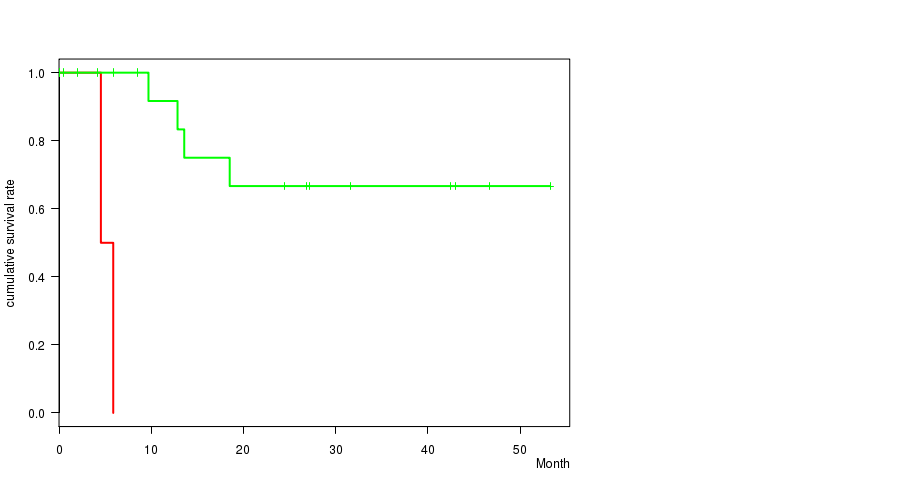
15q loss cnv correlated to 'Time to Death'.
Table 1. Get Full Table Overview of the association between significant copy number variation of 47 arm-level results and 3 clinical features. Shown in the table are P values (Q values). Thresholded by Q value < 0.25, one significant finding detected.
|
Clinical Features |
Time to Death |
AGE | GENDER | ||
| nCNV (%) | nWild-Type | logrank test | t-test | Fisher's exact test | |
| 15q loss | 0 (0%) | 19 |
1.27e-05 (0.00179) |
0.522 (1.00) |
0.571 (1.00) |
| 1p gain | 0 (0%) | 19 |
0.395 (1.00) |
0.483 (1.00) |
0.0779 (1.00) |
| 4p gain | 0 (0%) | 19 |
0.335 (1.00) |
0.955 (1.00) |
0.221 (1.00) |
| 5p gain | 0 (0%) | 17 |
0.811 (1.00) |
0.0636 (1.00) |
0.624 (1.00) |
| 5q gain | 0 (0%) | 18 |
0.0456 (1.00) |
0.124 (1.00) |
1 (1.00) |
| 6p gain | 0 (0%) | 17 |
0.428 (1.00) |
0.427 (1.00) |
1 (1.00) |
| 6q gain | 0 (0%) | 16 |
0.254 (1.00) |
0.664 (1.00) |
0.646 (1.00) |
| 7p gain | 0 (0%) | 15 |
0.563 (1.00) |
0.00274 (0.384) |
0.652 (1.00) |
| 7q gain | 0 (0%) | 15 |
0.563 (1.00) |
0.00274 (0.384) |
0.652 (1.00) |
| 8p gain | 0 (0%) | 18 |
0.00918 (1.00) |
0.573 (1.00) |
1 (1.00) |
| 8q gain | 0 (0%) | 18 |
0.0114 (1.00) |
0.929 (1.00) |
1 (1.00) |
| 9q gain | 0 (0%) | 19 |
0.452 (1.00) |
0.99 (1.00) |
1 (1.00) |
| 15q gain | 0 (0%) | 18 |
0.959 (1.00) |
0.968 (1.00) |
0.293 (1.00) |
| 16p gain | 0 (0%) | 19 |
0.327 (1.00) |
0.532 (1.00) |
0.571 (1.00) |
| 17p gain | 0 (0%) | 16 |
0.558 (1.00) |
0.164 (1.00) |
0.162 (1.00) |
| 17q gain | 0 (0%) | 19 |
0.452 (1.00) |
0.303 (1.00) |
1 (1.00) |
| 18p gain | 0 (0%) | 18 |
0.926 (1.00) |
0.968 (1.00) |
0.293 (1.00) |
| 18q gain | 0 (0%) | 17 |
0.677 (1.00) |
0.702 (1.00) |
0.135 (1.00) |
| 19p gain | 0 (0%) | 16 |
0.608 (1.00) |
0.37 (1.00) |
1 (1.00) |
| 19q gain | 0 (0%) | 18 |
0.743 (1.00) |
0.867 (1.00) |
0.594 (1.00) |
| 20p gain | 0 (0%) | 15 |
0.5 (1.00) |
0.227 (1.00) |
0.652 (1.00) |
| 20q gain | 0 (0%) | 13 |
0.0438 (1.00) |
0.0666 (1.00) |
1 (1.00) |
| 21q gain | 0 (0%) | 17 |
0.275 (1.00) |
0.724 (1.00) |
0.0396 (1.00) |
| 22q gain | 0 (0%) | 19 |
0.828 (1.00) |
0.651 (1.00) |
0.571 (1.00) |
| 1p loss | 0 (0%) | 19 |
0.478 (1.00) |
0.0998 (1.00) |
0.571 (1.00) |
| 1q loss | 0 (0%) | 18 |
0.444 (1.00) |
0.767 (1.00) |
0.594 (1.00) |
| 2p loss | 0 (0%) | 19 |
0.585 (1.00) |
0.437 (1.00) |
1 (1.00) |
| 2q loss | 0 (0%) | 19 |
0.585 (1.00) |
0.437 (1.00) |
1 (1.00) |
| 3p loss | 0 (0%) | 18 |
0.335 (1.00) |
0.972 (1.00) |
1 (1.00) |
| 3q loss | 0 (0%) | 17 |
0.335 (1.00) |
0.904 (1.00) |
1 (1.00) |
| 4p loss | 0 (0%) | 19 |
0.118 (1.00) |
0.996 (1.00) |
0.571 (1.00) |
| 4q loss | 0 (0%) | 19 |
0.118 (1.00) |
0.996 (1.00) |
0.571 (1.00) |
| 8p loss | 0 (0%) | 16 |
0.263 (1.00) |
0.691 (1.00) |
1 (1.00) |
| 9p loss | 0 (0%) | 18 |
0.0114 (1.00) |
0.521 (1.00) |
0.293 (1.00) |
| 10p loss | 0 (0%) | 13 |
0.477 (1.00) |
0.696 (1.00) |
0.0274 (1.00) |
| 10q loss | 0 (0%) | 13 |
0.683 (1.00) |
0.644 (1.00) |
0.0274 (1.00) |
| 11p loss | 0 (0%) | 14 |
0.326 (1.00) |
0.54 (1.00) |
0.675 (1.00) |
| 11q loss | 0 (0%) | 16 |
0.326 (1.00) |
0.298 (1.00) |
0.162 (1.00) |
| 13q loss | 0 (0%) | 13 |
0.358 (1.00) |
0.5 (1.00) |
0.666 (1.00) |
| 14q loss | 0 (0%) | 17 |
0.263 (1.00) |
0.772 (1.00) |
1 (1.00) |
| 16p loss | 0 (0%) | 18 |
0.975 (1.00) |
0.66 (1.00) |
1 (1.00) |
| 16q loss | 0 (0%) | 14 |
0.0926 (1.00) |
0.497 (1.00) |
0.675 (1.00) |
| 18p loss | 0 (0%) | 18 |
0.0534 (1.00) |
0.829 (1.00) |
0.594 (1.00) |
| 18q loss | 0 (0%) | 17 |
0.0534 (1.00) |
0.414 (1.00) |
1 (1.00) |
| 19q loss | 0 (0%) | 19 |
0.11 (1.00) |
0.00993 (1.00) |
1 (1.00) |
| 22q loss | 0 (0%) | 18 |
0.78 (1.00) |
0.583 (1.00) |
1 (1.00) |
| Xq loss | 0 (0%) | 18 |
0.892 (1.00) |
0.456 (1.00) |
0.594 (1.00) |
P value = 1.27e-05 (logrank test), Q value = 0.0018
Table S1. Gene #40: '15q loss' versus Clinical Feature #1: 'Time to Death'
| nPatients | nDeath | Duration Range (Median), Month | |
|---|---|---|---|
| ALL | 22 | 6 | 0.1 - 53.3 (11.3) |
| 15Q LOSS CNV | 3 | 2 | 0.1 - 5.9 (4.5) |
| 15Q LOSS WILD-TYPE | 19 | 4 | 0.1 - 53.3 (13.6) |
Figure S1. Get High-res Image Gene #40: '15q loss' versus Clinical Feature #1: 'Time to Death'
-
Mutation data file = broad_values_by_arm.mutsig.cluster.txt
-
Clinical data file = SARC-TP.clin.merged.picked.txt
-
Number of patients = 22
-
Number of significantly arm-level cnvs = 47
-
Number of selected clinical features = 3
-
Exclude genes that fewer than K tumors have mutations, K = 3
For survival clinical features, the Kaplan-Meier survival curves of tumors with and without gene mutations were plotted and the statistical significance P values were estimated by logrank test (Bland and Altman 2004) using the 'survdiff' function in R
For continuous numerical clinical features, two-tailed Student's t test with unequal variance (Lehmann and Romano 2005) was applied to compare the clinical values between tumors with and without gene mutations using 't.test' function in R
For binary or multi-class clinical features (nominal or ordinal), two-tailed Fisher's exact tests (Fisher 1922) were used to estimate the P values using the 'fisher.test' function in R
For multiple hypothesis correction, Q value is the False Discovery Rate (FDR) analogue of the P value (Benjamini and Hochberg 1995), defined as the minimum FDR at which the test may be called significant. We used the 'Benjamini and Hochberg' method of 'p.adjust' function in R to convert P values into Q values.
This is an experimental feature. The full results of the analysis summarized in this report can be downloaded from the TCGA Data Coordination Center.