This pipeline computes the correlation between significant arm-level copy number variations (cnvs) and selected clinical features.
Testing the association between copy number variation 77 arm-level results and 8 clinical features across 180 patients, 2 significant findings detected with Q value < 0.25.
-
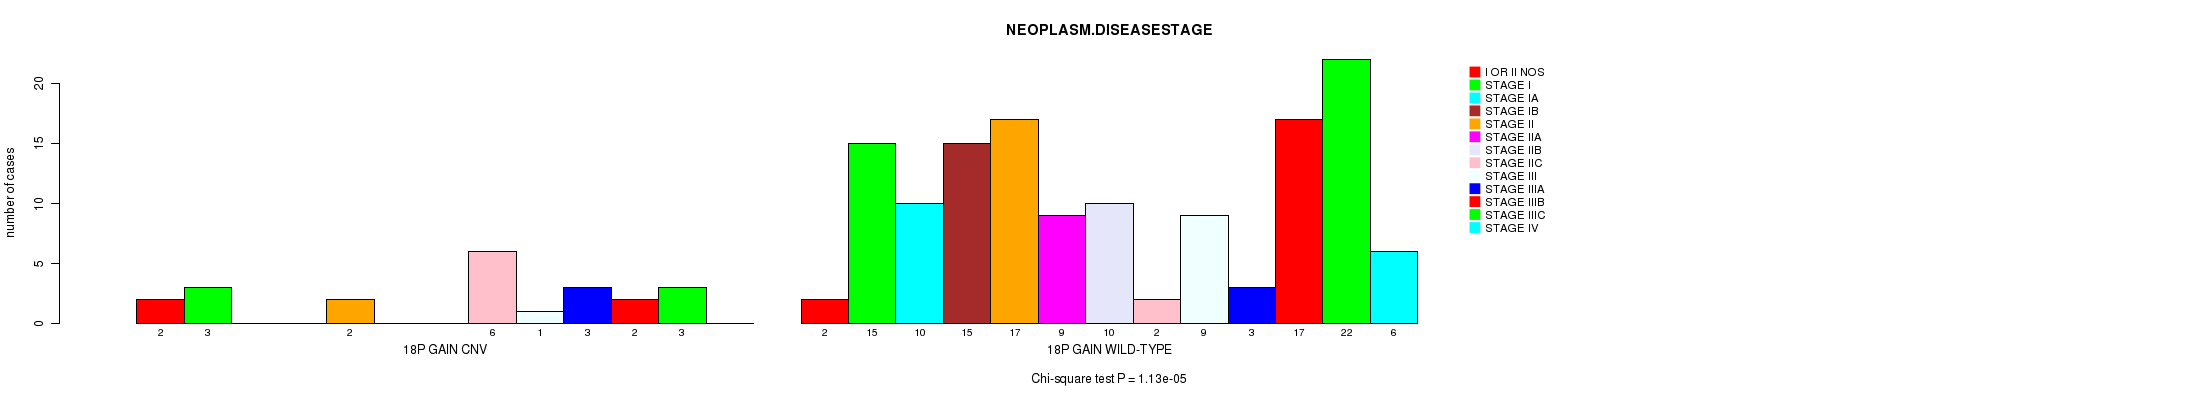
18p gain cnv correlated to 'NEOPLASM.DISEASESTAGE'.
-
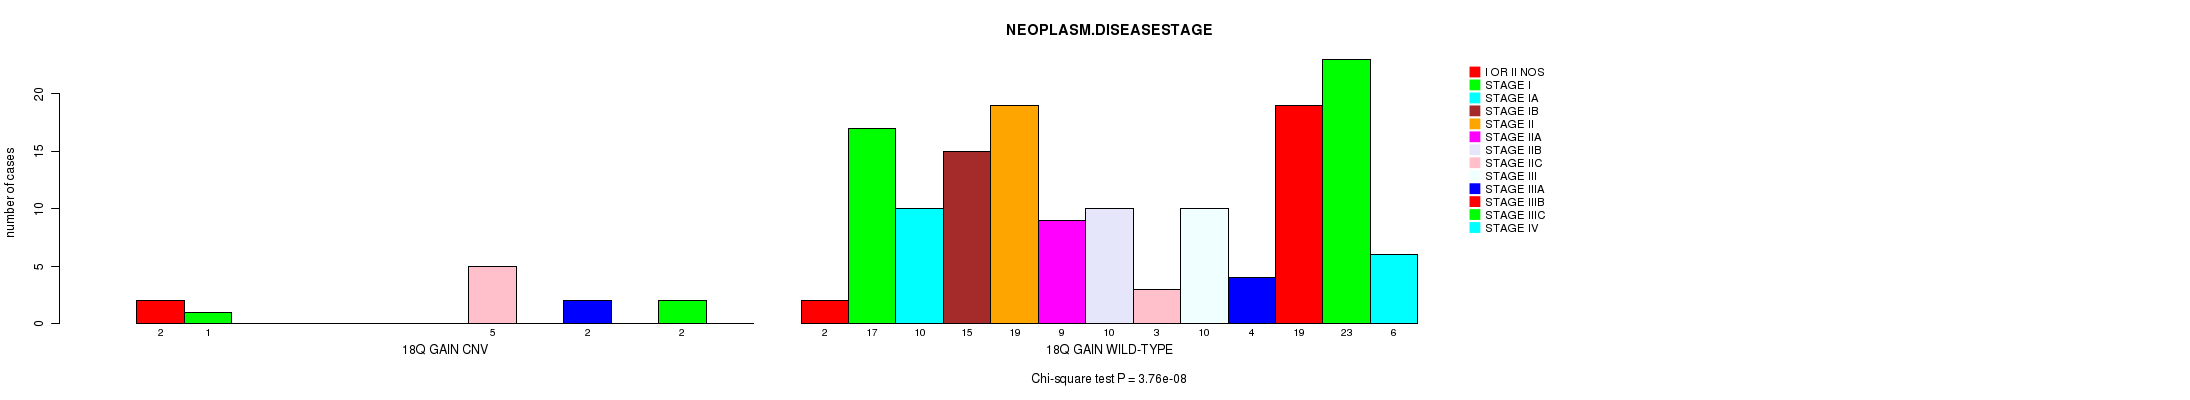
18q gain cnv correlated to 'NEOPLASM.DISEASESTAGE'.
Table 1. Get Full Table Overview of the association between significant copy number variation of 77 arm-level results and 8 clinical features. Shown in the table are P values (Q values). Thresholded by Q value < 0.25, 2 significant findings detected.
|
Clinical Features |
Time to Death |
AGE |
PRIMARY SITE OF DISEASE |
GENDER |
DISTANT METASTASIS |
LYMPH NODE METASTASIS |
TUMOR STAGECODE |
NEOPLASM DISEASESTAGE |
||
| nCNV (%) | nWild-Type | logrank test | t-test | Fisher's exact test | Fisher's exact test | Chi-square test | Chi-square test | t-test | Chi-square test | |
| 18p gain | 0 (0%) | 158 |
0.616 (1.00) |
0.0715 (1.00) |
0.823 (1.00) |
0.351 (1.00) |
0.497 (1.00) |
0.522 (1.00) |
1.13e-05 (0.00605) |
|
| 18q gain | 0 (0%) | 168 |
0.346 (1.00) |
0.496 (1.00) |
0.2 (1.00) |
0.542 (1.00) |
0.963 (1.00) |
0.578 (1.00) |
3.76e-08 (2.02e-05) |
|
| 1p gain | 0 (0%) | 158 |
0.159 (1.00) |
0.148 (1.00) |
0.398 (1.00) |
0.495 (1.00) |
0.874 (1.00) |
0.413 (1.00) |
0.0129 (1.00) |
|
| 1q gain | 0 (0%) | 118 |
0.613 (1.00) |
0.948 (1.00) |
0.161 (1.00) |
0.872 (1.00) |
0.636 (1.00) |
0.326 (1.00) |
0.6 (1.00) |
|
| 2p gain | 0 (0%) | 162 |
0.41 (1.00) |
0.035 (1.00) |
0.662 (1.00) |
0.201 (1.00) |
0.915 (1.00) |
0.133 (1.00) |
0.856 (1.00) |
|
| 2q gain | 0 (0%) | 163 |
0.655 (1.00) |
0.0626 (1.00) |
0.372 (1.00) |
0.447 (1.00) |
0.924 (1.00) |
0.23 (1.00) |
0.833 (1.00) |
|
| 3p gain | 0 (0%) | 162 |
0.788 (1.00) |
0.692 (1.00) |
0.00218 (1.00) |
0.32 (1.00) |
0.915 (1.00) |
0.554 (1.00) |
0.698 (1.00) |
|
| 3q gain | 0 (0%) | 157 |
0.414 (1.00) |
0.459 (1.00) |
0.00541 (1.00) |
0.367 (1.00) |
0.862 (1.00) |
0.364 (1.00) |
0.767 (1.00) |
|
| 4p gain | 0 (0%) | 162 |
0.511 (1.00) |
0.0237 (1.00) |
0.662 (1.00) |
0.32 (1.00) |
0.924 (1.00) |
0.488 (1.00) |
0.0383 (1.00) |
|
| 4q gain | 0 (0%) | 166 |
0.605 (1.00) |
0.0228 (1.00) |
0.855 (1.00) |
0.78 (1.00) |
0.963 (1.00) |
0.678 (1.00) |
0.0894 (1.00) |
|
| 5p gain | 0 (0%) | 160 |
0.0441 (1.00) |
0.161 (1.00) |
0.224 (1.00) |
0.629 (1.00) |
0.171 (1.00) |
0.568 (1.00) |
0.52 (1.00) |
|
| 5q gain | 0 (0%) | 171 |
0.381 (1.00) |
0.0688 (1.00) |
0.309 (1.00) |
0.737 (1.00) |
0.98 (1.00) |
0.54 (1.00) |
0.389 (1.00) |
|
| 6p gain | 0 (0%) | 120 |
0.968 (1.00) |
0.336 (1.00) |
0.0485 (1.00) |
0.146 (1.00) |
0.648 (1.00) |
0.615 (1.00) |
0.431 (1.00) |
|
| 6q gain | 0 (0%) | 165 |
0.472 (1.00) |
0.94 (1.00) |
0.0665 (1.00) |
0.585 (1.00) |
0.052 (1.00) |
0.863 (1.00) |
0.82 (1.00) |
|
| 7p gain | 0 (0%) | 104 |
0.698 (1.00) |
0.72 (1.00) |
0.24 (1.00) |
0.444 (1.00) |
0.0409 (1.00) |
0.211 (1.00) |
0.183 (1.00) |
|
| 7q gain | 0 (0%) | 103 |
0.954 (1.00) |
0.645 (1.00) |
0.325 (1.00) |
1 (1.00) |
0.0505 (1.00) |
0.252 (1.00) |
0.0328 (1.00) |
|
| 8p gain | 0 (0%) | 140 |
0.873 (1.00) |
0.794 (1.00) |
0.328 (1.00) |
0.366 (1.00) |
0.0651 (1.00) |
0.69 (1.00) |
0.433 (1.00) |
|
| 8q gain | 0 (0%) | 120 |
0.853 (1.00) |
0.575 (1.00) |
0.288 (1.00) |
0.331 (1.00) |
0.181 (1.00) |
0.577 (1.00) |
0.725 (1.00) |
|
| 9p gain | 0 (0%) | 176 |
0.83 (1.00) |
0.147 (1.00) |
0.453 (1.00) |
0.643 (1.00) |
0.995 (1.00) |
0.138 (1.00) |
0.307 (1.00) |
|
| 9q gain | 0 (0%) | 176 |
0.966 (1.00) |
0.933 (1.00) |
0.615 (1.00) |
0.643 (1.00) |
0.995 (1.00) |
0.316 (1.00) |
0.681 (1.00) |
|
| 11p gain | 0 (0%) | 169 |
0.903 (1.00) |
0.263 (1.00) |
0.745 (1.00) |
0.533 (1.00) |
0.969 (1.00) |
0.119 (1.00) |
0.807 (1.00) |
|
| 11q gain | 0 (0%) | 172 |
0.39 (1.00) |
0.297 (1.00) |
0.76 (1.00) |
0.486 (1.00) |
0.985 (1.00) |
0.944 (1.00) |
0.678 (1.00) |
|
| 12p gain | 0 (0%) | 159 |
0.963 (1.00) |
0.64 (1.00) |
0.629 (1.00) |
1 (1.00) |
0.199 (1.00) |
0.186 (1.00) |
0.202 (1.00) |
|
| 12q gain | 0 (0%) | 172 |
0.746 (1.00) |
0.814 (1.00) |
0.876 (1.00) |
0.486 (1.00) |
0.985 (1.00) |
0.0292 (1.00) |
0.142 (1.00) |
|
| 13q gain | 0 (0%) | 149 |
0.513 (1.00) |
0.769 (1.00) |
0.0301 (1.00) |
0.84 (1.00) |
0.576 (1.00) |
0.26 (1.00) |
0.108 (1.00) |
|
| 14q gain | 0 (0%) | 166 |
0.726 (1.00) |
0.77 (1.00) |
1 (1.00) |
0.571 (1.00) |
0.956 (1.00) |
0.72 (1.00) |
0.873 (1.00) |
|
| 15q gain | 0 (0%) | 154 |
0.824 (1.00) |
0.351 (1.00) |
0.811 (1.00) |
1 (1.00) |
0.839 (1.00) |
0.424 (1.00) |
0.932 (1.00) |
|
| 16p gain | 0 (0%) | 164 |
0.795 (1.00) |
0.794 (1.00) |
0.195 (1.00) |
1 (1.00) |
0.924 (1.00) |
0.834 (1.00) |
0.37 (1.00) |
|
| 16q gain | 0 (0%) | 167 |
0.779 (1.00) |
0.381 (1.00) |
0.241 (1.00) |
1 (1.00) |
0.949 (1.00) |
0.309 (1.00) |
0.611 (1.00) |
|
| 17p gain | 0 (0%) | 165 |
0.637 (1.00) |
0.962 (1.00) |
0.375 (1.00) |
0.273 (1.00) |
0.247 (1.00) |
0.931 (1.00) |
0.0952 (1.00) |
|
| 17q gain | 0 (0%) | 156 |
0.301 (1.00) |
0.0634 (1.00) |
0.764 (1.00) |
0.264 (1.00) |
0.517 (1.00) |
0.627 (1.00) |
0.186 (1.00) |
|
| 19p gain | 0 (0%) | 168 |
0.578 (1.00) |
0.17 (1.00) |
0.252 (1.00) |
0.542 (1.00) |
0.963 (1.00) |
0.942 (1.00) |
0.0884 (1.00) |
|
| 19q gain | 0 (0%) | 164 |
0.574 (1.00) |
0.054 (1.00) |
0.547 (1.00) |
0.0589 (1.00) |
0.933 (1.00) |
0.646 (1.00) |
0.156 (1.00) |
|
| 20p gain | 0 (0%) | 125 |
0.569 (1.00) |
0.478 (1.00) |
0.602 (1.00) |
0.74 (1.00) |
0.158 (1.00) |
0.798 (1.00) |
0.603 (1.00) |
|
| 20q gain | 0 (0%) | 113 |
0.166 (1.00) |
0.946 (1.00) |
0.647 (1.00) |
0.532 (1.00) |
0.0828 (1.00) |
0.969 (1.00) |
0.604 (1.00) |
|
| 21q gain | 0 (0%) | 159 |
0.75 (1.00) |
0.901 (1.00) |
0.435 (1.00) |
0.476 (1.00) |
0.171 (1.00) |
0.3 (1.00) |
0.0303 (1.00) |
|
| 22q gain | 0 (0%) | 132 |
0.151 (1.00) |
0.887 (1.00) |
0.0568 (1.00) |
0.3 (1.00) |
0.659 (1.00) |
0.061 (1.00) |
0.0431 (1.00) |
|
| Xq gain | 0 (0%) | 177 |
0.695 (1.00) |
0.0702 (1.00) |
0.295 (1.00) |
0.283 (1.00) |
||||
| 1p loss | 0 (0%) | 166 |
0.128 (1.00) |
0.801 (1.00) |
0.583 (1.00) |
0.78 (1.00) |
0.963 (1.00) |
0.322 (1.00) |
0.314 (1.00) |
|
| 1q loss | 0 (0%) | 174 |
0.904 (1.00) |
0.444 (1.00) |
0.128 (1.00) |
0.679 (1.00) |
0.989 (1.00) |
0.578 (1.00) |
0.893 (1.00) |
|
| 2p loss | 0 (0%) | 165 |
0.12 (1.00) |
0.79 (1.00) |
0.602 (1.00) |
1 (1.00) |
0.956 (1.00) |
0.971 (1.00) |
0.286 (1.00) |
|
| 2q loss | 0 (0%) | 166 |
0.199 (1.00) |
0.425 (1.00) |
0.739 (1.00) |
0.403 (1.00) |
0.207 (1.00) |
0.913 (1.00) |
0.157 (1.00) |
|
| 3p loss | 0 (0%) | 167 |
0.325 (1.00) |
0.17 (1.00) |
0.303 (1.00) |
1 (1.00) |
0.963 (1.00) |
0.383 (1.00) |
0.0752 (1.00) |
|
| 3q loss | 0 (0%) | 167 |
0.329 (1.00) |
0.557 (1.00) |
0.281 (1.00) |
0.57 (1.00) |
0.963 (1.00) |
0.383 (1.00) |
0.439 (1.00) |
|
| 4p loss | 0 (0%) | 160 |
0.937 (1.00) |
0.436 (1.00) |
0.343 (1.00) |
0.0517 (1.00) |
0.392 (1.00) |
0.96 (1.00) |
0.6 (1.00) |
|
| 4q loss | 0 (0%) | 161 |
0.946 (1.00) |
0.508 (1.00) |
0.465 (1.00) |
0.0848 (1.00) |
0.000662 (0.354) |
0.896 (1.00) |
0.643 (1.00) |
|
| 5p loss | 0 (0%) | 155 |
0.588 (1.00) |
0.521 (1.00) |
0.246 (1.00) |
1 (1.00) |
0.874 (1.00) |
0.985 (1.00) |
0.873 (1.00) |
|
| 5q loss | 0 (0%) | 141 |
0.433 (1.00) |
0.627 (1.00) |
0.201 (1.00) |
0.714 (1.00) |
0.466 (1.00) |
0.896 (1.00) |
0.859 (1.00) |
|
| 6p loss | 0 (0%) | 165 |
0.448 (1.00) |
0.905 (1.00) |
0.0912 (1.00) |
1 (1.00) |
0.933 (1.00) |
0.859 (1.00) |
0.746 (1.00) |
|
| 6q loss | 0 (0%) | 112 |
0.696 (1.00) |
0.137 (1.00) |
0.162 (1.00) |
0.876 (1.00) |
0.983 (1.00) |
0.634 (1.00) |
0.434 (1.00) |
|
| 7p loss | 0 (0%) | 177 |
0.0683 (1.00) |
0.58 (1.00) |
0.295 (1.00) |
0.561 (1.00) |
0.997 (1.00) |
0.973 (1.00) |
0.391 (1.00) |
|
| 7q loss | 0 (0%) | 177 |
0.0683 (1.00) |
0.58 (1.00) |
0.295 (1.00) |
0.561 (1.00) |
0.997 (1.00) |
0.973 (1.00) |
0.391 (1.00) |
|
| 8p loss | 0 (0%) | 158 |
0.995 (1.00) |
0.933 (1.00) |
0.26 (1.00) |
1 (1.00) |
0.45 (1.00) |
0.528 (1.00) |
0.487 (1.00) |
|
| 8q loss | 0 (0%) | 177 |
0.333 (1.00) |
0.623 (1.00) |
0.484 (1.00) |
0.0573 (1.00) |
0.997 (1.00) |
0.31 (1.00) |
0.463 (1.00) |
|
| 9p loss | 0 (0%) | 75 |
0.329 (1.00) |
0.358 (1.00) |
0.0331 (1.00) |
0.538 (1.00) |
0.562 (1.00) |
0.0343 (1.00) |
0.0392 (1.00) |
|
| 9q loss | 0 (0%) | 102 |
0.737 (1.00) |
0.0769 (1.00) |
0.126 (1.00) |
0.0211 (1.00) |
0.236 (1.00) |
0.289 (1.00) |
0.0153 (1.00) |
|
| 10p loss | 0 (0%) | 103 |
0.15 (1.00) |
0.238 (1.00) |
0.282 (1.00) |
0.0659 (1.00) |
0.379 (1.00) |
0.262 (1.00) |
0.767 (1.00) |
|
| 10q loss | 0 (0%) | 92 |
0.579 (1.00) |
0.00647 (1.00) |
0.116 (1.00) |
0.169 (1.00) |
0.187 (1.00) |
0.405 (1.00) |
0.692 (1.00) |
|
| 11p loss | 0 (0%) | 132 |
0.0503 (1.00) |
0.201 (1.00) |
0.411 (1.00) |
0.0837 (1.00) |
0.0938 (1.00) |
0.434 (1.00) |
0.0341 (1.00) |
|
| 11q loss | 0 (0%) | 126 |
0.0311 (1.00) |
0.882 (1.00) |
0.397 (1.00) |
0.0993 (1.00) |
0.157 (1.00) |
0.462 (1.00) |
0.0149 (1.00) |
|
| 12p loss | 0 (0%) | 168 |
0.717 (1.00) |
0.762 (1.00) |
0.413 (1.00) |
0.542 (1.00) |
0.207 (1.00) |
0.312 (1.00) |
0.73 (1.00) |
|
| 12q loss | 0 (0%) | 160 |
0.751 (1.00) |
0.748 (1.00) |
0.117 (1.00) |
0.333 (1.00) |
0.171 (1.00) |
0.439 (1.00) |
0.529 (1.00) |
|
| 13q loss | 0 (0%) | 153 |
0.983 (1.00) |
0.571 (1.00) |
0.162 (1.00) |
0.833 (1.00) |
0.00554 (1.00) |
0.115 (1.00) |
0.625 (1.00) |
|
| 14q loss | 0 (0%) | 136 |
0.761 (1.00) |
0.588 (1.00) |
0.684 (1.00) |
0.726 (1.00) |
0.103 (1.00) |
0.603 (1.00) |
0.492 (1.00) |
|
| 15q loss | 0 (0%) | 169 |
0.621 (1.00) |
0.3 (1.00) |
0.15 (1.00) |
0.753 (1.00) |
0.126 (1.00) |
0.513 (1.00) |
0.885 (1.00) |
|
| 16p loss | 0 (0%) | 166 |
0.312 (1.00) |
0.369 (1.00) |
0.536 (1.00) |
0.403 (1.00) |
0.963 (1.00) |
0.767 (1.00) |
0.211 (1.00) |
|
| 16q loss | 0 (0%) | 149 |
0.0164 (1.00) |
0.75 (1.00) |
0.532 (1.00) |
0.692 (1.00) |
0.391 (1.00) |
0.868 (1.00) |
0.184 (1.00) |
|
| 17p loss | 0 (0%) | 142 |
0.452 (1.00) |
0.521 (1.00) |
0.216 (1.00) |
0.577 (1.00) |
0.516 (1.00) |
0.687 (1.00) |
0.488 (1.00) |
|
| 17q loss | 0 (0%) | 163 |
0.114 (1.00) |
0.861 (1.00) |
0.773 (1.00) |
0.8 (1.00) |
0.0931 (1.00) |
0.143 (1.00) |
0.606 (1.00) |
|
| 18p loss | 0 (0%) | 145 |
0.515 (1.00) |
0.51 (1.00) |
0.158 (1.00) |
0.7 (1.00) |
0.732 (1.00) |
0.128 (1.00) |
0.189 (1.00) |
|
| 18q loss | 0 (0%) | 147 |
0.524 (1.00) |
0.436 (1.00) |
0.179 (1.00) |
0.695 (1.00) |
0.613 (1.00) |
0.322 (1.00) |
0.137 (1.00) |
|
| 19p loss | 0 (0%) | 165 |
0.4 (1.00) |
0.385 (1.00) |
0.602 (1.00) |
0.0274 (1.00) |
0.0712 (1.00) |
0.659 (1.00) |
0.271 (1.00) |
|
| 19q loss | 0 (0%) | 164 |
0.92 (1.00) |
0.696 (1.00) |
0.0321 (1.00) |
0.179 (1.00) |
0.0359 (1.00) |
0.502 (1.00) |
0.496 (1.00) |
|
| 20p loss | 0 (0%) | 172 |
0.712 (1.00) |
0.456 (1.00) |
0.187 (1.00) |
0.486 (1.00) |
0.0564 (1.00) |
0.957 (1.00) |
0.715 (1.00) |
|
| 21q loss | 0 (0%) | 158 |
0.947 (1.00) |
0.915 (1.00) |
0.786 (1.00) |
0.82 (1.00) |
0.874 (1.00) |
0.728 (1.00) |
0.113 (1.00) |
|
| 22q loss | 0 (0%) | 167 |
0.963 (1.00) |
0.678 (1.00) |
0.303 (1.00) |
0.57 (1.00) |
0.247 (1.00) |
0.993 (1.00) |
0.322 (1.00) |
|
| Xq loss | 0 (0%) | 174 |
0.473 (1.00) |
0.625 (1.00) |
0.503 (1.00) |
0.0337 (1.00) |
0.992 (1.00) |
0.985 (1.00) |
0.474 (1.00) |
P value = 1.13e-05 (Chi-square test), Q value = 0.006
Table S1. Gene #30: '18p gain' versus Clinical Feature #8: 'NEOPLASM.DISEASESTAGE'
| nPatients | I OR II NOS | STAGE I | STAGE IA | STAGE IB | STAGE II | STAGE IIA | STAGE IIB | STAGE IIC | STAGE III | STAGE IIIA | STAGE IIIB | STAGE IIIC | STAGE IV |
|---|---|---|---|---|---|---|---|---|---|---|---|---|---|
| ALL | 4 | 18 | 10 | 15 | 19 | 9 | 10 | 8 | 10 | 6 | 19 | 25 | 6 |
| 18P GAIN CNV | 2 | 3 | 0 | 0 | 2 | 0 | 0 | 6 | 1 | 3 | 2 | 3 | 0 |
| 18P GAIN WILD-TYPE | 2 | 15 | 10 | 15 | 17 | 9 | 10 | 2 | 9 | 3 | 17 | 22 | 6 |
Figure S1. Get High-res Image Gene #30: '18p gain' versus Clinical Feature #8: 'NEOPLASM.DISEASESTAGE'
P value = 3.76e-08 (Chi-square test), Q value = 2e-05
Table S2. Gene #31: '18q gain' versus Clinical Feature #8: 'NEOPLASM.DISEASESTAGE'
| nPatients | I OR II NOS | STAGE I | STAGE IA | STAGE IB | STAGE II | STAGE IIA | STAGE IIB | STAGE IIC | STAGE III | STAGE IIIA | STAGE IIIB | STAGE IIIC | STAGE IV |
|---|---|---|---|---|---|---|---|---|---|---|---|---|---|
| ALL | 4 | 18 | 10 | 15 | 19 | 9 | 10 | 8 | 10 | 6 | 19 | 25 | 6 |
| 18Q GAIN CNV | 2 | 1 | 0 | 0 | 0 | 0 | 0 | 5 | 0 | 2 | 0 | 2 | 0 |
| 18Q GAIN WILD-TYPE | 2 | 17 | 10 | 15 | 19 | 9 | 10 | 3 | 10 | 4 | 19 | 23 | 6 |
Figure S2. Get High-res Image Gene #31: '18q gain' versus Clinical Feature #8: 'NEOPLASM.DISEASESTAGE'
-
Mutation data file = broad_values_by_arm.mutsig.cluster.txt
-
Clinical data file = SKCM-TM.clin.merged.picked.txt
-
Number of patients = 180
-
Number of significantly arm-level cnvs = 77
-
Number of selected clinical features = 8
-
Exclude genes that fewer than K tumors have mutations, K = 3
For survival clinical features, the Kaplan-Meier survival curves of tumors with and without gene mutations were plotted and the statistical significance P values were estimated by logrank test (Bland and Altman 2004) using the 'survdiff' function in R
For continuous numerical clinical features, two-tailed Student's t test with unequal variance (Lehmann and Romano 2005) was applied to compare the clinical values between tumors with and without gene mutations using 't.test' function in R
For binary or multi-class clinical features (nominal or ordinal), two-tailed Fisher's exact tests (Fisher 1922) were used to estimate the P values using the 'fisher.test' function in R
For multi-class clinical features (nominal or ordinal), Chi-square tests (Greenwood and Nikulin 1996) were used to estimate the P values using the 'chisq.test' function in R
For multiple hypothesis correction, Q value is the False Discovery Rate (FDR) analogue of the P value (Benjamini and Hochberg 1995), defined as the minimum FDR at which the test may be called significant. We used the 'Benjamini and Hochberg' method of 'p.adjust' function in R to convert P values into Q values.
This is an experimental feature. The full results of the analysis summarized in this report can be downloaded from the TCGA Data Coordination Center.