This pipeline uses various statistical tests to identify genes whose promoter methylation levels correlated to selected clinical features.
Testing the association between 19639 genes and 7 clinical features across 177 samples, statistically thresholded by Q value < 0.05, 6 clinical features related to at least one genes.
-
14 genes correlated to 'AGE'.
-
PTX3 , VEPH1__1 , ITGA8 , RSPO4 , TRPV4 , ...
-
213 genes correlated to 'PRIMARY.SITE.OF.DISEASE'.
-
DAZAP1 , TCF3 , IRAK4 , PUS7L , TCF25 , ...
-
1 gene correlated to 'GENDER'.
-
DDX43
-
278 genes correlated to 'DISTANT.METASTASIS'.
-
SELT , LMF1 , LDHAL6B , MYO1E__1 , FAM186A , ...
-
59 genes correlated to 'LYMPH.NODE.METASTASIS'.
-
NGLY1__1 , C6ORF162__1 , GJB7__1 , LIMK2 , AP2S1 , ...
-
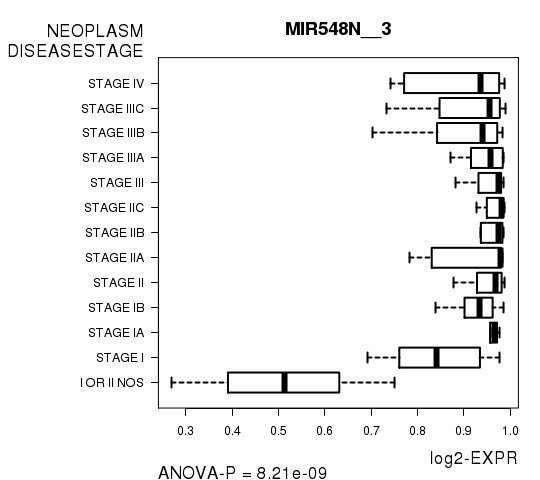
12 genes correlated to 'NEOPLASM.DISEASESTAGE'.
-
MIR548N__3 , TTN , POLE4 , C4ORF3 , RAD21L1 , ...
-
No genes correlated to 'Time to Death'
Complete statistical result table is provided in Supplement Table 1
Table 1. Get Full Table This table shows the clinical features, statistical methods used, and the number of genes that are significantly associated with each clinical feature at Q value < 0.05.
| Clinical feature | Statistical test | Significant genes | Associated with | Associated with | ||
|---|---|---|---|---|---|---|
| Time to Death | Cox regression test | N=0 | ||||
| AGE | Spearman correlation test | N=14 | older | N=14 | younger | N=0 |
| PRIMARY SITE OF DISEASE | ANOVA test | N=213 | ||||
| GENDER | t test | N=1 | male | N=0 | female | N=1 |
| DISTANT METASTASIS | ANOVA test | N=278 | ||||
| LYMPH NODE METASTASIS | ANOVA test | N=59 | ||||
| NEOPLASM DISEASESTAGE | ANOVA test | N=12 |
Table S1. Basic characteristics of clinical feature: 'Time to Death'
| Time to Death | Duration (Months) | 0.2-357.4 (median=47.5) |
| censored | N = 86 | |
| death | N = 88 | |
| Significant markers | N = 0 |
Table S2. Basic characteristics of clinical feature: 'AGE'
| AGE | Mean (SD) | 55.9 (16) |
| Significant markers | N = 14 | |
| pos. correlated | 14 | |
| neg. correlated | 0 |
Table S3. Get Full Table List of top 10 genes significantly correlated to 'AGE' by Spearman correlation test
| SpearmanCorr | corrP | Q | |
|---|---|---|---|
| PTX3 | 0.4169 | 8.644e-09 | 0.00017 |
| VEPH1__1 | 0.4169 | 8.644e-09 | 0.00017 |
| ITGA8 | 0.3897 | 8.973e-08 | 0.00176 |
| RSPO4 | 0.3854 | 1.279e-07 | 0.00251 |
| TRPV4 | 0.381 | 1.828e-07 | 0.00359 |
| NIPAL2 | 0.3657 | 6.004e-07 | 0.0118 |
| PLCE1 | 0.3607 | 8.737e-07 | 0.0172 |
| STK38L | 0.3594 | 9.625e-07 | 0.0189 |
| MCHR1 | 0.3591 | 9.875e-07 | 0.0194 |
| STBD1 | 0.3548 | 1.36e-06 | 0.0267 |
Figure S1. Get High-res Image As an example, this figure shows the association of PTX3 to 'AGE'. P value = 8.64e-09 with Spearman correlation analysis. The straight line presents the best linear regression.
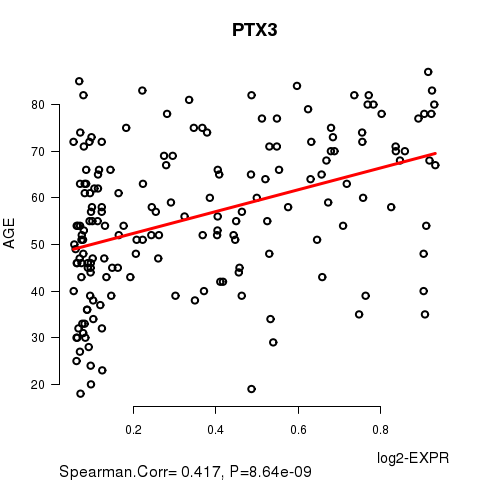
Table S4. Basic characteristics of clinical feature: 'PRIMARY.SITE.OF.DISEASE'
| PRIMARY.SITE.OF.DISEASE | Labels | N |
| DISTANT METASTASIS | 27 | |
| PRIMARY TUMOR | 1 | |
| REGIONAL CUTANEOUS OR SUBCUTANEOUS TISSUE (INCLUDES SATELLITE AND IN-TRANSIT METASTASIS) | 35 | |
| REGIONAL LYMPH NODE | 114 | |
| Significant markers | N = 213 |
Table S5. Get Full Table List of top 10 genes differentially expressed by 'PRIMARY.SITE.OF.DISEASE'
| ANOVA_P | Q | |
|---|---|---|
| DAZAP1 | 5.236e-112 | 1.03e-107 |
| TCF3 | 1.606e-53 | 3.15e-49 |
| IRAK4 | 1.627e-51 | 3.2e-47 |
| PUS7L | 1.627e-51 | 3.2e-47 |
| TCF25 | 2.008e-47 | 3.94e-43 |
| AMY2B | 1.304e-42 | 2.56e-38 |
| RNPC3__1 | 1.304e-42 | 2.56e-38 |
| TUBGCP6 | 6.768e-41 | 1.33e-36 |
| COL18A1__1 | 7.285e-41 | 1.43e-36 |
| NCRNA00175 | 7.285e-41 | 1.43e-36 |
Figure S2. Get High-res Image As an example, this figure shows the association of DAZAP1 to 'PRIMARY.SITE.OF.DISEASE'. P value = 5.24e-112 with ANOVA analysis.
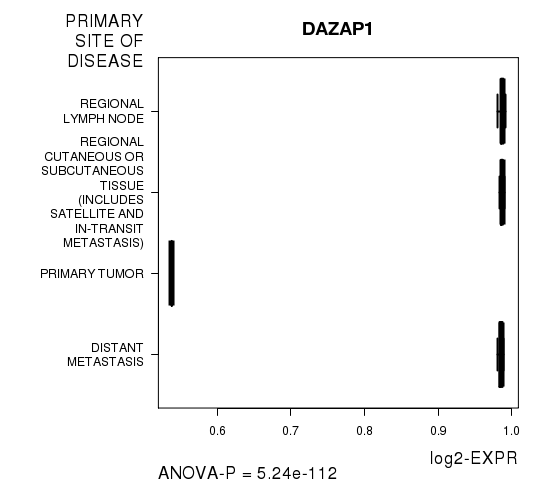
Table S6. Basic characteristics of clinical feature: 'GENDER'
| GENDER | Labels | N |
| FEMALE | 69 | |
| MALE | 108 | |
| Significant markers | N = 1 | |
| Higher in MALE | 0 | |
| Higher in FEMALE | 1 |
Table S7. Get Full Table List of one gene differentially expressed by 'GENDER'
| T(pos if higher in 'MALE') | ttestP | Q | AUC | |
|---|---|---|---|---|
| DDX43 | -5.24 | 4.537e-07 | 0.00891 | 0.7348 |
Figure S3. Get High-res Image As an example, this figure shows the association of DDX43 to 'GENDER'. P value = 4.54e-07 with T-test analysis.
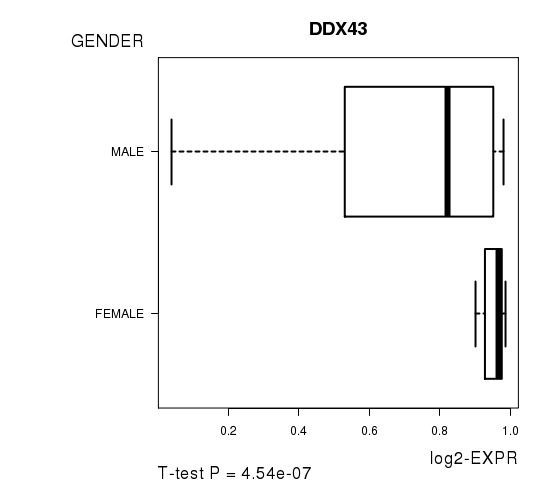
Table S8. Basic characteristics of clinical feature: 'DISTANT.METASTASIS'
| DISTANT.METASTASIS | Labels | N |
| M0 | 154 | |
| M1 | 2 | |
| M1A | 2 | |
| M1B | 2 | |
| M1C | 2 | |
| Significant markers | N = 278 |
Table S9. Get Full Table List of top 10 genes differentially expressed by 'DISTANT.METASTASIS'
| ANOVA_P | Q | |
|---|---|---|
| SELT | 1.964e-22 | 3.86e-18 |
| LMF1 | 2.482e-22 | 4.87e-18 |
| LDHAL6B | 3.862e-22 | 7.58e-18 |
| MYO1E__1 | 3.862e-22 | 7.58e-18 |
| FAM186A | 7.877e-22 | 1.55e-17 |
| CCNG1 | 8.802e-22 | 1.73e-17 |
| C10ORF88 | 3.27e-20 | 6.42e-16 |
| RASA2 | 3.568e-20 | 7e-16 |
| ACSS1 | 1.672e-18 | 3.28e-14 |
| MDM1 | 5.005e-18 | 9.82e-14 |
Figure S4. Get High-res Image As an example, this figure shows the association of SELT to 'DISTANT.METASTASIS'. P value = 1.96e-22 with ANOVA analysis.
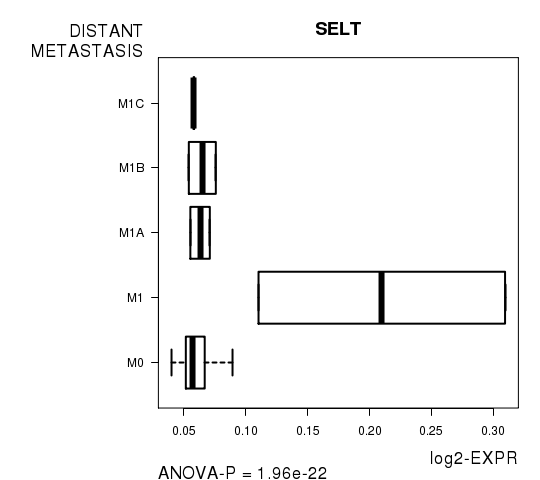
Table S10. Basic characteristics of clinical feature: 'LYMPH.NODE.METASTASIS'
| LYMPH.NODE.METASTASIS | Labels | N |
| N0 | 97 | |
| N1 | 2 | |
| N1A | 8 | |
| N1B | 15 | |
| N2 | 1 | |
| N2A | 4 | |
| N2B | 12 | |
| N2C | 5 | |
| N3 | 17 | |
| NX | 2 | |
| Significant markers | N = 59 |
Table S11. Get Full Table List of top 10 genes differentially expressed by 'LYMPH.NODE.METASTASIS'
| ANOVA_P | Q | |
|---|---|---|
| NGLY1__1 | 6.023e-66 | 1.18e-61 |
| C6ORF162__1 | 7.342e-41 | 1.44e-36 |
| GJB7__1 | 7.342e-41 | 1.44e-36 |
| LIMK2 | 4.393e-29 | 8.63e-25 |
| AP2S1 | 4.368e-28 | 8.58e-24 |
| NOS1 | 4.971e-24 | 9.76e-20 |
| C17ORF63 | 5.552e-24 | 1.09e-19 |
| CSRP2BP | 3.888e-18 | 7.63e-14 |
| PET117 | 3.888e-18 | 7.63e-14 |
| GPR44 | 7.785e-18 | 1.53e-13 |
Figure S5. Get High-res Image As an example, this figure shows the association of NGLY1__1 to 'LYMPH.NODE.METASTASIS'. P value = 6.02e-66 with ANOVA analysis.
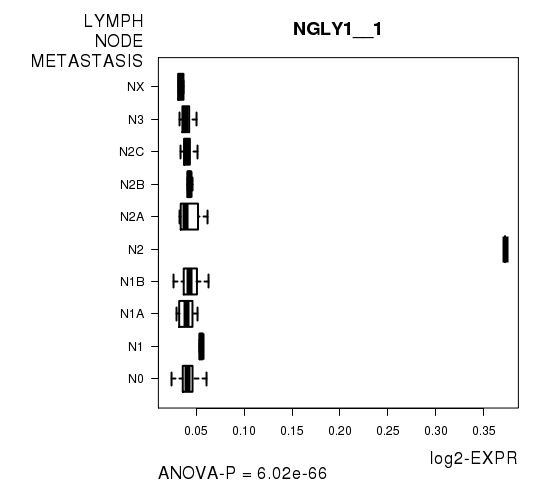
Table S12. Basic characteristics of clinical feature: 'NEOPLASM.DISEASESTAGE'
| NEOPLASM.DISEASESTAGE | Labels | N |
| I OR II NOS | 3 | |
| STAGE I | 18 | |
| STAGE IA | 10 | |
| STAGE IB | 15 | |
| STAGE II | 19 | |
| STAGE IIA | 9 | |
| STAGE IIB | 10 | |
| STAGE IIC | 8 | |
| STAGE III | 9 | |
| STAGE IIIA | 6 | |
| STAGE IIIB | 19 | |
| STAGE IIIC | 24 | |
| STAGE IV | 6 | |
| Significant markers | N = 12 |
Table S13. Get Full Table List of top 10 genes differentially expressed by 'NEOPLASM.DISEASESTAGE'
| ANOVA_P | Q | |
|---|---|---|
| MIR548N__3 | 8.208e-09 | 0.000161 |
| TTN | 8.208e-09 | 0.000161 |
| POLE4 | 3.547e-08 | 0.000697 |
| C4ORF3 | 1.459e-07 | 0.00286 |
| RAD21L1 | 1.483e-07 | 0.00291 |
| ZNF587 | 1.554e-07 | 0.00305 |
| GRAMD1B | 2.738e-07 | 0.00538 |
| C3ORF18__1 | 9.597e-07 | 0.0188 |
| HEMK1 | 9.597e-07 | 0.0188 |
| UBE2I | 9.63e-07 | 0.0189 |
Figure S6. Get High-res Image As an example, this figure shows the association of MIR548N__3 to 'NEOPLASM.DISEASESTAGE'. P value = 8.21e-09 with ANOVA analysis.
-
Expresson data file = SKCM-TM.meth.by_min_expr_corr.data.txt
-
Clinical data file = SKCM-TM.clin.merged.picked.txt
-
Number of patients = 177
-
Number of genes = 19639
-
Number of clinical features = 7
For survival clinical features, Wald's test in univariate Cox regression analysis with proportional hazards model (Andersen and Gill 1982) was used to estimate the P values using the 'coxph' function in R. Kaplan-Meier survival curves were plot using the four quartile subgroups of patients based on expression levels
For continuous numerical clinical features, Spearman's rank correlation coefficients (Spearman 1904) and two-tailed P values were estimated using 'cor.test' function in R
For multi-class clinical features (ordinal or nominal), one-way analysis of variance (Howell 2002) was applied to compare the log2-expression levels between different clinical classes using 'anova' function in R
For two-class clinical features, two-tailed Student's t test with unequal variance (Lehmann and Romano 2005) was applied to compare the log2-expression levels between the two clinical classes using 't.test' function in R
For multiple hypothesis correction, Q value is the False Discovery Rate (FDR) analogue of the P value (Benjamini and Hochberg 1995), defined as the minimum FDR at which the test may be called significant. We used the 'Benjamini and Hochberg' method of 'p.adjust' function in R to convert P values into Q values.
This is an experimental feature. The full results of the analysis summarized in this report can be downloaded from the TCGA Data Coordination Center.