This pipeline uses various statistical tests to identify RPPAs whose expression levels correlated to selected clinical features.
Testing the association between 175 genes and 7 clinical features across 109 samples, statistically thresholded by Q value < 0.05, 3 clinical features related to at least one genes.
-
1 gene correlated to 'Time to Death'.
-
GSK3A GSK3B|GSK3-ALPHA-BETA-M-V
-
1 gene correlated to 'DISTANT.METASTASIS'.
-
C12ORF5|TIGAR-R-V
-
2 genes correlated to 'LYMPH.NODE.METASTASIS'.
-
PGR|PR-R-V , ESR1|ER-ALPHA-R-V
-
No genes correlated to 'AGE', 'PRIMARY.SITE.OF.DISEASE', 'GENDER', and 'NEOPLASM.DISEASESTAGE'.
Complete statistical result table is provided in Supplement Table 1
Table 1. Get Full Table This table shows the clinical features, statistical methods used, and the number of genes that are significantly associated with each clinical feature at Q value < 0.05.
| Clinical feature | Statistical test | Significant genes | Associated with | Associated with | ||
|---|---|---|---|---|---|---|
| Time to Death | Cox regression test | N=1 | shorter survival | N=1 | longer survival | N=0 |
| AGE | Spearman correlation test | N=0 | ||||
| PRIMARY SITE OF DISEASE | ANOVA test | N=0 | ||||
| GENDER | t test | N=0 | ||||
| DISTANT METASTASIS | ANOVA test | N=1 | ||||
| LYMPH NODE METASTASIS | ANOVA test | N=2 | ||||
| NEOPLASM DISEASESTAGE | ANOVA test | N=0 |
Table S1. Basic characteristics of clinical feature: 'Time to Death'
| Time to Death | Duration (Months) | 2.6-357.4 (median=47.5) |
| censored | N = 50 | |
| death | N = 58 | |
| Significant markers | N = 1 | |
| associated with shorter survival | 1 | |
| associated with longer survival | 0 |
Table S2. Get Full Table List of one gene significantly associated with 'Time to Death' by Cox regression test
| HazardRatio | Wald_P | Q | C_index | |
|---|---|---|---|---|
| GSK3A GSK3B|GSK3-ALPHA-BETA-M-V | 9.1 | 0.0002674 | 0.047 | 0.624 |
Figure S1. Get High-res Image As an example, this figure shows the association of GSK3A GSK3B|GSK3-ALPHA-BETA-M-V to 'Time to Death'. four curves present the cumulative survival rates of 4 quartile subsets of patients. P value = 0.000267 with univariate Cox regression analysis using continuous log-2 expression values.
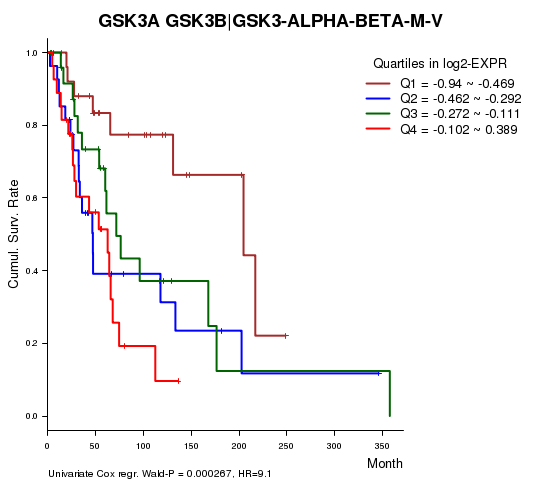
Table S3. Basic characteristics of clinical feature: 'AGE'
| AGE | Mean (SD) | 56.4 (17) |
| Significant markers | N = 0 |
Table S4. Basic characteristics of clinical feature: 'PRIMARY.SITE.OF.DISEASE'
| PRIMARY.SITE.OF.DISEASE | Labels | N |
| DISTANT METASTASIS | 13 | |
| PRIMARY TUMOR | 1 | |
| REGIONAL CUTANEOUS OR SUBCUTANEOUS TISSUE (INCLUDES SATELLITE AND IN-TRANSIT METASTASIS) | 15 | |
| REGIONAL LYMPH NODE | 80 | |
| Significant markers | N = 0 |
Table S5. Basic characteristics of clinical feature: 'GENDER'
| GENDER | Labels | N |
| FEMALE | 44 | |
| MALE | 65 | |
| Significant markers | N = 0 |
Table S6. Basic characteristics of clinical feature: 'DISTANT.METASTASIS'
| DISTANT.METASTASIS | Labels | N |
| M0 | 90 | |
| M1 | 1 | |
| M1B | 2 | |
| M1C | 2 | |
| Significant markers | N = 1 |
Table S7. Get Full Table List of one gene differentially expressed by 'DISTANT.METASTASIS'
| ANOVA_P | Q | |
|---|---|---|
| C12ORF5|TIGAR-R-V | 0.0001783 | 0.0312 |
Figure S2. Get High-res Image As an example, this figure shows the association of C12ORF5|TIGAR-R-V to 'DISTANT.METASTASIS'. P value = 0.000178 with ANOVA analysis.
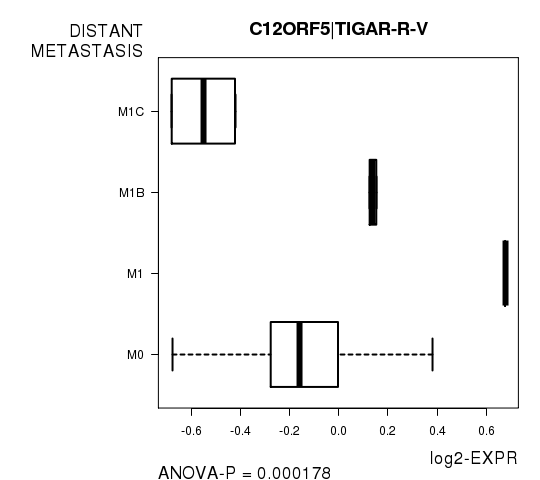
Table S8. Basic characteristics of clinical feature: 'LYMPH.NODE.METASTASIS'
| LYMPH.NODE.METASTASIS | Labels | N |
| N0 | 56 | |
| N1 | 2 | |
| N1A | 3 | |
| N1B | 13 | |
| N2A | 2 | |
| N2B | 5 | |
| N2C | 4 | |
| N3 | 9 | |
| NX | 2 | |
| Significant markers | N = 2 |
Table S9. Get Full Table List of 2 genes differentially expressed by 'LYMPH.NODE.METASTASIS'
| ANOVA_P | Q | |
|---|---|---|
| PGR|PR-R-V | 3.618e-08 | 6.33e-06 |
| ESR1|ER-ALPHA-R-V | 8.673e-08 | 1.51e-05 |
Figure S3. Get High-res Image As an example, this figure shows the association of PGR|PR-R-V to 'LYMPH.NODE.METASTASIS'. P value = 3.62e-08 with ANOVA analysis.
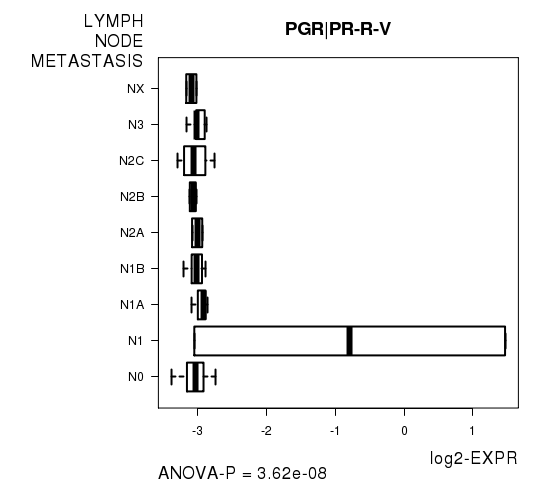
Table S10. Basic characteristics of clinical feature: 'NEOPLASM.DISEASESTAGE'
| NEOPLASM.DISEASESTAGE | Labels | N |
| I OR II NOS | 3 | |
| STAGE I | 11 | |
| STAGE IA | 8 | |
| STAGE IB | 8 | |
| STAGE II | 10 | |
| STAGE IIA | 5 | |
| STAGE IIB | 5 | |
| STAGE IIC | 3 | |
| STAGE III | 6 | |
| STAGE IIIA | 2 | |
| STAGE IIIB | 11 | |
| STAGE IIIC | 13 | |
| STAGE IV | 4 | |
| Significant markers | N = 0 |
-
Expresson data file = SKCM-TM.rppa.txt
-
Clinical data file = SKCM-TM.clin.merged.picked.txt
-
Number of patients = 109
-
Number of genes = 175
-
Number of clinical features = 7
For survival clinical features, Wald's test in univariate Cox regression analysis with proportional hazards model (Andersen and Gill 1982) was used to estimate the P values using the 'coxph' function in R. Kaplan-Meier survival curves were plot using the four quartile subgroups of patients based on expression levels
For continuous numerical clinical features, Spearman's rank correlation coefficients (Spearman 1904) and two-tailed P values were estimated using 'cor.test' function in R
For multi-class clinical features (ordinal or nominal), one-way analysis of variance (Howell 2002) was applied to compare the log2-expression levels between different clinical classes using 'anova' function in R
For two-class clinical features, two-tailed Student's t test with unequal variance (Lehmann and Romano 2005) was applied to compare the log2-expression levels between the two clinical classes using 't.test' function in R
For multiple hypothesis correction, Q value is the False Discovery Rate (FDR) analogue of the P value (Benjamini and Hochberg 1995), defined as the minimum FDR at which the test may be called significant. We used the 'Benjamini and Hochberg' method of 'p.adjust' function in R to convert P values into Q values.
This is an experimental feature. The full results of the analysis summarized in this report can be downloaded from the TCGA Data Coordination Center.