This pipeline uses various statistical tests to identify mRNAs whose expression levels correlated to selected clinical features.
Testing the association between 18090 genes and 7 clinical features across 171 samples, statistically thresholded by Q value < 0.05, 7 clinical features related to at least one genes.
-
5 genes correlated to 'Time to Death'.
-
ARHGAP12|94134 , KCTD18|130535 , ZNF25|219749 , PRKAR2B|5577 , EID1|23741
-
5 genes correlated to 'AGE'.
-
ACOX2|8309 , MCHR1|2847 , TCEAL5|340543 , MAOB|4129 , PHKA1|5255
-
55 genes correlated to 'PRIMARY.SITE.OF.DISEASE'.
-
TMEM156|80008 , CD38|952 , P2RY10|27334 , IGJ|3512 , POU2AF1|5450 , ...
-
18 genes correlated to 'GENDER'.
-
ZFY|7544 , PRKY|5616 , CYORF15B|84663 , RPS4Y1|6192 , XIST|7503 , ...
-
4 genes correlated to 'DISTANT.METASTASIS'.
-
CLDN6|9074 , CXADRP3|440224 , PRPS1|5631 , LRRC28|123355
-
6 genes correlated to 'LYMPH.NODE.METASTASIS'.
-
IHH|3549 , NPAS4|266743 , MUC6|4588 , AMY1A|276 , NXNL2|158046 , ...
-
1 gene correlated to 'NEOPLASM.DISEASESTAGE'.
-
SLC34A2|10568
Complete statistical result table is provided in Supplement Table 1
Table 1. Get Full Table This table shows the clinical features, statistical methods used, and the number of genes that are significantly associated with each clinical feature at Q value < 0.05.
| Clinical feature | Statistical test | Significant genes | Associated with | Associated with | ||
|---|---|---|---|---|---|---|
| Time to Death | Cox regression test | N=5 | shorter survival | N=0 | longer survival | N=5 |
| AGE | Spearman correlation test | N=5 | older | N=0 | younger | N=5 |
| PRIMARY SITE OF DISEASE | ANOVA test | N=55 | ||||
| GENDER | t test | N=18 | male | N=14 | female | N=4 |
| DISTANT METASTASIS | ANOVA test | N=4 | ||||
| LYMPH NODE METASTASIS | ANOVA test | N=6 | ||||
| NEOPLASM DISEASESTAGE | ANOVA test | N=1 |
Table S1. Basic characteristics of clinical feature: 'Time to Death'
| Time to Death | Duration (Months) | 0.2-357.4 (median=47.5) |
| censored | N = 81 | |
| death | N = 87 | |
| Significant markers | N = 5 | |
| associated with shorter survival | 0 | |
| associated with longer survival | 5 |
Table S2. Get Full Table List of 5 genes significantly associated with 'Time to Death' by Cox regression test
| HazardRatio | Wald_P | Q | C_index | |
|---|---|---|---|---|
| ARHGAP12|94134 | 0.62 | 4.705e-07 | 0.0085 | 0.35 |
| KCTD18|130535 | 0.45 | 7.166e-07 | 0.013 | 0.358 |
| ZNF25|219749 | 0.64 | 7.183e-07 | 0.013 | 0.345 |
| PRKAR2B|5577 | 0.72 | 9.341e-07 | 0.017 | 0.35 |
| EID1|23741 | 0.52 | 1.811e-06 | 0.033 | 0.355 |
Figure S1. Get High-res Image As an example, this figure shows the association of ARHGAP12|94134 to 'Time to Death'. four curves present the cumulative survival rates of 4 quartile subsets of patients. P value = 4.71e-07 with univariate Cox regression analysis using continuous log-2 expression values.
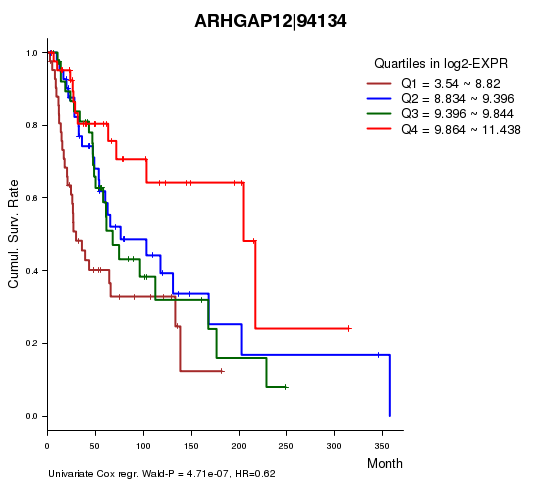
Table S3. Basic characteristics of clinical feature: 'AGE'
| AGE | Mean (SD) | 56.07 (16) |
| Significant markers | N = 5 | |
| pos. correlated | 0 | |
| neg. correlated | 5 |
Table S4. Get Full Table List of 5 genes significantly correlated to 'AGE' by Spearman correlation test
| SpearmanCorr | corrP | Q | |
|---|---|---|---|
| ACOX2|8309 | -0.414 | 2e-08 | 0.000362 |
| MCHR1|2847 | -0.3914 | 1.43e-07 | 0.00259 |
| TCEAL5|340543 | -0.3816 | 2.828e-07 | 0.00512 |
| MAOB|4129 | -0.3667 | 8.702e-07 | 0.0157 |
| PHKA1|5255 | -0.3584 | 1.6e-06 | 0.0289 |
Figure S2. Get High-res Image As an example, this figure shows the association of ACOX2|8309 to 'AGE'. P value = 2e-08 with Spearman correlation analysis. The straight line presents the best linear regression.
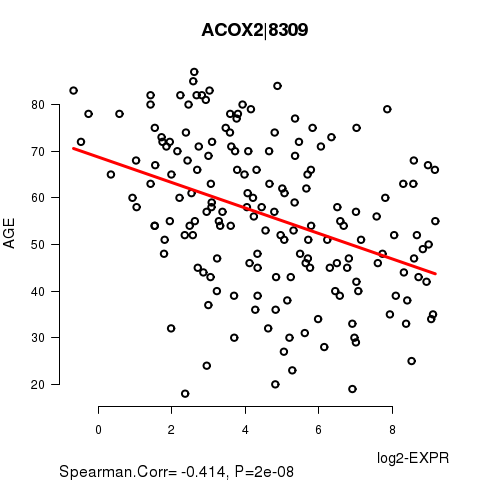
Table S5. Basic characteristics of clinical feature: 'PRIMARY.SITE.OF.DISEASE'
| PRIMARY.SITE.OF.DISEASE | Labels | N |
| DISTANT METASTASIS | 25 | |
| PRIMARY TUMOR | 1 | |
| REGIONAL CUTANEOUS OR SUBCUTANEOUS TISSUE (INCLUDES SATELLITE AND IN-TRANSIT METASTASIS) | 33 | |
| REGIONAL LYMPH NODE | 112 | |
| Significant markers | N = 55 |
Table S6. Get Full Table List of top 10 genes differentially expressed by 'PRIMARY.SITE.OF.DISEASE'
| ANOVA_P | Q | |
|---|---|---|
| TMEM156|80008 | 8.12e-10 | 1.47e-05 |
| CD38|952 | 2.456e-09 | 4.44e-05 |
| P2RY10|27334 | 7.728e-09 | 0.00014 |
| IGJ|3512 | 8.469e-09 | 0.000153 |
| POU2AF1|5450 | 2.572e-08 | 0.000465 |
| ADAM6|8755 | 4.595e-08 | 0.000831 |
| FCRL3|115352 | 6.453e-08 | 0.00117 |
| CD79A|973 | 6.921e-08 | 0.00125 |
| FCRL5|83416 | 8.919e-08 | 0.00161 |
| PRKCB|5579 | 1.015e-07 | 0.00183 |
Figure S3. Get High-res Image As an example, this figure shows the association of TMEM156|80008 to 'PRIMARY.SITE.OF.DISEASE'. P value = 8.12e-10 with ANOVA analysis.
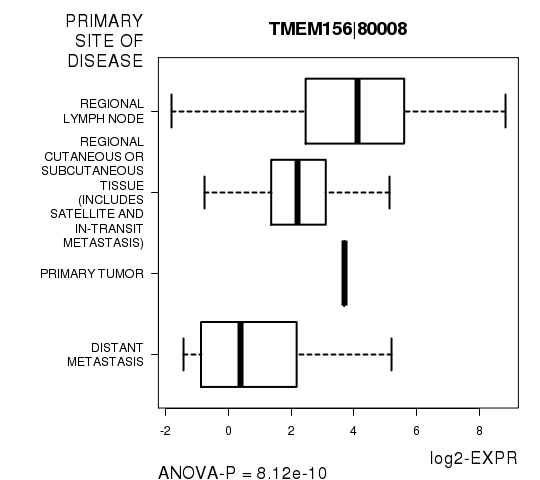
Table S7. Basic characteristics of clinical feature: 'GENDER'
| GENDER | Labels | N |
| FEMALE | 66 | |
| MALE | 105 | |
| Significant markers | N = 18 | |
| Higher in MALE | 14 | |
| Higher in FEMALE | 4 |
Table S8. Get Full Table List of top 10 genes differentially expressed by 'GENDER'
| T(pos if higher in 'MALE') | ttestP | Q | AUC | |
|---|---|---|---|---|
| ZFY|7544 | 30.42 | 9.377e-67 | 1.7e-62 | 0.9914 |
| PRKY|5616 | 26.47 | 2.425e-55 | 4.39e-51 | 0.9939 |
| CYORF15B|84663 | 33.13 | 2.911e-53 | 5.26e-49 | 1 |
| RPS4Y1|6192 | 29.46 | 5.202e-45 | 9.41e-41 | 1 |
| XIST|7503 | -19.63 | 4.961e-43 | 8.97e-39 | 0.9711 |
| DDX3Y|8653 | 30.82 | 4.889e-42 | 8.84e-38 | 0.9976 |
| KDM5D|8284 | 29.08 | 1.807e-36 | 3.27e-32 | 0.9921 |
| EIF1AY|9086 | 28.78 | 3.519e-31 | 6.36e-27 | 0.9952 |
| TSIX|9383 | -15.1 | 5.704e-30 | 1.03e-25 | 0.9701 |
| USP9Y|8287 | 25.67 | 1.282e-26 | 2.32e-22 | 0.999 |
Figure S4. Get High-res Image As an example, this figure shows the association of ZFY|7544 to 'GENDER'. P value = 9.38e-67 with T-test analysis.
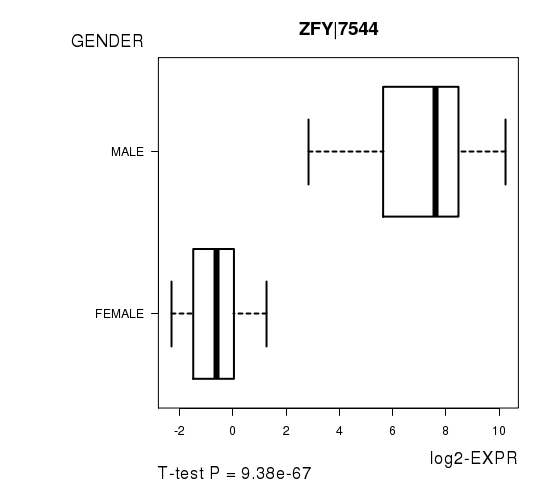
Table S9. Basic characteristics of clinical feature: 'DISTANT.METASTASIS'
| DISTANT.METASTASIS | Labels | N |
| M0 | 148 | |
| M1 | 2 | |
| M1A | 2 | |
| M1B | 2 | |
| M1C | 2 | |
| Significant markers | N = 4 |
Table S10. Get Full Table List of 4 genes differentially expressed by 'DISTANT.METASTASIS'
| ANOVA_P | Q | |
|---|---|---|
| CLDN6|9074 | 1.254e-09 | 2.27e-05 |
| CXADRP3|440224 | 4.405e-08 | 0.000796 |
| PRPS1|5631 | 1.462e-06 | 0.0264 |
| LRRC28|123355 | 2.33e-06 | 0.0421 |
Figure S5. Get High-res Image As an example, this figure shows the association of CLDN6|9074 to 'DISTANT.METASTASIS'. P value = 1.25e-09 with ANOVA analysis.
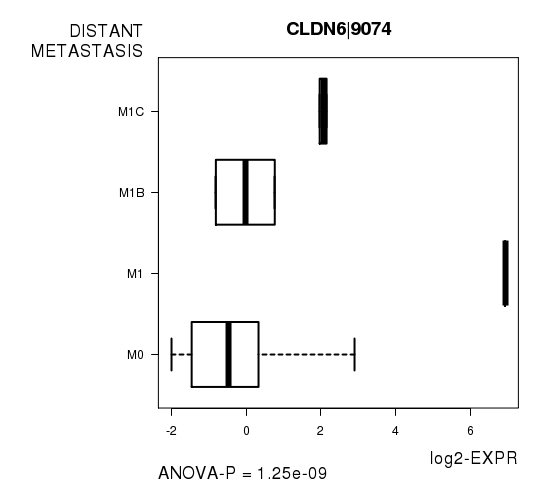
Table S11. Basic characteristics of clinical feature: 'LYMPH.NODE.METASTASIS'
| LYMPH.NODE.METASTASIS | Labels | N |
| N0 | 95 | |
| N1 | 2 | |
| N1A | 6 | |
| N1B | 16 | |
| N2 | 1 | |
| N2A | 4 | |
| N2B | 10 | |
| N2C | 5 | |
| N3 | 16 | |
| NX | 2 | |
| Significant markers | N = 6 |
Table S12. Get Full Table List of 6 genes differentially expressed by 'LYMPH.NODE.METASTASIS'
| ANOVA_P | Q | |
|---|---|---|
| IHH|3549 | 2.079e-11 | 3.76e-07 |
| NPAS4|266743 | 1.613e-07 | 0.00292 |
| MUC6|4588 | 8.804e-07 | 0.0159 |
| AMY1A|276 | 9.125e-07 | 0.0165 |
| NXNL2|158046 | 9.49e-07 | 0.0172 |
| WBSCR17|64409 | 2.149e-06 | 0.0389 |
Figure S6. Get High-res Image As an example, this figure shows the association of IHH|3549 to 'LYMPH.NODE.METASTASIS'. P value = 2.08e-11 with ANOVA analysis.

Table S13. Basic characteristics of clinical feature: 'NEOPLASM.DISEASESTAGE'
| NEOPLASM.DISEASESTAGE | Labels | N |
| I OR II NOS | 4 | |
| STAGE I | 17 | |
| STAGE IA | 10 | |
| STAGE IB | 14 | |
| STAGE II | 19 | |
| STAGE IIA | 8 | |
| STAGE IIB | 10 | |
| STAGE IIC | 8 | |
| STAGE III | 9 | |
| STAGE IIIA | 5 | |
| STAGE IIIB | 17 | |
| STAGE IIIC | 23 | |
| STAGE IV | 6 | |
| Significant markers | N = 1 |
Table S14. Get Full Table List of one gene differentially expressed by 'NEOPLASM.DISEASESTAGE'
| ANOVA_P | Q | |
|---|---|---|
| SLC34A2|10568 | 7.425e-07 | 0.0134 |
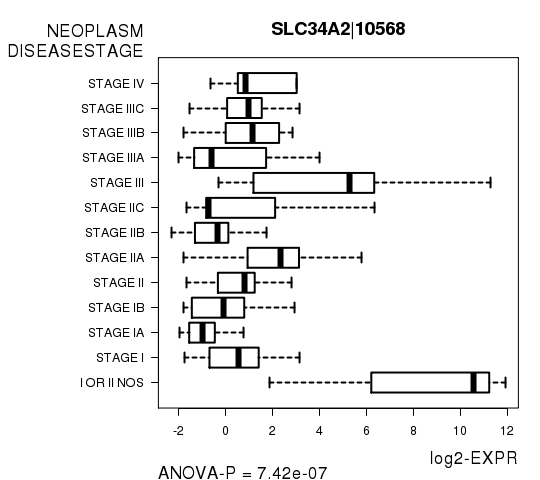
Figure S7. Get High-res Image As an example, this figure shows the association of SLC34A2|10568 to 'NEOPLASM.DISEASESTAGE'. P value = 7.42e-07 with ANOVA analysis.
-
Expresson data file = SKCM-TM.uncv2.mRNAseq_RSEM_normalized_log2.txt
-
Clinical data file = SKCM-TM.clin.merged.picked.txt
-
Number of patients = 171
-
Number of genes = 18090
-
Number of clinical features = 7
For survival clinical features, Wald's test in univariate Cox regression analysis with proportional hazards model (Andersen and Gill 1982) was used to estimate the P values using the 'coxph' function in R. Kaplan-Meier survival curves were plot using the four quartile subgroups of patients based on expression levels
For continuous numerical clinical features, Spearman's rank correlation coefficients (Spearman 1904) and two-tailed P values were estimated using 'cor.test' function in R
For multi-class clinical features (ordinal or nominal), one-way analysis of variance (Howell 2002) was applied to compare the log2-expression levels between different clinical classes using 'anova' function in R
For two-class clinical features, two-tailed Student's t test with unequal variance (Lehmann and Romano 2005) was applied to compare the log2-expression levels between the two clinical classes using 't.test' function in R
For multiple hypothesis correction, Q value is the False Discovery Rate (FDR) analogue of the P value (Benjamini and Hochberg 1995), defined as the minimum FDR at which the test may be called significant. We used the 'Benjamini and Hochberg' method of 'p.adjust' function in R to convert P values into Q values.
This is an experimental feature. The full results of the analysis summarized in this report can be downloaded from the TCGA Data Coordination Center.