This pipeline computes the correlation between significant arm-level copy number variations (cnvs) and selected clinical features.
Testing the association between copy number variation 42 arm-level results and 15 clinical features across 421 patients, 42 significant findings detected with Q value < 0.25.
-
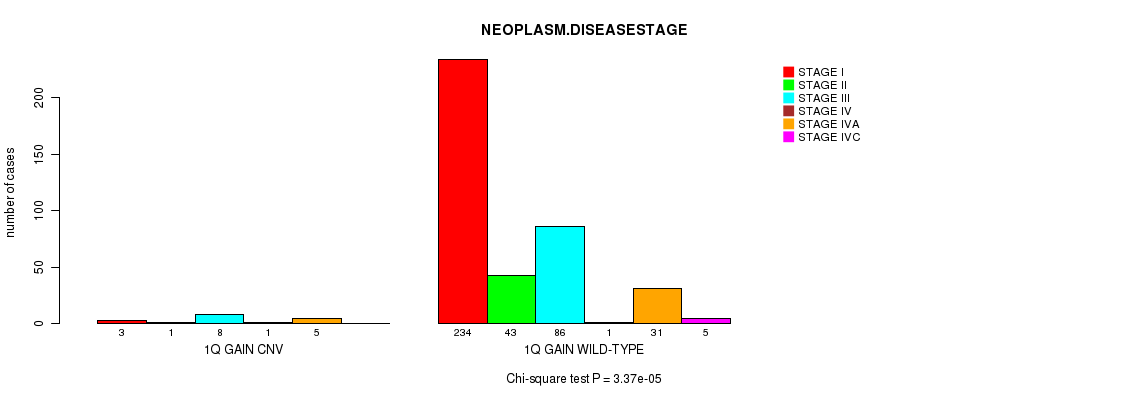
1q gain cnv correlated to 'EXTRATHYROIDAL.EXTENSION' and 'NEOPLASM.DISEASESTAGE'.
-
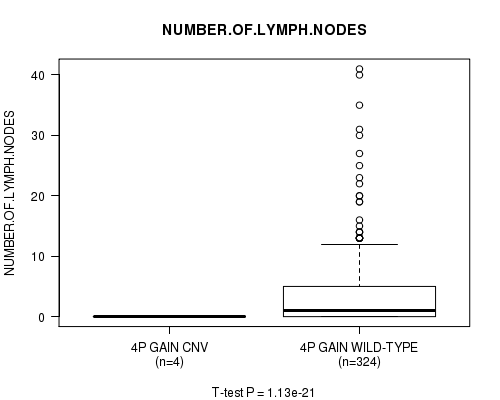
4p gain cnv correlated to 'NUMBER.OF.LYMPH.NODES'.
-
4q gain cnv correlated to 'NUMBER.OF.LYMPH.NODES'.
-
5p gain cnv correlated to 'NEOPLASM.DISEASESTAGE'.
-
5q gain cnv correlated to 'DISTANT.METASTASIS', 'NUMBER.OF.LYMPH.NODES', and 'NEOPLASM.DISEASESTAGE'.
-
7p gain cnv correlated to 'NUMBER.OF.LYMPH.NODES' and 'NEOPLASM.DISEASESTAGE'.
-
7q gain cnv correlated to 'NUMBER.OF.LYMPH.NODES' and 'NEOPLASM.DISEASESTAGE'.
-
12p gain cnv correlated to 'NUMBER.OF.LYMPH.NODES'.
-
12q gain cnv correlated to 'NUMBER.OF.LYMPH.NODES'.
-
13q gain cnv correlated to 'NUMBER.OF.LYMPH.NODES'.
-
14q gain cnv correlated to 'NUMBER.OF.LYMPH.NODES'.
-
16p gain cnv correlated to 'NUMBER.OF.LYMPH.NODES' and 'NEOPLASM.DISEASESTAGE'.
-
16q gain cnv correlated to 'NUMBER.OF.LYMPH.NODES' and 'NEOPLASM.DISEASESTAGE'.
-
17p gain cnv correlated to 'NUMBER.OF.LYMPH.NODES'.
-
17q gain cnv correlated to 'NUMBER.OF.LYMPH.NODES'.
-
19p gain cnv correlated to 'NUMBER.OF.LYMPH.NODES'.
-
19q gain cnv correlated to 'NUMBER.OF.LYMPH.NODES'.
-
20p gain cnv correlated to 'NUMBER.OF.LYMPH.NODES' and 'NEOPLASM.DISEASESTAGE'.
-
20q gain cnv correlated to 'NUMBER.OF.LYMPH.NODES' and 'NEOPLASM.DISEASESTAGE'.
-
2p loss cnv correlated to 'NUMBER.OF.LYMPH.NODES'.
-
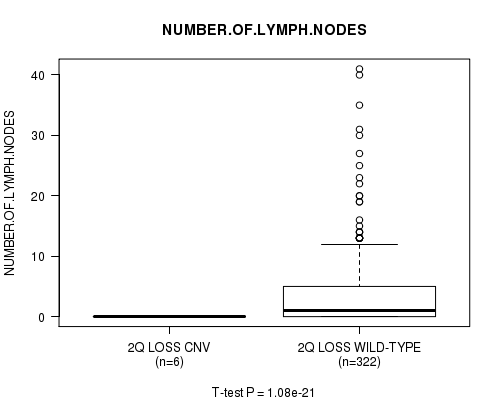
2q loss cnv correlated to 'NUMBER.OF.LYMPH.NODES'.
-
3q loss cnv correlated to 'NUMBER.OF.LYMPH.NODES'.
-
6q loss cnv correlated to 'Time to Death'.
-
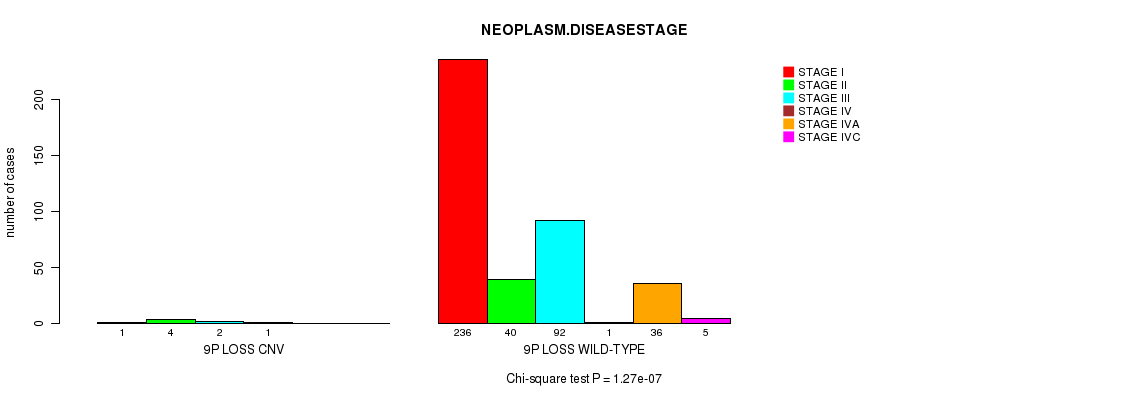
9p loss cnv correlated to 'NEOPLASM.DISEASESTAGE'.
-
9q loss cnv correlated to 'NEOPLASM.DISEASESTAGE'.
-
10p loss cnv correlated to 'NUMBER.OF.LYMPH.NODES'.
-
10q loss cnv correlated to 'NUMBER.OF.LYMPH.NODES'.
-
11p loss cnv correlated to 'AGE' and 'NEOPLASM.DISEASESTAGE'.
-
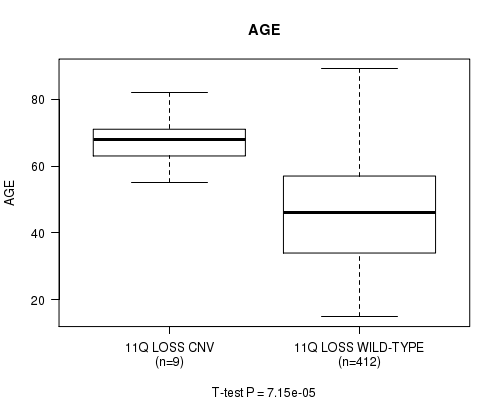
11q loss cnv correlated to 'AGE' and 'NEOPLASM.DISEASESTAGE'.
-
13q loss cnv correlated to 'NUMBER.OF.LYMPH.NODES'.
-
19p loss cnv correlated to 'Time to Death'.
Table 1. Get Full Table Overview of the association between significant copy number variation of 42 arm-level results and 15 clinical features. Shown in the table are P values (Q values). Thresholded by Q value < 0.25, 42 significant findings detected.
|
Clinical Features |
Time to Death |
AGE | GENDER |
HISTOLOGICAL TYPE |
RADIATIONS RADIATION REGIMENINDICATION |
RADIATIONEXPOSURE |
DISTANT METASTASIS |
EXTRATHYROIDAL EXTENSION |
LYMPH NODE METASTASIS |
COMPLETENESS OF RESECTION |
NUMBER OF LYMPH NODES |
TUMOR STAGECODE |
NEOPLASM DISEASESTAGE |
MULTIFOCALITY |
TUMOR SIZE |
||
| nCNV (%) | nWild-Type | logrank test | t-test | Fisher's exact test | Fisher's exact test | Fisher's exact test | Fisher's exact test | Fisher's exact test | Fisher's exact test | Chi-square test | Fisher's exact test | t-test | t-test | Chi-square test | Fisher's exact test | t-test | |
| 5q gain | 0 (0%) | 410 |
0.00139 (0.738) |
0.008 (1.00) |
1 (1.00) |
0.25 (1.00) |
0.314 (1.00) |
1 (1.00) |
0.000218 (0.117) |
0.0351 (1.00) |
0.156 (1.00) |
0.828 (1.00) |
1.04e-21 (5.98e-19) |
1.68e-05 (0.00922) |
0.224 (1.00) |
0.057 (1.00) |
|
| 1q gain | 0 (0%) | 403 |
0.0639 (1.00) |
0.00122 (0.655) |
0.416 (1.00) |
0.0941 (1.00) |
0.463 (1.00) |
1 (1.00) |
0.867 (1.00) |
4.34e-06 (0.0024) |
0.00641 (1.00) |
0.0201 (1.00) |
0.33 (1.00) |
3.37e-05 (0.0183) |
0.225 (1.00) |
0.0333 (1.00) |
|
| 7p gain | 0 (0%) | 409 |
0.132 (1.00) |
0.0191 (1.00) |
0.738 (1.00) |
0.0947 (1.00) |
1 (1.00) |
1 (1.00) |
0.00238 (1.00) |
0.0206 (1.00) |
0.12 (1.00) |
0.309 (1.00) |
1.01e-21 (5.87e-19) |
1.05e-05 (0.00577) |
0.381 (1.00) |
0.269 (1.00) |
|
| 7q gain | 0 (0%) | 407 |
0.151 (1.00) |
0.011 (1.00) |
0.533 (1.00) |
0.0565 (1.00) |
1 (1.00) |
1 (1.00) |
0.00406 (1.00) |
0.0414 (1.00) |
0.0171 (1.00) |
0.167 (1.00) |
1.01e-21 (5.87e-19) |
9.51e-05 (0.0515) |
0.413 (1.00) |
0.278 (1.00) |
|
| 16p gain | 0 (0%) | 412 |
0.0515 (1.00) |
0.139 (1.00) |
0.12 (1.00) |
0.566 (1.00) |
1 (1.00) |
1 (1.00) |
0.0909 (1.00) |
0.0343 (1.00) |
0.0603 (1.00) |
0.148 (1.00) |
1.11e-21 (6.32e-19) |
3.53e-05 (0.0192) |
1 (1.00) |
0.567 (1.00) |
|
| 16q gain | 0 (0%) | 414 |
0.0448 (1.00) |
0.0726 (1.00) |
0.199 (1.00) |
0.326 (1.00) |
1 (1.00) |
1 (1.00) |
0.0955 (1.00) |
0.0233 (1.00) |
0.24 (1.00) |
0.335 (1.00) |
1.13e-21 (6.43e-19) |
5.12e-07 (0.000284) |
0.704 (1.00) |
0.46 (1.00) |
|
| 20p gain | 0 (0%) | 414 |
0.119 (1.00) |
0.0677 (1.00) |
0.684 (1.00) |
0.125 (1.00) |
1 (1.00) |
1 (1.00) |
0.00929 (1.00) |
0.0233 (1.00) |
0.24 (1.00) |
0.718 (1.00) |
1.13e-21 (6.43e-19) |
2.98e-07 (0.000166) |
0.704 (1.00) |
0.0763 (1.00) |
|
| 20q gain | 0 (0%) | 414 |
0.119 (1.00) |
0.0677 (1.00) |
0.684 (1.00) |
0.125 (1.00) |
1 (1.00) |
1 (1.00) |
0.00929 (1.00) |
0.0233 (1.00) |
0.24 (1.00) |
0.718 (1.00) |
1.13e-21 (6.43e-19) |
2.98e-07 (0.000166) |
0.704 (1.00) |
0.0763 (1.00) |
|
| 11p loss | 0 (0%) | 414 |
0.00162 (0.858) |
0.000427 (0.23) |
0.0132 (1.00) |
0.831 (1.00) |
0.212 (1.00) |
1 (1.00) |
0.0955 (1.00) |
0.548 (1.00) |
0.584 (1.00) |
0.493 (1.00) |
0.0855 (1.00) |
1.36e-06 (0.000752) |
0.704 (1.00) |
0.0337 (1.00) |
|
| 11q loss | 0 (0%) | 412 |
0.00416 (1.00) |
7.15e-05 (0.0387) |
0.00132 (0.705) |
1 (1.00) |
0.265 (1.00) |
1 (1.00) |
0.0909 (1.00) |
0.8 (1.00) |
0.712 (1.00) |
0.603 (1.00) |
0.266 (1.00) |
2.97e-05 (0.0162) |
1 (1.00) |
0.0127 (1.00) |
|
| 4p gain | 0 (0%) | 417 |
0.0044 (1.00) |
0.123 (1.00) |
1 (1.00) |
0.479 (1.00) |
0.127 (1.00) |
1 (1.00) |
0.105 (1.00) |
1 (1.00) |
0.307 (1.00) |
0.294 (1.00) |
1.13e-21 (6.43e-19) |
0.655 (1.00) |
0.324 (1.00) |
0.587 (1.00) |
|
| 4q gain | 0 (0%) | 417 |
0.0044 (1.00) |
0.123 (1.00) |
1 (1.00) |
0.479 (1.00) |
0.127 (1.00) |
1 (1.00) |
0.105 (1.00) |
1 (1.00) |
0.307 (1.00) |
0.294 (1.00) |
1.13e-21 (6.43e-19) |
0.655 (1.00) |
0.324 (1.00) |
0.587 (1.00) |
|
| 5p gain | 0 (0%) | 409 |
0.0193 (1.00) |
0.00308 (1.00) |
1 (1.00) |
0.345 (1.00) |
0.337 (1.00) |
1 (1.00) |
0.00238 (1.00) |
0.0514 (1.00) |
0.175 (1.00) |
0.844 (1.00) |
0.0605 (1.00) |
2.58e-05 (0.0141) |
0.381 (1.00) |
0.0293 (1.00) |
|
| 12p gain | 0 (0%) | 412 |
0.623 (1.00) |
0.201 (1.00) |
0.459 (1.00) |
0.0899 (1.00) |
1 (1.00) |
1 (1.00) |
0.00137 (0.728) |
0.607 (1.00) |
0.0951 (1.00) |
0.603 (1.00) |
1.06e-21 (6.09e-19) |
0.0364 (1.00) |
0.19 (1.00) |
0.607 (1.00) |
|
| 12q gain | 0 (0%) | 411 |
0.623 (1.00) |
0.16 (1.00) |
0.463 (1.00) |
0.0339 (1.00) |
1 (1.00) |
1 (1.00) |
0.00104 (0.556) |
0.506 (1.00) |
0.03 (1.00) |
0.515 (1.00) |
1.06e-21 (6.09e-19) |
0.0741 (1.00) |
0.346 (1.00) |
0.607 (1.00) |
|
| 13q gain | 0 (0%) | 418 |
0.799 (1.00) |
0.267 (1.00) |
1 (1.00) |
0.233 (1.00) |
1 (1.00) |
1 (1.00) |
0.13 (1.00) |
1 (1.00) |
0.462 (1.00) |
1 (1.00) |
1.16e-21 (6.49e-19) |
0.047 (1.00) |
0.084 (1.00) |
0.378 (1.00) |
|
| 14q gain | 0 (0%) | 413 |
0.617 (1.00) |
0.147 (1.00) |
0.686 (1.00) |
0.214 (1.00) |
1 (1.00) |
1 (1.00) |
0.0346 (1.00) |
1 (1.00) |
0.116 (1.00) |
0.55 (1.00) |
1.11e-21 (6.32e-19) |
0.0134 (1.00) |
0.146 (1.00) |
0.387 (1.00) |
|
| 17p gain | 0 (0%) | 410 |
0.505 (1.00) |
0.245 (1.00) |
0.303 (1.00) |
0.25 (1.00) |
1 (1.00) |
1 (1.00) |
0.126 (1.00) |
0.677 (1.00) |
0.156 (1.00) |
0.555 (1.00) |
0.000126 (0.0683) |
0.00965 (1.00) |
0.546 (1.00) |
0.438 (1.00) |
|
| 17q gain | 0 (0%) | 409 |
0.505 (1.00) |
0.388 (1.00) |
0.31 (1.00) |
0.345 (1.00) |
1 (1.00) |
1 (1.00) |
0.0704 (1.00) |
0.689 (1.00) |
0.12 (1.00) |
0.592 (1.00) |
1.57e-05 (0.00863) |
0.0205 (1.00) |
0.771 (1.00) |
0.648 (1.00) |
|
| 19p gain | 0 (0%) | 417 |
0.771 (1.00) |
0.0671 (1.00) |
1 (1.00) |
0.117 (1.00) |
1 (1.00) |
1 (1.00) |
0.105 (1.00) |
1 (1.00) |
0.307 (1.00) |
0.294 (1.00) |
1.13e-21 (6.43e-19) |
0.655 (1.00) |
0.324 (1.00) |
0.305 (1.00) |
|
| 19q gain | 0 (0%) | 416 |
0.0161 (1.00) |
0.0282 (1.00) |
0.605 (1.00) |
0.178 (1.00) |
0.156 (1.00) |
1 (1.00) |
0.0282 (1.00) |
1 (1.00) |
0.197 (1.00) |
0.364 (1.00) |
1.11e-21 (6.32e-19) |
0.378 (1.00) |
0.658 (1.00) |
0.193 (1.00) |
|
| 2p loss | 0 (0%) | 414 |
0.853 (1.00) |
0.208 (1.00) |
0.684 (1.00) |
0.125 (1.00) |
1 (1.00) |
1 (1.00) |
0.0955 (1.00) |
0.308 (1.00) |
0.0752 (1.00) |
0.493 (1.00) |
1.06e-21 (6.09e-19) |
0.00524 (1.00) |
0.704 (1.00) |
0.682 (1.00) |
|
| 2q loss | 0 (0%) | 415 |
0.853 (1.00) |
0.0423 (1.00) |
1 (1.00) |
0.0614 (1.00) |
1 (1.00) |
1 (1.00) |
0.188 (1.00) |
0.344 (1.00) |
0.123 (1.00) |
0.431 (1.00) |
1.08e-21 (6.2e-19) |
0.000937 (0.503) |
0.412 (1.00) |
0.716 (1.00) |
|
| 3q loss | 0 (0%) | 418 |
0.901 (1.00) |
0.212 (1.00) |
1 (1.00) |
0.233 (1.00) |
1 (1.00) |
1 (1.00) |
0.13 (1.00) |
0.604 (1.00) |
0.462 (1.00) |
1 (1.00) |
1.16e-21 (6.49e-19) |
0.047 (1.00) |
0.584 (1.00) |
0.231 (1.00) |
|
| 6q loss | 0 (0%) | 418 |
3.21e-05 (0.0175) |
0.184 (1.00) |
1 (1.00) |
0.233 (1.00) |
1 (1.00) |
0.0828 (1.00) |
0.13 (1.00) |
0.604 (1.00) |
0.462 (1.00) |
1 (1.00) |
0.047 (1.00) |
1 (1.00) |
0.225 (1.00) |
||
| 9p loss | 0 (0%) | 413 |
0.8 (1.00) |
0.22 (1.00) |
0.425 (1.00) |
1 (1.00) |
1 (1.00) |
1 (1.00) |
0.398 (1.00) |
0.772 (1.00) |
0.83 (1.00) |
1 (1.00) |
0.336 (1.00) |
1.27e-07 (7.1e-05) |
1 (1.00) |
0.106 (1.00) |
|
| 9q loss | 0 (0%) | 409 |
0.00198 (1.00) |
0.0112 (1.00) |
0.51 (1.00) |
0.749 (1.00) |
0.337 (1.00) |
0.409 (1.00) |
0.317 (1.00) |
0.0459 (1.00) |
0.72 (1.00) |
0.483 (1.00) |
0.991 (1.00) |
6.18e-17 (3.45e-14) |
1 (1.00) |
0.0479 (1.00) |
|
| 10p loss | 0 (0%) | 416 |
0.879 (1.00) |
0.0227 (1.00) |
0.605 (1.00) |
0.585 (1.00) |
1 (1.00) |
1 (1.00) |
0.246 (1.00) |
1 (1.00) |
0.197 (1.00) |
1 (1.00) |
1.13e-21 (6.43e-19) |
0.00729 (1.00) |
0.658 (1.00) |
0.201 (1.00) |
|
| 10q loss | 0 (0%) | 417 |
0.931 (1.00) |
0.0057 (1.00) |
0.268 (1.00) |
1 (1.00) |
1 (1.00) |
1 (1.00) |
0.369 (1.00) |
1 (1.00) |
0.307 (1.00) |
1 (1.00) |
1.16e-21 (6.49e-19) |
0.074 (1.00) |
0.324 (1.00) |
0.217 (1.00) |
|
| 13q loss | 0 (0%) | 412 |
0.103 (1.00) |
0.0373 (1.00) |
0.241 (1.00) |
0.0899 (1.00) |
0.265 (1.00) |
0.00305 (1.00) |
0.0909 (1.00) |
0.607 (1.00) |
0.093 (1.00) |
0.461 (1.00) |
1.04e-21 (5.98e-19) |
0.231 (1.00) |
0.19 (1.00) |
0.642 (1.00) |
|
| 19p loss | 0 (0%) | 418 |
5.48e-06 (0.00302) |
0.0819 (1.00) |
0.16 (1.00) |
0.653 (1.00) |
1 (1.00) |
0.122 (1.00) |
0.603 (1.00) |
0.604 (1.00) |
0.471 (1.00) |
1 (1.00) |
0.0664 (1.00) |
0.259 (1.00) |
|||
| 11p gain | 0 (0%) | 417 |
0.618 (1.00) |
0.725 (1.00) |
1 (1.00) |
0.479 (1.00) |
1 (1.00) |
1 (1.00) |
0.369 (1.00) |
0.416 (1.00) |
0.453 (1.00) |
1 (1.00) |
0.655 (1.00) |
0.634 (1.00) |
0.139 (1.00) |
||
| 11q gain | 0 (0%) | 418 |
0.621 (1.00) |
0.736 (1.00) |
0.574 (1.00) |
0.653 (1.00) |
1 (1.00) |
1 (1.00) |
0.603 (1.00) |
0.604 (1.00) |
0.471 (1.00) |
1 (1.00) |
0.813 (1.00) |
0.259 (1.00) |
0.321 (1.00) |
||
| 18p gain | 0 (0%) | 418 |
0.669 (1.00) |
0.876 (1.00) |
1 (1.00) |
1 (1.00) |
1 (1.00) |
1 (1.00) |
0.603 (1.00) |
1 (1.00) |
0.471 (1.00) |
1 (1.00) |
0.813 (1.00) |
1 (1.00) |
0.327 (1.00) |
||
| 18q gain | 0 (0%) | 418 |
0.669 (1.00) |
0.876 (1.00) |
1 (1.00) |
1 (1.00) |
1 (1.00) |
1 (1.00) |
0.603 (1.00) |
1 (1.00) |
0.471 (1.00) |
1 (1.00) |
0.813 (1.00) |
1 (1.00) |
0.327 (1.00) |
||
| 1p loss | 0 (0%) | 418 |
0.901 (1.00) |
0.192 (1.00) |
0.574 (1.00) |
0.233 (1.00) |
1 (1.00) |
1 (1.00) |
0.603 (1.00) |
0.604 (1.00) |
0.462 (1.00) |
1 (1.00) |
0.047 (1.00) |
1 (1.00) |
|||
| 15q loss | 0 (0%) | 416 |
0.777 (1.00) |
0.769 (1.00) |
0.336 (1.00) |
0.0194 (1.00) |
1 (1.00) |
1 (1.00) |
0.0443 (1.00) |
1 (1.00) |
0.484 (1.00) |
1 (1.00) |
0.579 (1.00) |
0.0191 (1.00) |
1 (1.00) |
0.407 (1.00) |
|
| 17p loss | 0 (0%) | 417 |
0.696 (1.00) |
0.556 (1.00) |
0.576 (1.00) |
0.479 (1.00) |
0.00594 (1.00) |
1 (1.00) |
0.369 (1.00) |
0.139 (1.00) |
0.539 (1.00) |
1 (1.00) |
0.379 (1.00) |
0.112 (1.00) |
0.634 (1.00) |
0.277 (1.00) |
|
| 18p loss | 0 (0%) | 418 |
0.879 (1.00) |
0.939 (1.00) |
0.574 (1.00) |
0.653 (1.00) |
1 (1.00) |
1 (1.00) |
0.603 (1.00) |
0.604 (1.00) |
0.797 (1.00) |
1 (1.00) |
0.0277 (1.00) |
0.0664 (1.00) |
1 (1.00) |
0.389 (1.00) |
|
| 18q loss | 0 (0%) | 418 |
0.879 (1.00) |
0.939 (1.00) |
0.574 (1.00) |
0.653 (1.00) |
1 (1.00) |
1 (1.00) |
0.603 (1.00) |
0.604 (1.00) |
0.797 (1.00) |
1 (1.00) |
0.0277 (1.00) |
0.0664 (1.00) |
1 (1.00) |
0.389 (1.00) |
|
| 21q loss | 0 (0%) | 415 |
0.892 (1.00) |
0.00855 (1.00) |
0.647 (1.00) |
0.794 (1.00) |
1 (1.00) |
1 (1.00) |
0.474 (1.00) |
0.344 (1.00) |
0.647 (1.00) |
0.662 (1.00) |
0.994 (1.00) |
0.0204 (1.00) |
0.091 (1.00) |
0.985 (1.00) |
|
| 22q loss | 0 (0%) | 367 |
0.339 (1.00) |
0.146 (1.00) |
0.738 (1.00) |
0.0216 (1.00) |
0.232 (1.00) |
0.708 (1.00) |
0.397 (1.00) |
0.175 (1.00) |
0.252 (1.00) |
0.899 (1.00) |
0.201 (1.00) |
0.281 (1.00) |
0.378 (1.00) |
0.783 (1.00) |
P value = 4.34e-06 (Fisher's exact test), Q value = 0.0024
Table S1. Gene #1: '1q gain' versus Clinical Feature #8: 'EXTRATHYROIDAL.EXTENSION'
| nPatients | MINIMAL (T3) | MODERATE/ADVANCED (T4A) | NONE | VERY ADVANCED (T4B) |
|---|---|---|---|---|
| ALL | 113 | 13 | 275 | 1 |
| 1Q GAIN CNV | 10 | 3 | 4 | 1 |
| 1Q GAIN WILD-TYPE | 103 | 10 | 271 | 0 |
Figure S1. Get High-res Image Gene #1: '1q gain' versus Clinical Feature #8: 'EXTRATHYROIDAL.EXTENSION'

P value = 3.37e-05 (Chi-square test), Q value = 0.018
Table S2. Gene #1: '1q gain' versus Clinical Feature #13: 'NEOPLASM.DISEASESTAGE'
| nPatients | STAGE I | STAGE II | STAGE III | STAGE IV | STAGE IVA | STAGE IVC |
|---|---|---|---|---|---|---|
| ALL | 237 | 44 | 94 | 2 | 36 | 5 |
| 1Q GAIN CNV | 3 | 1 | 8 | 1 | 5 | 0 |
| 1Q GAIN WILD-TYPE | 234 | 43 | 86 | 1 | 31 | 5 |
Figure S2. Get High-res Image Gene #1: '1q gain' versus Clinical Feature #13: 'NEOPLASM.DISEASESTAGE'
P value = 1.13e-21 (t-test), Q value = 6.4e-19
Table S3. Gene #2: '4p gain' versus Clinical Feature #11: 'NUMBER.OF.LYMPH.NODES'
| nPatients | Mean (Std.Dev) | |
|---|---|---|
| ALL | 328 | 3.5 (6.2) |
| 4P GAIN CNV | 4 | 0.0 (0.0) |
| 4P GAIN WILD-TYPE | 324 | 3.6 (6.2) |
Figure S3. Get High-res Image Gene #2: '4p gain' versus Clinical Feature #11: 'NUMBER.OF.LYMPH.NODES'
P value = 1.13e-21 (t-test), Q value = 6.4e-19
Table S4. Gene #3: '4q gain' versus Clinical Feature #11: 'NUMBER.OF.LYMPH.NODES'
| nPatients | Mean (Std.Dev) | |
|---|---|---|
| ALL | 328 | 3.5 (6.2) |
| 4Q GAIN CNV | 4 | 0.0 (0.0) |
| 4Q GAIN WILD-TYPE | 324 | 3.6 (6.2) |
Figure S4. Get High-res Image Gene #3: '4q gain' versus Clinical Feature #11: 'NUMBER.OF.LYMPH.NODES'

P value = 2.58e-05 (Chi-square test), Q value = 0.014
Table S5. Gene #4: '5p gain' versus Clinical Feature #13: 'NEOPLASM.DISEASESTAGE'
| nPatients | STAGE I | STAGE II | STAGE III | STAGE IV | STAGE IVA | STAGE IVC |
|---|---|---|---|---|---|---|
| ALL | 237 | 44 | 94 | 2 | 36 | 5 |
| 5P GAIN CNV | 2 | 4 | 5 | 1 | 0 | 0 |
| 5P GAIN WILD-TYPE | 235 | 40 | 89 | 1 | 36 | 5 |
Figure S5. Get High-res Image Gene #4: '5p gain' versus Clinical Feature #13: 'NEOPLASM.DISEASESTAGE'

P value = 0.000218 (Fisher's exact test), Q value = 0.12
Table S6. Gene #5: '5q gain' versus Clinical Feature #7: 'DISTANT.METASTASIS'
| nPatients | M0 | M1 | MX |
|---|---|---|---|
| ALL | 235 | 8 | 177 |
| 5Q GAIN CNV | 0 | 0 | 11 |
| 5Q GAIN WILD-TYPE | 235 | 8 | 166 |
Figure S6. Get High-res Image Gene #5: '5q gain' versus Clinical Feature #7: 'DISTANT.METASTASIS'

P value = 1.04e-21 (t-test), Q value = 6e-19
Table S7. Gene #5: '5q gain' versus Clinical Feature #11: 'NUMBER.OF.LYMPH.NODES'
| nPatients | Mean (Std.Dev) | |
|---|---|---|
| ALL | 328 | 3.5 (6.2) |
| 5Q GAIN CNV | 8 | 0.0 (0.0) |
| 5Q GAIN WILD-TYPE | 320 | 3.6 (6.3) |
Figure S7. Get High-res Image Gene #5: '5q gain' versus Clinical Feature #11: 'NUMBER.OF.LYMPH.NODES'

P value = 1.68e-05 (Chi-square test), Q value = 0.0092
Table S8. Gene #5: '5q gain' versus Clinical Feature #13: 'NEOPLASM.DISEASESTAGE'
| nPatients | STAGE I | STAGE II | STAGE III | STAGE IV | STAGE IVA | STAGE IVC |
|---|---|---|---|---|---|---|
| ALL | 237 | 44 | 94 | 2 | 36 | 5 |
| 5Q GAIN CNV | 2 | 4 | 4 | 1 | 0 | 0 |
| 5Q GAIN WILD-TYPE | 235 | 40 | 90 | 1 | 36 | 5 |
Figure S8. Get High-res Image Gene #5: '5q gain' versus Clinical Feature #13: 'NEOPLASM.DISEASESTAGE'

P value = 1.01e-21 (t-test), Q value = 5.9e-19
Table S9. Gene #6: '7p gain' versus Clinical Feature #11: 'NUMBER.OF.LYMPH.NODES'
| nPatients | Mean (Std.Dev) | |
|---|---|---|
| ALL | 328 | 3.5 (6.2) |
| 7P GAIN CNV | 9 | 0.0 (0.0) |
| 7P GAIN WILD-TYPE | 319 | 3.6 (6.3) |
Figure S9. Get High-res Image Gene #6: '7p gain' versus Clinical Feature #11: 'NUMBER.OF.LYMPH.NODES'

P value = 1.05e-05 (Chi-square test), Q value = 0.0058
Table S10. Gene #6: '7p gain' versus Clinical Feature #13: 'NEOPLASM.DISEASESTAGE'
| nPatients | STAGE I | STAGE II | STAGE III | STAGE IV | STAGE IVA | STAGE IVC |
|---|---|---|---|---|---|---|
| ALL | 237 | 44 | 94 | 2 | 36 | 5 |
| 7P GAIN CNV | 3 | 5 | 3 | 1 | 0 | 0 |
| 7P GAIN WILD-TYPE | 234 | 39 | 91 | 1 | 36 | 5 |
Figure S10. Get High-res Image Gene #6: '7p gain' versus Clinical Feature #13: 'NEOPLASM.DISEASESTAGE'

P value = 1.01e-21 (t-test), Q value = 5.9e-19
Table S11. Gene #7: '7q gain' versus Clinical Feature #11: 'NUMBER.OF.LYMPH.NODES'
| nPatients | Mean (Std.Dev) | |
|---|---|---|
| ALL | 328 | 3.5 (6.2) |
| 7Q GAIN CNV | 9 | 0.0 (0.0) |
| 7Q GAIN WILD-TYPE | 319 | 3.6 (6.3) |
Figure S11. Get High-res Image Gene #7: '7q gain' versus Clinical Feature #11: 'NUMBER.OF.LYMPH.NODES'

P value = 9.51e-05 (Chi-square test), Q value = 0.051
Table S12. Gene #7: '7q gain' versus Clinical Feature #13: 'NEOPLASM.DISEASESTAGE'
| nPatients | STAGE I | STAGE II | STAGE III | STAGE IV | STAGE IVA | STAGE IVC |
|---|---|---|---|---|---|---|
| ALL | 237 | 44 | 94 | 2 | 36 | 5 |
| 7Q GAIN CNV | 4 | 5 | 4 | 1 | 0 | 0 |
| 7Q GAIN WILD-TYPE | 233 | 39 | 90 | 1 | 36 | 5 |
Figure S12. Get High-res Image Gene #7: '7q gain' versus Clinical Feature #13: 'NEOPLASM.DISEASESTAGE'

P value = 1.06e-21 (t-test), Q value = 6.1e-19
Table S13. Gene #10: '12p gain' versus Clinical Feature #11: 'NUMBER.OF.LYMPH.NODES'
| nPatients | Mean (Std.Dev) | |
|---|---|---|
| ALL | 328 | 3.5 (6.2) |
| 12P GAIN CNV | 7 | 0.0 (0.0) |
| 12P GAIN WILD-TYPE | 321 | 3.6 (6.2) |
Figure S13. Get High-res Image Gene #10: '12p gain' versus Clinical Feature #11: 'NUMBER.OF.LYMPH.NODES'

P value = 1.06e-21 (t-test), Q value = 6.1e-19
Table S14. Gene #11: '12q gain' versus Clinical Feature #11: 'NUMBER.OF.LYMPH.NODES'
| nPatients | Mean (Std.Dev) | |
|---|---|---|
| ALL | 328 | 3.5 (6.2) |
| 12Q GAIN CNV | 7 | 0.0 (0.0) |
| 12Q GAIN WILD-TYPE | 321 | 3.6 (6.2) |
Figure S14. Get High-res Image Gene #11: '12q gain' versus Clinical Feature #11: 'NUMBER.OF.LYMPH.NODES'

P value = 1.16e-21 (t-test), Q value = 6.5e-19
Table S15. Gene #12: '13q gain' versus Clinical Feature #11: 'NUMBER.OF.LYMPH.NODES'
| nPatients | Mean (Std.Dev) | |
|---|---|---|
| ALL | 328 | 3.5 (6.2) |
| 13Q GAIN CNV | 3 | 0.0 (0.0) |
| 13Q GAIN WILD-TYPE | 325 | 3.6 (6.2) |
Figure S15. Get High-res Image Gene #12: '13q gain' versus Clinical Feature #11: 'NUMBER.OF.LYMPH.NODES'

P value = 1.11e-21 (t-test), Q value = 6.3e-19
Table S16. Gene #13: '14q gain' versus Clinical Feature #11: 'NUMBER.OF.LYMPH.NODES'
| nPatients | Mean (Std.Dev) | |
|---|---|---|
| ALL | 328 | 3.5 (6.2) |
| 14Q GAIN CNV | 5 | 0.0 (0.0) |
| 14Q GAIN WILD-TYPE | 323 | 3.6 (6.2) |
Figure S16. Get High-res Image Gene #13: '14q gain' versus Clinical Feature #11: 'NUMBER.OF.LYMPH.NODES'

P value = 1.11e-21 (t-test), Q value = 6.3e-19
Table S17. Gene #14: '16p gain' versus Clinical Feature #11: 'NUMBER.OF.LYMPH.NODES'
| nPatients | Mean (Std.Dev) | |
|---|---|---|
| ALL | 328 | 3.5 (6.2) |
| 16P GAIN CNV | 5 | 0.0 (0.0) |
| 16P GAIN WILD-TYPE | 323 | 3.6 (6.2) |
Figure S17. Get High-res Image Gene #14: '16p gain' versus Clinical Feature #11: 'NUMBER.OF.LYMPH.NODES'

P value = 3.53e-05 (Chi-square test), Q value = 0.019
Table S18. Gene #14: '16p gain' versus Clinical Feature #13: 'NEOPLASM.DISEASESTAGE'
| nPatients | STAGE I | STAGE II | STAGE III | STAGE IV | STAGE IVA | STAGE IVC |
|---|---|---|---|---|---|---|
| ALL | 237 | 44 | 94 | 2 | 36 | 5 |
| 16P GAIN CNV | 3 | 3 | 2 | 1 | 0 | 0 |
| 16P GAIN WILD-TYPE | 234 | 41 | 92 | 1 | 36 | 5 |
Figure S18. Get High-res Image Gene #14: '16p gain' versus Clinical Feature #13: 'NEOPLASM.DISEASESTAGE'

P value = 1.13e-21 (t-test), Q value = 6.4e-19
Table S19. Gene #15: '16q gain' versus Clinical Feature #11: 'NUMBER.OF.LYMPH.NODES'
| nPatients | Mean (Std.Dev) | |
|---|---|---|
| ALL | 328 | 3.5 (6.2) |
| 16Q GAIN CNV | 4 | 0.0 (0.0) |
| 16Q GAIN WILD-TYPE | 324 | 3.6 (6.2) |
Figure S19. Get High-res Image Gene #15: '16q gain' versus Clinical Feature #11: 'NUMBER.OF.LYMPH.NODES'

P value = 5.12e-07 (Chi-square test), Q value = 0.00028
Table S20. Gene #15: '16q gain' versus Clinical Feature #13: 'NEOPLASM.DISEASESTAGE'
| nPatients | STAGE I | STAGE II | STAGE III | STAGE IV | STAGE IVA | STAGE IVC |
|---|---|---|---|---|---|---|
| ALL | 237 | 44 | 94 | 2 | 36 | 5 |
| 16Q GAIN CNV | 2 | 3 | 1 | 1 | 0 | 0 |
| 16Q GAIN WILD-TYPE | 235 | 41 | 93 | 1 | 36 | 5 |
Figure S20. Get High-res Image Gene #15: '16q gain' versus Clinical Feature #13: 'NEOPLASM.DISEASESTAGE'

P value = 0.000126 (t-test), Q value = 0.068
Table S21. Gene #16: '17p gain' versus Clinical Feature #11: 'NUMBER.OF.LYMPH.NODES'
| nPatients | Mean (Std.Dev) | |
|---|---|---|
| ALL | 328 | 3.5 (6.2) |
| 17P GAIN CNV | 8 | 0.5 (1.4) |
| 17P GAIN WILD-TYPE | 320 | 3.6 (6.3) |
Figure S21. Get High-res Image Gene #16: '17p gain' versus Clinical Feature #11: 'NUMBER.OF.LYMPH.NODES'

P value = 1.57e-05 (t-test), Q value = 0.0086
Table S22. Gene #17: '17q gain' versus Clinical Feature #11: 'NUMBER.OF.LYMPH.NODES'
| nPatients | Mean (Std.Dev) | |
|---|---|---|
| ALL | 328 | 3.5 (6.2) |
| 17Q GAIN CNV | 9 | 0.4 (1.3) |
| 17Q GAIN WILD-TYPE | 319 | 3.6 (6.3) |
Figure S22. Get High-res Image Gene #17: '17q gain' versus Clinical Feature #11: 'NUMBER.OF.LYMPH.NODES'

P value = 1.13e-21 (t-test), Q value = 6.4e-19
Table S23. Gene #20: '19p gain' versus Clinical Feature #11: 'NUMBER.OF.LYMPH.NODES'
| nPatients | Mean (Std.Dev) | |
|---|---|---|
| ALL | 328 | 3.5 (6.2) |
| 19P GAIN CNV | 4 | 0.0 (0.0) |
| 19P GAIN WILD-TYPE | 324 | 3.6 (6.2) |
Figure S23. Get High-res Image Gene #20: '19p gain' versus Clinical Feature #11: 'NUMBER.OF.LYMPH.NODES'

P value = 1.11e-21 (t-test), Q value = 6.3e-19
Table S24. Gene #21: '19q gain' versus Clinical Feature #11: 'NUMBER.OF.LYMPH.NODES'
| nPatients | Mean (Std.Dev) | |
|---|---|---|
| ALL | 328 | 3.5 (6.2) |
| 19Q GAIN CNV | 5 | 0.0 (0.0) |
| 19Q GAIN WILD-TYPE | 323 | 3.6 (6.2) |
Figure S24. Get High-res Image Gene #21: '19q gain' versus Clinical Feature #11: 'NUMBER.OF.LYMPH.NODES'

P value = 1.13e-21 (t-test), Q value = 6.4e-19
Table S25. Gene #22: '20p gain' versus Clinical Feature #11: 'NUMBER.OF.LYMPH.NODES'
| nPatients | Mean (Std.Dev) | |
|---|---|---|
| ALL | 328 | 3.5 (6.2) |
| 20P GAIN CNV | 4 | 0.0 (0.0) |
| 20P GAIN WILD-TYPE | 324 | 3.6 (6.2) |
Figure S25. Get High-res Image Gene #22: '20p gain' versus Clinical Feature #11: 'NUMBER.OF.LYMPH.NODES'

P value = 2.98e-07 (Chi-square test), Q value = 0.00017
Table S26. Gene #22: '20p gain' versus Clinical Feature #13: 'NEOPLASM.DISEASESTAGE'
| nPatients | STAGE I | STAGE II | STAGE III | STAGE IV | STAGE IVA | STAGE IVC |
|---|---|---|---|---|---|---|
| ALL | 237 | 44 | 94 | 2 | 36 | 5 |
| 20P GAIN CNV | 1 | 3 | 2 | 1 | 0 | 0 |
| 20P GAIN WILD-TYPE | 236 | 41 | 92 | 1 | 36 | 5 |
Figure S26. Get High-res Image Gene #22: '20p gain' versus Clinical Feature #13: 'NEOPLASM.DISEASESTAGE'

P value = 1.13e-21 (t-test), Q value = 6.4e-19
Table S27. Gene #23: '20q gain' versus Clinical Feature #11: 'NUMBER.OF.LYMPH.NODES'
| nPatients | Mean (Std.Dev) | |
|---|---|---|
| ALL | 328 | 3.5 (6.2) |
| 20Q GAIN CNV | 4 | 0.0 (0.0) |
| 20Q GAIN WILD-TYPE | 324 | 3.6 (6.2) |
Figure S27. Get High-res Image Gene #23: '20q gain' versus Clinical Feature #11: 'NUMBER.OF.LYMPH.NODES'

P value = 2.98e-07 (Chi-square test), Q value = 0.00017
Table S28. Gene #23: '20q gain' versus Clinical Feature #13: 'NEOPLASM.DISEASESTAGE'
| nPatients | STAGE I | STAGE II | STAGE III | STAGE IV | STAGE IVA | STAGE IVC |
|---|---|---|---|---|---|---|
| ALL | 237 | 44 | 94 | 2 | 36 | 5 |
| 20Q GAIN CNV | 1 | 3 | 2 | 1 | 0 | 0 |
| 20Q GAIN WILD-TYPE | 236 | 41 | 92 | 1 | 36 | 5 |
Figure S28. Get High-res Image Gene #23: '20q gain' versus Clinical Feature #13: 'NEOPLASM.DISEASESTAGE'

P value = 1.06e-21 (t-test), Q value = 6.1e-19
Table S29. Gene #25: '2p loss' versus Clinical Feature #11: 'NUMBER.OF.LYMPH.NODES'
| nPatients | Mean (Std.Dev) | |
|---|---|---|
| ALL | 328 | 3.5 (6.2) |
| 2P LOSS CNV | 7 | 0.0 (0.0) |
| 2P LOSS WILD-TYPE | 321 | 3.6 (6.2) |
Figure S29. Get High-res Image Gene #25: '2p loss' versus Clinical Feature #11: 'NUMBER.OF.LYMPH.NODES'

P value = 1.08e-21 (t-test), Q value = 6.2e-19
Table S30. Gene #26: '2q loss' versus Clinical Feature #11: 'NUMBER.OF.LYMPH.NODES'
| nPatients | Mean (Std.Dev) | |
|---|---|---|
| ALL | 328 | 3.5 (6.2) |
| 2Q LOSS CNV | 6 | 0.0 (0.0) |
| 2Q LOSS WILD-TYPE | 322 | 3.6 (6.2) |
Figure S30. Get High-res Image Gene #26: '2q loss' versus Clinical Feature #11: 'NUMBER.OF.LYMPH.NODES'
P value = 1.16e-21 (t-test), Q value = 6.5e-19
Table S31. Gene #27: '3q loss' versus Clinical Feature #11: 'NUMBER.OF.LYMPH.NODES'
| nPatients | Mean (Std.Dev) | |
|---|---|---|
| ALL | 328 | 3.5 (6.2) |
| 3Q LOSS CNV | 3 | 0.0 (0.0) |
| 3Q LOSS WILD-TYPE | 325 | 3.6 (6.2) |
Figure S31. Get High-res Image Gene #27: '3q loss' versus Clinical Feature #11: 'NUMBER.OF.LYMPH.NODES'

P value = 3.21e-05 (logrank test), Q value = 0.017
Table S32. Gene #28: '6q loss' versus Clinical Feature #1: 'Time to Death'
| nPatients | nDeath | Duration Range (Median), Month | |
|---|---|---|---|
| ALL | 416 | 10 | 0.0 - 147.4 (9.3) |
| 6Q LOSS CNV | 3 | 1 | 1.6 - 33.5 (21.4) |
| 6Q LOSS WILD-TYPE | 413 | 9 | 0.0 - 147.4 (9.3) |
Figure S32. Get High-res Image Gene #28: '6q loss' versus Clinical Feature #1: 'Time to Death'

P value = 1.27e-07 (Chi-square test), Q value = 7.1e-05
Table S33. Gene #29: '9p loss' versus Clinical Feature #13: 'NEOPLASM.DISEASESTAGE'
| nPatients | STAGE I | STAGE II | STAGE III | STAGE IV | STAGE IVA | STAGE IVC |
|---|---|---|---|---|---|---|
| ALL | 237 | 44 | 94 | 2 | 36 | 5 |
| 9P LOSS CNV | 1 | 4 | 2 | 1 | 0 | 0 |
| 9P LOSS WILD-TYPE | 236 | 40 | 92 | 1 | 36 | 5 |
Figure S33. Get High-res Image Gene #29: '9p loss' versus Clinical Feature #13: 'NEOPLASM.DISEASESTAGE'
P value = 6.18e-17 (Chi-square test), Q value = 3.4e-14
Table S34. Gene #30: '9q loss' versus Clinical Feature #13: 'NEOPLASM.DISEASESTAGE'
| nPatients | STAGE I | STAGE II | STAGE III | STAGE IV | STAGE IVA | STAGE IVC |
|---|---|---|---|---|---|---|
| ALL | 237 | 44 | 94 | 2 | 36 | 5 |
| 9Q LOSS CNV | 1 | 5 | 2 | 2 | 2 | 0 |
| 9Q LOSS WILD-TYPE | 236 | 39 | 92 | 0 | 34 | 5 |
Figure S34. Get High-res Image Gene #30: '9q loss' versus Clinical Feature #13: 'NEOPLASM.DISEASESTAGE'

P value = 1.13e-21 (t-test), Q value = 6.4e-19
Table S35. Gene #31: '10p loss' versus Clinical Feature #11: 'NUMBER.OF.LYMPH.NODES'
| nPatients | Mean (Std.Dev) | |
|---|---|---|
| ALL | 328 | 3.5 (6.2) |
| 10P LOSS CNV | 4 | 0.0 (0.0) |
| 10P LOSS WILD-TYPE | 324 | 3.6 (6.2) |
Figure S35. Get High-res Image Gene #31: '10p loss' versus Clinical Feature #11: 'NUMBER.OF.LYMPH.NODES'

P value = 1.16e-21 (t-test), Q value = 6.5e-19
Table S36. Gene #32: '10q loss' versus Clinical Feature #11: 'NUMBER.OF.LYMPH.NODES'
| nPatients | Mean (Std.Dev) | |
|---|---|---|
| ALL | 328 | 3.5 (6.2) |
| 10Q LOSS CNV | 3 | 0.0 (0.0) |
| 10Q LOSS WILD-TYPE | 325 | 3.6 (6.2) |
Figure S36. Get High-res Image Gene #32: '10q loss' versus Clinical Feature #11: 'NUMBER.OF.LYMPH.NODES'

P value = 0.000427 (t-test), Q value = 0.23
Table S37. Gene #33: '11p loss' versus Clinical Feature #2: 'AGE'
| nPatients | Mean (Std.Dev) | |
|---|---|---|
| ALL | 421 | 46.6 (15.6) |
| 11P LOSS CNV | 7 | 68.1 (8.7) |
| 11P LOSS WILD-TYPE | 414 | 46.2 (15.4) |
Figure S37. Get High-res Image Gene #33: '11p loss' versus Clinical Feature #2: 'AGE'

P value = 1.36e-06 (Chi-square test), Q value = 0.00075
Table S38. Gene #33: '11p loss' versus Clinical Feature #13: 'NEOPLASM.DISEASESTAGE'
| nPatients | STAGE I | STAGE II | STAGE III | STAGE IV | STAGE IVA | STAGE IVC |
|---|---|---|---|---|---|---|
| ALL | 237 | 44 | 94 | 2 | 36 | 5 |
| 11P LOSS CNV | 1 | 1 | 4 | 1 | 0 | 0 |
| 11P LOSS WILD-TYPE | 236 | 43 | 90 | 1 | 36 | 5 |
Figure S38. Get High-res Image Gene #33: '11p loss' versus Clinical Feature #13: 'NEOPLASM.DISEASESTAGE'

P value = 7.15e-05 (t-test), Q value = 0.039
Table S39. Gene #34: '11q loss' versus Clinical Feature #2: 'AGE'
| nPatients | Mean (Std.Dev) | |
|---|---|---|
| ALL | 421 | 46.6 (15.6) |
| 11Q LOSS CNV | 9 | 67.0 (8.9) |
| 11Q LOSS WILD-TYPE | 412 | 46.1 (15.4) |
Figure S39. Get High-res Image Gene #34: '11q loss' versus Clinical Feature #2: 'AGE'
P value = 2.97e-05 (Chi-square test), Q value = 0.016
Table S40. Gene #34: '11q loss' versus Clinical Feature #13: 'NEOPLASM.DISEASESTAGE'
| nPatients | STAGE I | STAGE II | STAGE III | STAGE IV | STAGE IVA | STAGE IVC |
|---|---|---|---|---|---|---|
| ALL | 237 | 44 | 94 | 2 | 36 | 5 |
| 11Q LOSS CNV | 1 | 2 | 4 | 1 | 1 | 0 |
| 11Q LOSS WILD-TYPE | 236 | 42 | 90 | 1 | 35 | 5 |
Figure S40. Get High-res Image Gene #34: '11q loss' versus Clinical Feature #13: 'NEOPLASM.DISEASESTAGE'

P value = 1.04e-21 (t-test), Q value = 6e-19
Table S41. Gene #35: '13q loss' versus Clinical Feature #11: 'NUMBER.OF.LYMPH.NODES'
| nPatients | Mean (Std.Dev) | |
|---|---|---|
| ALL | 328 | 3.5 (6.2) |
| 13Q LOSS CNV | 8 | 0.0 (0.0) |
| 13Q LOSS WILD-TYPE | 320 | 3.6 (6.3) |
Figure S41. Get High-res Image Gene #35: '13q loss' versus Clinical Feature #11: 'NUMBER.OF.LYMPH.NODES'

P value = 5.48e-06 (logrank test), Q value = 0.003
Table S42. Gene #40: '19p loss' versus Clinical Feature #1: 'Time to Death'
| nPatients | nDeath | Duration Range (Median), Month | |
|---|---|---|---|
| ALL | 416 | 10 | 0.0 - 147.4 (9.3) |
| 19P LOSS CNV | 3 | 1 | 0.9 - 33.5 (15.8) |
| 19P LOSS WILD-TYPE | 413 | 9 | 0.0 - 147.4 (9.3) |
Figure S42. Get High-res Image Gene #40: '19p loss' versus Clinical Feature #1: 'Time to Death'

-
Mutation data file = broad_values_by_arm.mutsig.cluster.txt
-
Clinical data file = THCA-TP.clin.merged.picked.txt
-
Number of patients = 421
-
Number of significantly arm-level cnvs = 42
-
Number of selected clinical features = 15
-
Exclude genes that fewer than K tumors have mutations, K = 3
For survival clinical features, the Kaplan-Meier survival curves of tumors with and without gene mutations were plotted and the statistical significance P values were estimated by logrank test (Bland and Altman 2004) using the 'survdiff' function in R
For continuous numerical clinical features, two-tailed Student's t test with unequal variance (Lehmann and Romano 2005) was applied to compare the clinical values between tumors with and without gene mutations using 't.test' function in R
For binary or multi-class clinical features (nominal or ordinal), two-tailed Fisher's exact tests (Fisher 1922) were used to estimate the P values using the 'fisher.test' function in R
For multi-class clinical features (nominal or ordinal), Chi-square tests (Greenwood and Nikulin 1996) were used to estimate the P values using the 'chisq.test' function in R
For multiple hypothesis correction, Q value is the False Discovery Rate (FDR) analogue of the P value (Benjamini and Hochberg 1995), defined as the minimum FDR at which the test may be called significant. We used the 'Benjamini and Hochberg' method of 'p.adjust' function in R to convert P values into Q values.
This is an experimental feature. The full results of the analysis summarized in this report can be downloaded from the TCGA Data Coordination Center.