This report serves to describe the mutational landscape and properties of a given individual set, as well as rank genes and genesets according to mutational significance. MutSig v2.0 and MutSigCV v0.9 merged result was used to generate the results found in this report.
-
Working with individual set: UCEC-TP
-
Number of patients in set: 248
The input for this pipeline is a set of individuals with the following files associated for each:
-
An annotated .maf file describing the mutations called for the respective individual, and their properties.
-
A .wig file that contains information about the coverage of the sample.
-
MAF used for this analysis:UCEC-TP.final_analysis_set.maf
-
Significantly mutated genes (q ≤ 0.1): 29
-
Mutations seen in COSMIC: 1001
-
Significantly mutated genes in COSMIC territory: 46
-
Significantly mutated genesets: 68
-
Read 248 MAFs of type "WashU"
-
Total number of mutations in input MAFs: 184861
-
After removing 118 mutations outside chr1-24: 184743
-
After removing 211 blacklisted mutations: 184532
-
After removing 1932 noncoding mutations: 182600
-
After collapsing adjacent/redundant mutations: 182598
-
Number of mutations before filtering: 182598
-
After removing 15927 mutations outside gene set: 166671
-
After removing 1023 mutations outside category set: 165648
-
After removing 27 "impossible" mutations in
-
gene-patient-category bins of zero coverage: 148671
Table 1. Get Full Table Table representing breakdown of mutations by type.
| type | count |
|---|---|
| Frame_Shift_Del | 1055 |
| Frame_Shift_Ins | 452 |
| In_Frame_Del | 686 |
| In_Frame_Ins | 130 |
| Missense_Mutation | 110554 |
| Nonsense_Mutation | 11525 |
| Nonstop_Mutation | 127 |
| Silent | 38550 |
| Splice_Site | 2569 |
| Total | 165648 |
Table 2. Get Full Table A breakdown of mutation rates per category discovered for this individual set.
| category | n | N | rate | rate_per_mb | relative_rate | exp_ns_s_ratio |
|---|---|---|---|---|---|---|
| *CpG->T | 37482 | 363920417 | 0.0001 | 100 | 5.6 | 2.2 |
| *Cp(A/C/T)->mut | 48855 | 3147487610 | 0.000016 | 16 | 0.85 | 3.4 |
| A->mut | 23150 | 3458111551 | 6.7e-06 | 6.7 | 0.37 | 3.8 |
| *CpG->(G/A) | 1051 | 363920417 | 2.9e-06 | 2.9 | 0.16 | 2.7 |
| indel+null | 15675 | 6969519578 | 2.2e-06 | 2.2 | 0.12 | NaN |
| double_null | 868 | 6969519578 | 1.2e-07 | 0.12 | 0.0068 | NaN |
| Total | 127081 | 6969519578 | 0.000018 | 18 | 1 | 3.5 |
The x axis represents the samples. The y axis represents the exons, one row per exon, and they are sorted by average coverage across samples. For exons with exactly the same average coverage, they are sorted next by the %GC of the exon. (The secondary sort is especially useful for the zero-coverage exons at the bottom).
Figure 1.
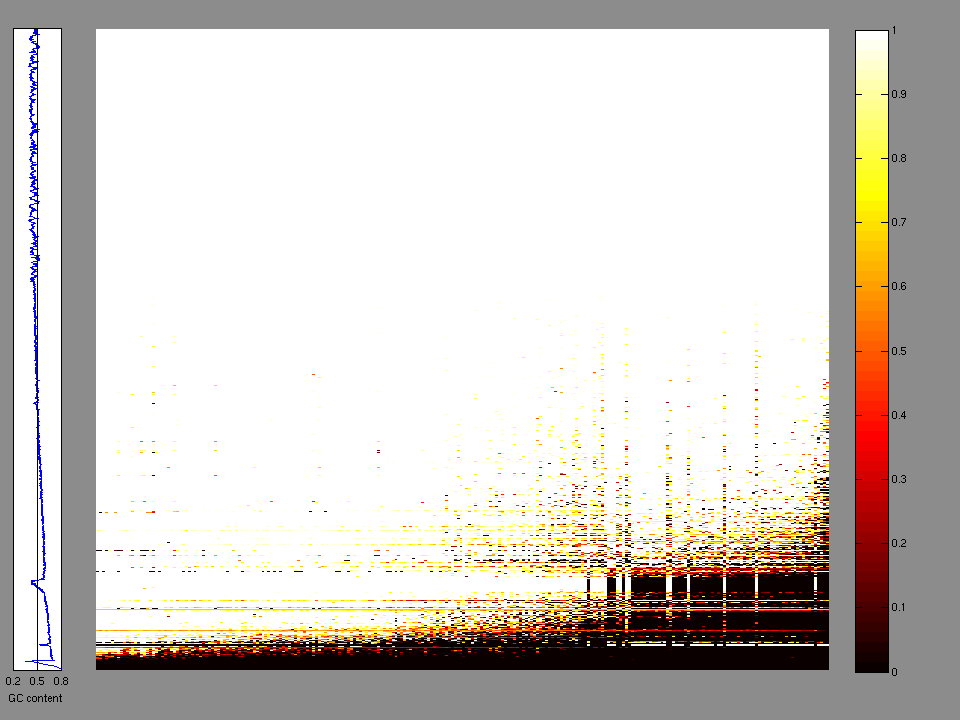
Figure 2. Patients counts and rates file used to generate this plot: UCEC-TP.patients.counts_and_rates.txt
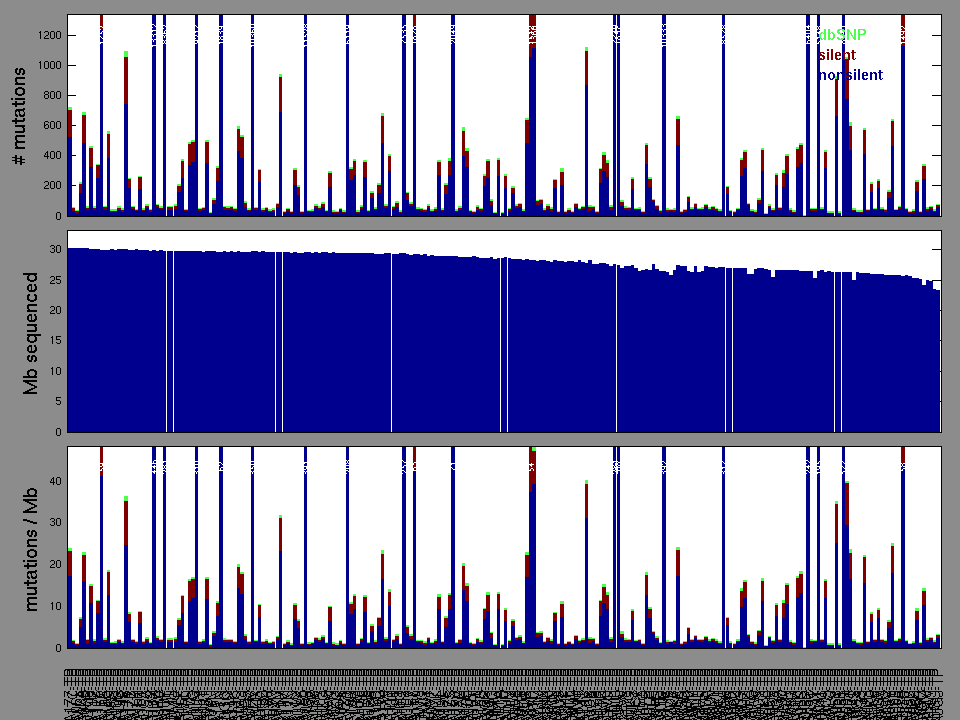
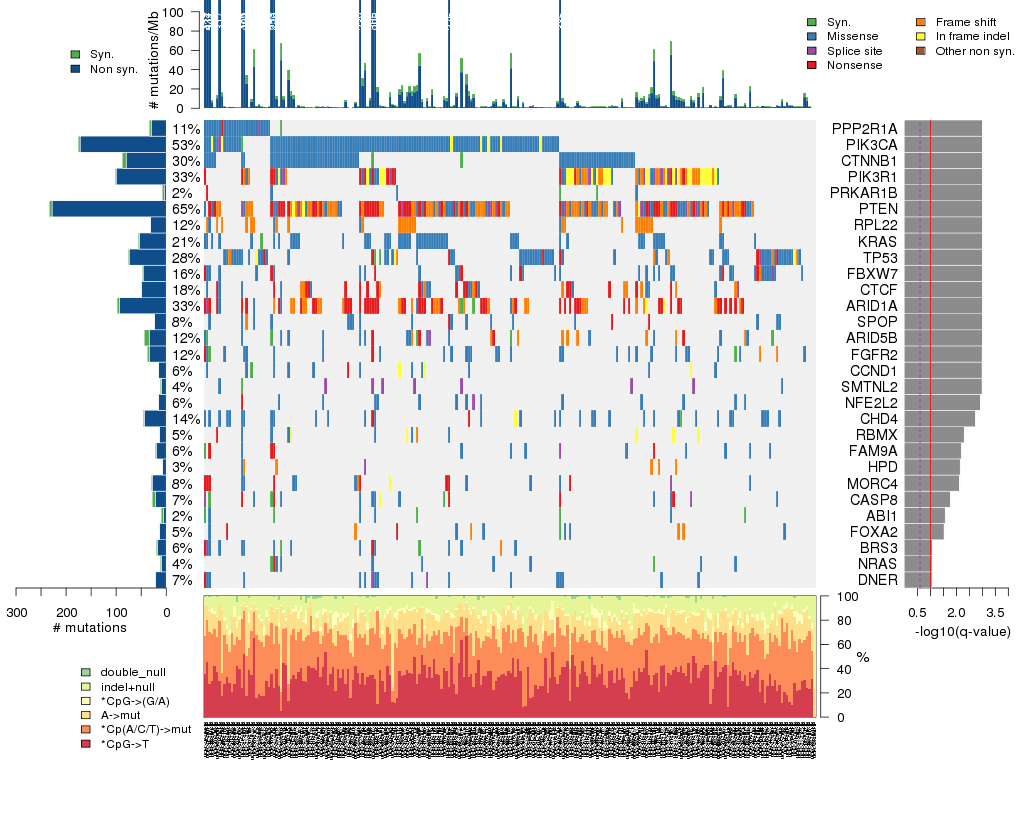
Figure 3. Get High-res Image The matrix in the center of the figure represents individual mutations in patient samples, color-coded by type of mutation, for the significantly mutated genes. The rate of synonymous and non-synonymous mutations is displayed at the top of the matrix. The barplot on the left of the matrix shows the number of mutations in each gene. The percentages represent the fraction of tumors with at least one mutation in the specified gene. The barplot to the right of the matrix displays the q-values for the most significantly mutated genes. The purple boxplots below the matrix (only displayed if required columns are present in the provided MAF) represent the distributions of allelic fractions observed in each sample. The plot at the bottom represents the base substitution distribution of individual samples, using the same categories that were used to calculate significance.
Column Descriptions:
-
N = number of sequenced bases in this gene across the individual set
-
n = number of (nonsilent) mutations in this gene across the individual set
-
npat = number of patients (individuals) with at least one nonsilent mutation
-
nsite = number of unique sites having a non-silent mutation
-
nsil = number of silent mutations in this gene across the individual set
-
n1 = number of nonsilent mutations of type: *CpG->T
-
n2 = number of nonsilent mutations of type: *Cp(A/C/T)->mut
-
n3 = number of nonsilent mutations of type: A->mut
-
n4 = number of nonsilent mutations of type: *CpG->(G/A)
-
n5 = number of nonsilent mutations of type: indel+null
-
n6 = number of nonsilent mutations of type: double_null
-
p_cons = p-value for enrichment of mutations at evolutionarily most-conserved sites in gene
-
p_joint = p-value for clustering + conservation
-
p = p-value (overall)
-
q = q-value, False Discovery Rate (Benjamini-Hochberg procedure)
Table 3. Get Full Table A Ranked List of Significantly Mutated Genes. Number of significant genes found: 29. Number of genes displayed: 35. Click on a gene name to display its stick figure depicting the distribution of mutations and mutation types across the chosen gene (this feature may not be available for all significant genes).
| rank | gene | description | N | n | npat | nsite | nsil | n1 | n2 | n3 | n4 | n5 | n6 | p_cons | p_joint | p_cv | p | q |
|---|---|---|---|---|---|---|---|---|---|---|---|---|---|---|---|---|---|---|
| 1 | PPP2R1A | protein phosphatase 2 (formerly 2A), regulatory subunit A , alpha isoform | 434902 | 30 | 27 | 18 | 3 | 10 | 17 | 1 | 0 | 2 | 0 | 0.23 | 0 | 9.7e-08 | 0 | 0 |
| 2 | PIK3CA | phosphoinositide-3-kinase, catalytic, alpha polypeptide | 813637 | 172 | 132 | 76 | 3 | 31 | 61 | 68 | 3 | 9 | 0 | 8e-07 | 0 | 2.4e-15 | 0 | 0 |
| 3 | CTNNB1 | catenin (cadherin-associated protein), beta 1, 88kDa | 592248 | 80 | 74 | 25 | 7 | 5 | 61 | 14 | 0 | 0 | 0 | 2e-07 | 0 | 4.9e-15 | 0 | 0 |
| 4 | PIK3R1 | phosphoinositide-3-kinase, regulatory subunit 1 (alpha) | 581125 | 100 | 83 | 77 | 2 | 4 | 4 | 13 | 1 | 63 | 15 | 0.58 | 0 | 2.8e-15 | 0 | 0 |
| 5 | PRKAR1B | protein kinase, cAMP-dependent, regulatory, type I, beta | 242642 | 4 | 4 | 4 | 3 | 2 | 0 | 0 | 1 | 1 | 0 | 0 | 0 | 0.56 | 0 | 0 |
| 6 | PTEN | phosphatase and tensin homolog (mutated in multiple advanced cancers 1) | 306286 | 228 | 161 | 134 | 5 | 20 | 29 | 21 | 33 | 98 | 27 | 0.9 | 1e-06 | 0 | 0 | 0 |
| 7 | RPL22 | ribosomal protein L22 | 97813 | 31 | 31 | 7 | 0 | 1 | 0 | 3 | 0 | 26 | 1 | 0.012 | 0 | 1.3e-15 | 0 | 0 |
| 8 | KRAS | v-Ki-ras2 Kirsten rat sarcoma viral oncogene homolog | 175322 | 53 | 53 | 11 | 2 | 1 | 47 | 4 | 1 | 0 | 0 | 0.00019 | 0 | 3.1e-12 | 0 | 0 |
| 9 | TP53 | tumor protein p53 | 317550 | 74 | 69 | 50 | 2 | 23 | 18 | 15 | 1 | 17 | 0 | 2.6e-06 | 0 | 5.3e-15 | 0 | 0 |
| 10 | FBXW7 | F-box and WD repeat domain containing 7 | 638720 | 46 | 39 | 30 | 1 | 22 | 12 | 2 | 1 | 8 | 1 | 0.015 | 0.00081 | 3.7e-14 | 1.1e-15 | 1.9e-12 |
| 11 | CTCF | CCCTC-binding factor (zinc finger protein) | 547098 | 49 | 45 | 39 | 1 | 8 | 4 | 7 | 0 | 27 | 3 | 0.1 | 0.021 | 6.2e-15 | 5e-15 | 7.6e-12 |
| 12 | ARID1A | AT rich interactive domain 1A (SWI-like) | 1412380 | 93 | 83 | 78 | 5 | 2 | 7 | 5 | 1 | 64 | 14 | 0.88 | 1 | 1.1e-15 | 3.9e-14 | 5.5e-11 |
| 13 | SPOP | speckle-type POZ protein | 287083 | 23 | 21 | 18 | 0 | 5 | 8 | 6 | 0 | 4 | 0 | 0.05 | 0.0015 | 5.2e-09 | 2.1e-10 | 2.7e-07 |
| 14 | ARID5B | AT rich interactive domain 5B (MRF1-like) | 886908 | 34 | 29 | 34 | 9 | 5 | 5 | 8 | 2 | 13 | 1 | 0.98 | 0.17 | 1.4e-09 | 5.2e-09 | 6.3e-06 |
| 15 | FGFR2 | fibroblast growth factor receptor 2 (bacteria-expressed kinase, keratinocyte growth factor receptor, craniofacial dysostosis 1, Crouzon syndrome, Pfeiffer syndrome, Jackson-Weiss syndrome) | 687457 | 34 | 31 | 19 | 3 | 3 | 5 | 13 | 9 | 3 | 1 | 0.38 | 0.059 | 1.2e-08 | 1.6e-08 | 0.000018 |
| 16 | CCND1 | cyclin D1 | 154874 | 15 | 15 | 13 | 1 | 1 | 7 | 3 | 0 | 4 | 0 | 0.28 | 0.001 | 1e-06 | 2.3e-08 | 0.000024 |
| 17 | SMTNL2 | smoothelin-like 2 | 189739 | 9 | 9 | 3 | 2 | 0 | 2 | 0 | 0 | 7 | 0 | 0.67 | 0.000094 | 0.000012 | 2.4e-08 | 0.000024 |
| 18 | NFE2L2 | nuclear factor (erythroid-derived 2)-like 2 | 446498 | 15 | 15 | 12 | 0 | 2 | 3 | 5 | 3 | 2 | 0 | 0.039 | 0.000082 | 0.000095 | 1.5e-07 | 0.00014 |
| 19 | CHD4 | chromodomain helicase DNA binding protein 4 | 1452335 | 43 | 35 | 38 | 2 | 16 | 16 | 8 | 0 | 2 | 1 | 0.7 | 0.046 | 1.1e-06 | 9.2e-07 | 0.00081 |
| 20 | RBMX | RNA binding motif protein, X-linked | 309438 | 14 | 13 | 8 | 0 | 1 | 4 | 2 | 0 | 7 | 0 | 0.2 | 0.014 | 0.000022 | 4.8e-06 | 0.004 |
| 21 | FAM9A | family with sequence similarity 9, member A | 249932 | 20 | 14 | 20 | 1 | 2 | 12 | 1 | 0 | 4 | 1 | 1 | 0.26 | 1.6e-06 | 6.8e-06 | 0.0054 |
| 22 | HPD | 4-hydroxyphenylpyruvate dioxygenase | 304730 | 7 | 7 | 3 | 0 | 0 | 0 | 1 | 0 | 6 | 0 | 0.00056 | 0.00021 | 0.0025 | 8e-06 | 0.0061 |
| 23 | MORC4 | MORC family CW-type zinc finger 4 | 675031 | 28 | 20 | 26 | 2 | 6 | 10 | 1 | 0 | 11 | 0 | 0.31 | 0.91 | 6.2e-07 | 8.6e-06 | 0.0063 |
| 24 | CASP8 | caspase 8, apoptosis-related cysteine peptidase | 434533 | 21 | 17 | 19 | 6 | 2 | 8 | 3 | 0 | 8 | 0 | 0.034 | 0.1 | 0.000015 | 0.000022 | 0.015 |
| 25 | ABI1 | abl-interactor 1 | 390369 | 5 | 4 | 2 | 5 | 0 | 5 | 0 | 0 | 0 | 0 | 1 | 2.8e-06 | 1 | 0.000039 | 0.026 |
| 26 | FOXA2 | forkhead box A2 | 222670 | 13 | 12 | 13 | 1 | 1 | 3 | 3 | 0 | 6 | 0 | 0.28 | 0.21 | 0.000016 | 0.000045 | 0.029 |
| 27 | BRS3 | bombesin-like receptor 3 | 299754 | 17 | 15 | 17 | 2 | 1 | 11 | 1 | 0 | 4 | 0 | 0.21 | 0.2 | 0.000051 | 0.00013 | 0.079 |
| 28 | NRAS | neuroblastoma RAS viral (v-ras) oncogene homolog | 145328 | 9 | 9 | 6 | 2 | 1 | 4 | 3 | 0 | 1 | 0 | 0.015 | 0.014 | 0.00084 | 0.00014 | 0.085 |
| 29 | DNER | delta/notch-like EGF repeat containing | 485604 | 21 | 18 | 20 | 1 | 4 | 9 | 5 | 0 | 3 | 0 | 0.0045 | 0.016 | 0.00075 | 0.00015 | 0.085 |
| 30 | TIAL1 | TIA1 cytotoxic granule-associated RNA binding protein-like 1 | 297036 | 15 | 11 | 15 | 2 | 5 | 4 | 1 | 0 | 5 | 0 | 0.42 | 0.079 | 0.00019 | 0.00019 | 0.1 |
| 31 | RPL14 | ribosomal protein L14 | 165361 | 8 | 7 | 4 | 0 | 0 | 1 | 0 | 2 | 5 | 0 | 0.95 | 0.016 | 0.0012 | 0.00023 | 0.12 |
| 32 | SGK1 | serum/glucocorticoid regulated kinase 1 | 469608 | 16 | 15 | 14 | 3 | 2 | 5 | 1 | 1 | 7 | 0 | 0.011 | 0.049 | 0.00039 | 0.00023 | 0.12 |
| 33 | SLC48A1 | solute carrier family 48 (heme transporter), member 1 | 64852 | 5 | 5 | 5 | 0 | 1 | 2 | 1 | 0 | 1 | 0 | 0.88 | 1 | 0.000025 | 0.00029 | 0.15 |
| 34 | BCOR | BCL6 co-repressor | 1283685 | 43 | 30 | 34 | 19 | 13 | 13 | 14 | 0 | 3 | 0 | 0.028 | 0.029 | 0.00088 | 0.0003 | 0.15 |
| 35 | ZNF263 | zinc finger protein 263 | 495567 | 13 | 8 | 10 | 0 | 1 | 9 | 1 | 0 | 2 | 0 | 0.014 | 0.00012 | 0.26 | 0.00035 | 0.17 |
In this analysis, COSMIC is used as a filter to increase power by restricting the territory of each gene. Cosmic version: v48.
Table 4. Get Full Table Significantly mutated genes (COSMIC territory only). To access the database please go to: COSMIC. Number of significant genes found: 46. Number of genes displayed: 10
| rank | gene | description | n | cos | n_cos | N_cos | cos_ev | p | q |
|---|---|---|---|---|---|---|---|---|---|
| 1 | PIK3R1 | phosphoinositide-3-kinase, regulatory subunit 1 (alpha) | 100 | 33 | 39 | 8184 | 111 | 0 | 0 |
| 2 | KRAS | v-Ki-ras2 Kirsten rat sarcoma viral oncogene homolog | 53 | 52 | 49 | 12896 | 556649 | 0 | 0 |
| 3 | PIK3CA | phosphoinositide-3-kinase, catalytic, alpha polypeptide | 172 | 220 | 150 | 54560 | 35669 | 0 | 0 |
| 4 | CTNNB1 | catenin (cadherin-associated protein), beta 1, 88kDa | 80 | 138 | 67 | 34224 | 23813 | 0 | 0 |
| 5 | FGFR2 | fibroblast growth factor receptor 2 (bacteria-expressed kinase, keratinocyte growth factor receptor, craniofacial dysostosis 1, Crouzon syndrome, Pfeiffer syndrome, Jackson-Weiss syndrome) | 34 | 51 | 24 | 12648 | 113 | 0 | 0 |
| 6 | FBXW7 | F-box and WD repeat domain containing 7 | 46 | 91 | 29 | 22568 | 852 | 0 | 0 |
| 7 | PTEN | phosphatase and tensin homolog (mutated in multiple advanced cancers 1) | 228 | 767 | 219 | 190216 | 15125 | 0 | 0 |
| 8 | TP53 | tumor protein p53 | 74 | 356 | 72 | 88288 | 24186 | 0 | 0 |
| 9 | NRAS | neuroblastoma RAS viral (v-ras) oncogene homolog | 9 | 33 | 6 | 8184 | 6490 | 1.3e-08 | 6.5e-06 |
| 10 | RB1 | retinoblastoma 1 (including osteosarcoma) | 26 | 267 | 11 | 66216 | 30 | 6.6e-08 | 0.000029 |
Note:
n - number of (nonsilent) mutations in this gene across the individual set.
cos = number of unique mutated sites in this gene in COSMIC
n_cos = overlap between n and cos.
N_cos = number of individuals times cos.
cos_ev = total evidence: number of reports in COSMIC for mutations seen in this gene.
p = p-value for seeing the observed amount of overlap in this gene)
q = q-value, False Discovery Rate (Benjamini-Hochberg procedure)
Table 5. Get Full Table A Ranked List of Significantly Mutated Genesets. (Source: MSigDB GSEA Cannonical Pathway Set).Number of significant genesets found: 68. Number of genesets displayed: 10
| rank | geneset | description | genes | N_genes | mut_tally | N | n | npat | nsite | nsil | n1 | n2 | n3 | n4 | n5 | n6 | p_ns_s | p | q |
|---|---|---|---|---|---|---|---|---|---|---|---|---|---|---|---|---|---|---|---|
| 1 | ARFPATHWAY | Cyclin-dependent kinase inhibitor 2A is a tumor suppressor that induces G1 arrest and can activate the p53 pathway, leading to G2/M arrest. | ABL1, CDKN2A, E2F1, MDM2, MYC, PIK3CA, PIK3R1, POLR1A, POLR1B, POLR1C, POLR1D, RAC1, RB1, TBX2, TP53, TWIST1 | 16 | ABL1(8), CDKN2A(2), E2F1(9), MDM2(4), MYC(8), PIK3CA(172), PIK3R1(100), POLR1A(16), POLR1B(16), POLR1C(2), POLR1D(3), RAC1(1), RB1(26), TBX2(2), TP53(74), TWIST1(1) | 7080267 | 444 | 223 | 300 | 50 | 87 | 115 | 119 | 6 | 99 | 18 | 4.87e-10 | <1.00e-15 | <3.80e-14 |
| 2 | METPATHWAY | The hepatocyte growth factor receptor c-Met stimulates proliferation and alters cell motility and adhesion on binding the ligand HGF. | ACTA1, CRK, CRKL, DOCK1, ELK1, FOS, GAB1, GRB2, GRF2, HGF, HRAS, ITGA1, ITGB1, JUN, MAP2K1, MAP2K2, MAP4K1, MAPK1, MAPK3, MAPK8, MET, PAK1, PIK3CA, PIK3R1, PTEN, PTK2, PTK2B, PTPN11, PXN, RAF1, RAP1A, RAP1B, RASA1, SOS1, SRC, STAT3 | 35 | ACTA1(5), CRK(2), CRKL(6), DOCK1(24), ELK1(3), FOS(3), GAB1(8), GRB2(3), HGF(14), HRAS(1), ITGA1(17), ITGB1(8), JUN(1), MAP2K1(2), MAP2K2(5), MAP4K1(11), MAPK1(2), MAPK3(3), MAPK8(10), MET(17), PAK1(3), PIK3CA(172), PIK3R1(100), PTEN(228), PTK2(12), PTK2B(16), PTPN11(8), PXN(6), RAF1(8), RAP1A(4), RAP1B(2), RASA1(30), SOS1(13), SRC(3), STAT3(10) | 16563754 | 760 | 217 | 538 | 93 | 135 | 188 | 148 | 37 | 208 | 44 | 7.33e-15 | <1.00e-15 | <3.80e-14 |
| 3 | PTENPATHWAY | PTEN suppresses AKT-induced cell proliferation and antagonizes the action of PI3K. | AKT1, BCAR1, CDKN1B, FOXO3A, GRB2, ILK, ITGB1, MAPK1, MAPK3, PDK2, PDPK1, PIK3CA, PIK3R1, PTEN, PTK2, SHC1, SOS1, TNFSF6 | 16 | AKT1(4), BCAR1(8), CDKN1B(7), GRB2(3), ILK(5), ITGB1(8), MAPK1(2), MAPK3(3), PDK2(5), PDPK1(3), PIK3CA(172), PIK3R1(100), PTEN(228), PTK2(12), SHC1(7), SOS1(13) | 6867110 | 580 | 213 | 364 | 30 | 73 | 121 | 124 | 37 | 183 | 42 | <1.00e-15 | <1.00e-15 | <3.80e-14 |
| 4 | GSK3PATHWAY | Bacterial lipopolysaccharide activates AKT to promote the survival and activation of macrophages and inhibits Gsk3-beta to promote beta-catenin accumulation in the nucleus. | AKT1, APC, AXIN1, CCND1, CD14, CTNNB1, DVL1, FZD1, GJA1, GNAI1, GSK3B, IRAK1, LBP, LEF1, LY96, MYD88, NFKB1, PDPK1, PIK3CA, PIK3R1, PPP2CA, PRKR, RELA, TIRAP, TLR4, TOLLIP, WNT1 | 26 | AKT1(4), APC(56), AXIN1(9), CCND1(15), CD14(2), CTNNB1(80), DVL1(3), FZD1(3), GJA1(5), GNAI1(5), GSK3B(13), IRAK1(4), LBP(3), LEF1(9), LY96(4), MYD88(3), NFKB1(10), PDPK1(3), PIK3CA(172), PIK3R1(100), PPP2CA(6), RELA(6), TIRAP(2), TLR4(17), TOLLIP(1), WNT1(1) | 10634125 | 536 | 210 | 356 | 58 | 77 | 201 | 122 | 6 | 110 | 20 | 2.06e-13 | <1.00e-15 | <3.80e-14 |
| 5 | SA_PTEN_PATHWAY | PTEN is a tumor suppressor that dephosphorylates the lipid messenger phosphatidylinositol triphosphate. | AKT1, AKT2, AKT3, BPNT1, GRB2, ILK, MAPK1, MAPK3, PDK1, PIK3CA, PIK3CD, PIP3-E, PTEN, PTK2B, RBL2, SHC1, SOS1 | 16 | AKT1(4), AKT2(6), AKT3(11), BPNT1(3), GRB2(3), ILK(5), MAPK1(2), MAPK3(3), PDK1(2), PIK3CA(172), PIK3CD(12), PTEN(228), PTK2B(16), RBL2(19), SHC1(7), SOS1(13) | 7243620 | 506 | 208 | 307 | 39 | 92 | 126 | 107 | 36 | 117 | 28 | <1.00e-15 | <1.00e-15 | <3.80e-14 |
| 6 | EDG1PATHWAY | The lipid S1P is an EDG1 ligand promoting chemotaxis via Rac1 and cell survival and proliferation via ERK activation. | ADCY1, AKT1, ARHA, ASAH1, EDG1, GNAI1, GNB1, GNGT1, ITGAV, ITGB3, MAPK1, MAPK3, PDGFA, PDGFRA, PIK3CA, PIK3R1, PLCB1, PRKCA, PRKCB1, PTK2, RAC1, SKIP, SMPD1, SMPD2, SPHK1, SRC | 22 | ADCY1(21), AKT1(4), ASAH1(7), GNAI1(5), GNB1(2), GNGT1(1), ITGAV(10), ITGB3(11), MAPK1(2), MAPK3(3), PDGFA(3), PDGFRA(24), PIK3CA(172), PIK3R1(100), PLCB1(5), PRKCA(10), PTK2(12), RAC1(1), SMPD1(11), SMPD2(7), SPHK1(2), SRC(3) | 9845923 | 416 | 201 | 295 | 65 | 72 | 117 | 114 | 6 | 90 | 17 | 1.52e-05 | <1.00e-15 | <3.80e-14 |
| 7 | HCMVPATHWAY | Cytomegalovirus activates MAP kinase pathways in the host cell, inducing transcription of viral genes. | AKT1, CREB1, MAP2K1, MAP2K2, MAP2K3, MAP2K6, MAP3K1, MAPK1, MAPK14, MAPK3, NFKB1, PIK3CA, PIK3R1, RB1, RELA, SP1 | 16 | AKT1(4), CREB1(6), MAP2K1(2), MAP2K2(5), MAP2K3(7), MAP2K6(10), MAP3K1(30), MAPK1(2), MAPK14(4), MAPK3(3), NFKB1(10), PIK3CA(172), PIK3R1(100), RB1(26), RELA(6), SP1(7) | 7166136 | 394 | 200 | 272 | 31 | 63 | 112 | 107 | 4 | 89 | 19 | 2.19e-12 | <1.00e-15 | <3.80e-14 |
| 8 | IL7PATHWAY | IL-7 is required for B and T cell development and proliferation and may contribute to activation of VDJ recombination. | BCL2, CREBBP, EP300, FYN, IL2RG, IL7, IL7R, JAK1, JAK3, LCK, NMI, PIK3CA, PIK3R1, PTK2B, STAT5A, STAT5B | 16 | CREBBP(32), EP300(32), FYN(7), IL2RG(13), IL7(1), IL7R(12), JAK1(20), JAK3(10), LCK(5), NMI(3), PIK3CA(172), PIK3R1(100), PTK2B(16), STAT5A(5), STAT5B(7) | 10213532 | 435 | 200 | 312 | 56 | 77 | 121 | 115 | 6 | 100 | 16 | 3.60e-08 | <1.00e-15 | <3.80e-14 |
| 9 | RAC1PATHWAY | Rac-1 is a Rho family G protein that stimulates formation of actin-dependent structures such as filopodia and lamellopodia. | ARFIP2, CDK5, CDK5R1, CFL1, CHN1, LIMK1, MAP3K1, MYL2, MYLK, NCF2, PAK1, PDGFRA, PIK3CA, PIK3R1, PLD1, PPP1R12B, RAC1, RALBP1, RPS6KB1, TRIO, VAV1, WASF1 | 22 | ARFIP2(1), CDK5(2), CDK5R1(3), CFL1(1), CHN1(3), LIMK1(8), MAP3K1(30), MYL2(2), MYLK(14), NCF2(8), PAK1(3), PDGFRA(24), PIK3CA(172), PIK3R1(100), PLD1(14), PPP1R12B(20), RAC1(1), RALBP1(6), RPS6KB1(5), TRIO(34), VAV1(12), WASF1(3) | 12890193 | 466 | 200 | 341 | 66 | 88 | 134 | 115 | 6 | 104 | 19 | 1.52e-07 | <1.00e-15 | <3.80e-14 |
| 10 | ECMPATHWAY | Extracellular matrix induces integrin-mediated FAK phosphorylation in epithelial cells, leading to PI3 and MAP kinase activation and actin reorganization. | ARHA, ARHGAP5, DIAPH1, FYN, GSN, HRAS, ITGA1, ITGB1, MAP2K1, MAPK1, MAPK3, MYL2, MYLK, PFN1, PIK3CA, PIK3R1, PTK2, PXN, RAF1, ROCK1, SHC1, SRC, TLN1 | 22 | ARHGAP5(21), DIAPH1(13), FYN(7), GSN(5), HRAS(1), ITGA1(17), ITGB1(8), MAP2K1(2), MAPK1(2), MAPK3(3), MYL2(2), MYLK(14), PFN1(1), PIK3CA(172), PIK3R1(100), PTK2(12), PXN(6), RAF1(8), ROCK1(22), SHC1(7), SRC(3), TLN1(23) | 13836087 | 449 | 199 | 329 | 53 | 93 | 128 | 116 | 4 | 91 | 17 | 7.62e-10 | <1.00e-15 | <3.80e-14 |
In brief, we tabulate the number of mutations and the number of covered bases for each gene. The counts are broken down by mutation context category: four context categories that are discovered by MutSig, and one for indel and 'null' mutations, which include indels, nonsense mutations, splice-site mutations, and non-stop (read-through) mutations. For each gene, we calculate the probability of seeing the observed constellation of mutations, i.e. the product P1 x P2 x ... x Pm, or a more extreme one, given the background mutation rates calculated across the dataset. [1]
This is an experimental feature. The full results of the analysis summarized in this report can be downloaded from the TCGA Data Coordination Center.