This report serves to describe the mutational landscape and properties of a given individual set, as well as rank genes and genesets according to mutational significance. MutSig v2.0 was used to generate the results found in this report.
-
Working with individual set: BLCA-TP
-
Number of patients in set: 28
The input for this pipeline is a set of individuals with the following files associated for each:
-
An annotated .maf file describing the mutations called for the respective individual, and their properties.
-
A .wig file that contains information about the coverage of the sample.
-
MAF used for this analysis:BLCA-TP.final_analysis_set.maf
-
Significantly mutated genes (q ≤ 0.1): 3
-
Mutations seen in COSMIC: 37
-
Significantly mutated genes in COSMIC territory: 3
-
Genes with clustered mutations (≤ 3 aa apart): 58
-
Significantly mutated genesets: 17
-
Significantly mutated genesets: (excluding sig. mutated genes):0
-
Read 28 MAFs of type "Broad"
-
Total number of mutations in input MAFs: 7557
-
After removing 3 mutations outside chr1-24: 7554
-
After removing 154 noncoding mutations: 7400
-
Number of mutations before filtering: 7400
-
After removing 118 mutations outside gene set: 7282
-
After removing 12 mutations outside category set: 7270
Table 1. Get Full Table Table representing breakdown of mutations by type.
| type | count |
|---|---|
| Frame_Shift_Del | 99 |
| Frame_Shift_Ins | 47 |
| In_Frame_Del | 28 |
| In_Frame_Ins | 5 |
| Missense_Mutation | 4707 |
| Nonsense_Mutation | 418 |
| Nonstop_Mutation | 9 |
| Silent | 1832 |
| Splice_Site | 117 |
| Translation_Start_Site | 8 |
| Total | 7270 |
Table 2. Get Full Table A breakdown of mutation rates per category discovered for this individual set.
| category | n | N | rate | rate_per_mb | relative_rate | exp_ns_s_ratio |
|---|---|---|---|---|---|---|
| Tp*C->(T/G) | 2638 | 108904258 | 0.000024 | 24 | 3.7 | 3 |
| Tp*C->A | 202 | 108904258 | 1.9e-06 | 1.9 | 0.28 | 4 |
| (A/C/G)p*C->mut | 1249 | 308289400 | 4.1e-06 | 4.1 | 0.61 | 3.2 |
| A->mut | 626 | 402887181 | 1.6e-06 | 1.6 | 0.23 | 3.9 |
| indel+null | 711 | 820080839 | 8.7e-07 | 0.87 | 0.13 | NaN |
| double_null | 12 | 820080839 | 1.5e-08 | 0.015 | 0.0022 | NaN |
| Total | 5438 | 820080839 | 6.6e-06 | 6.6 | 1 | 3.5 |
The x axis represents the samples. The y axis represents the exons, one row per exon, and they are sorted by average coverage across samples. For exons with exactly the same average coverage, they are sorted next by the %GC of the exon. (The secondary sort is especially useful for the zero-coverage exons at the bottom).
Figure 1.
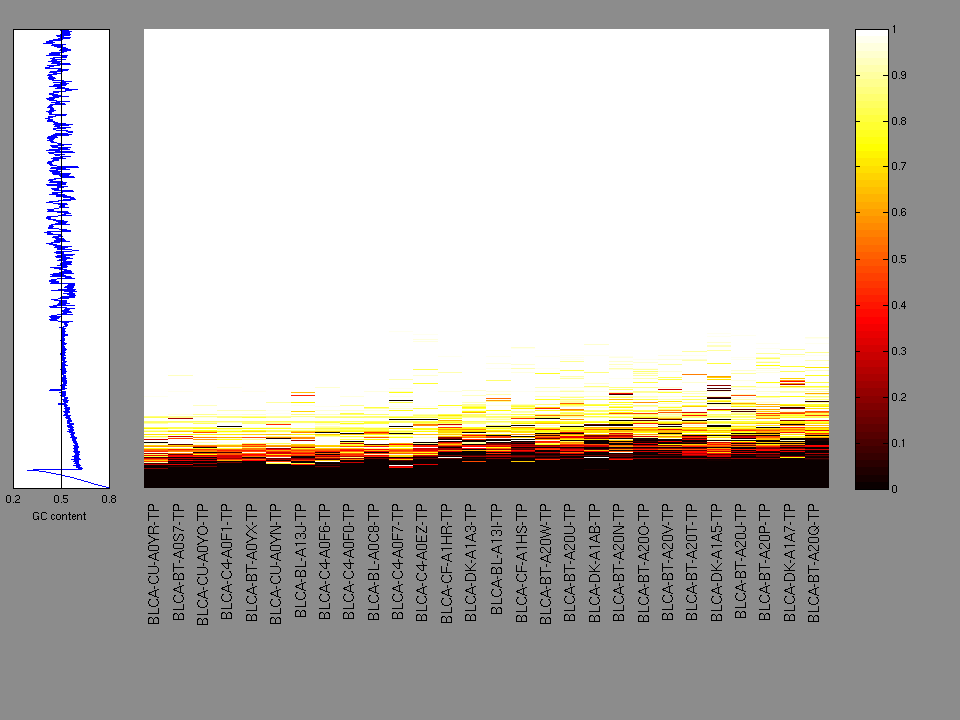
Figure 2. Patients counts and rates file used to generate this plot: BLCA-TP.patients.counts_and_rates.txt

The mutation spectrum is depicted in the lego plots below in which the 96 possible mutation types are subdivided into six large blocks, color-coded to reflect the base substitution type. Each large block is further subdivided into the 16 possible pairs of 5' and 3' neighbors, as listed in the 4x4 trinucleotide context legend. The height of each block corresponds to the mutation frequency for that kind of mutation (counts of mutations normalized by the base coverage in a given bin). The shape of the spectrum is a signature for dominant mutational mechanisms in different tumor types.
Figure 3. Get High-res Image SNV Mutation rate lego plot for entire set. Each bin is normalized by base coverage for that bin. Colors represent the six SNV types on the upper right. The three-base context for each mutation is labeled in the 4x4 legend on the lower right. The fractional breakdown of SNV counts is shown in the pie chart on the upper left. If this figure is blank, not enough information was provided in the MAF to generate it.
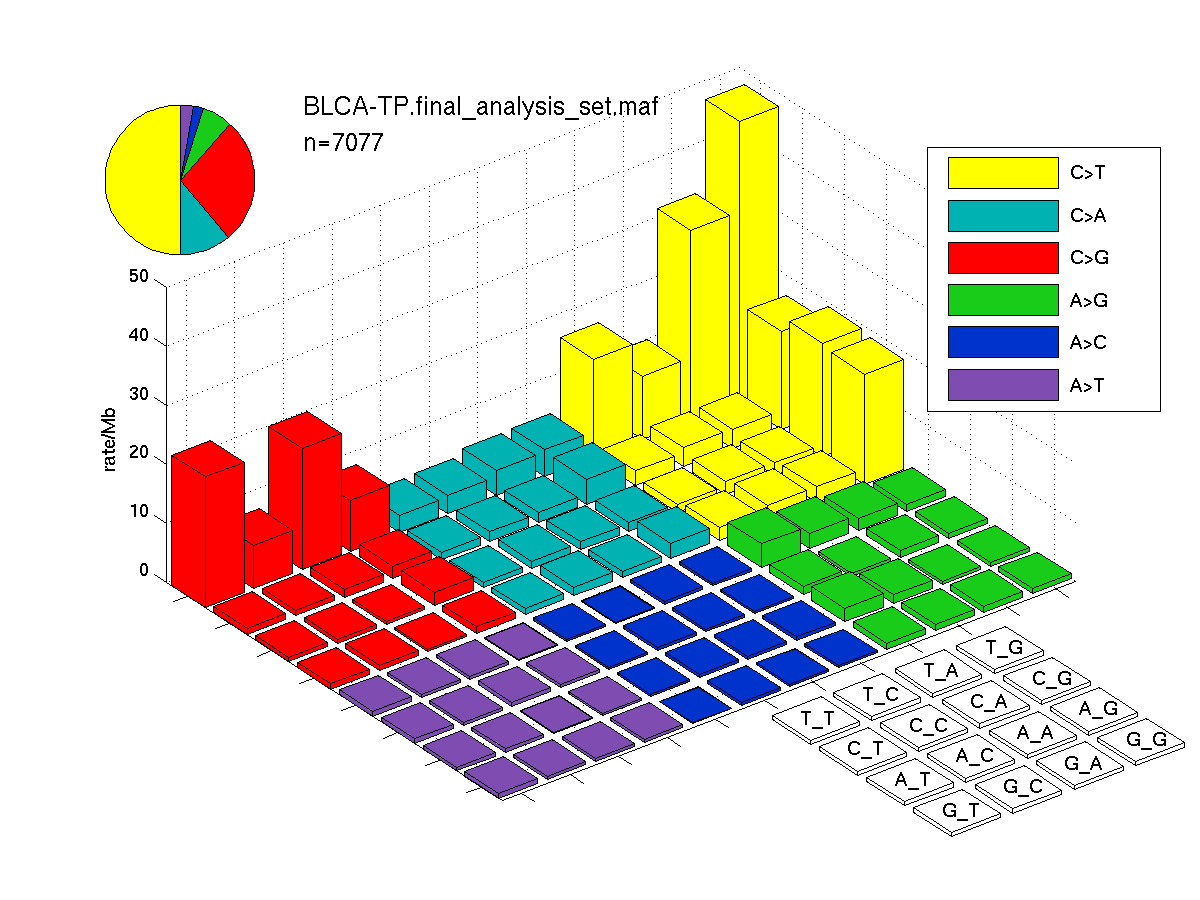
Figure 4. Get High-res Image SNV Mutation rate lego plots for 4 slices of mutation allele fraction (0<=AF<0.1, 0.1<=AF<0.25, 0.25<=AF<0.5, & 0.5<=AF) . The color code and three-base context legends are the same as the previous figure. If this figure is blank, not enough information was provided in the MAF to generate it.
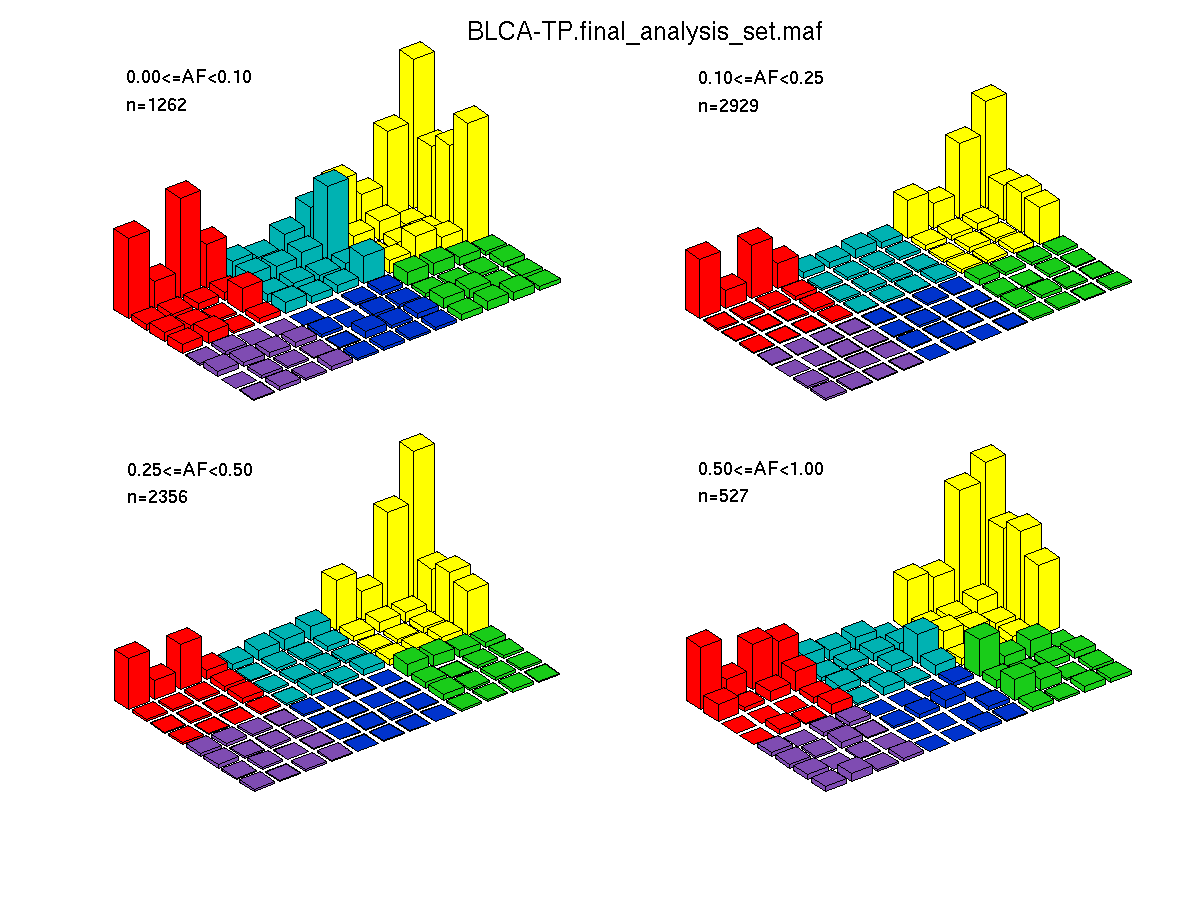
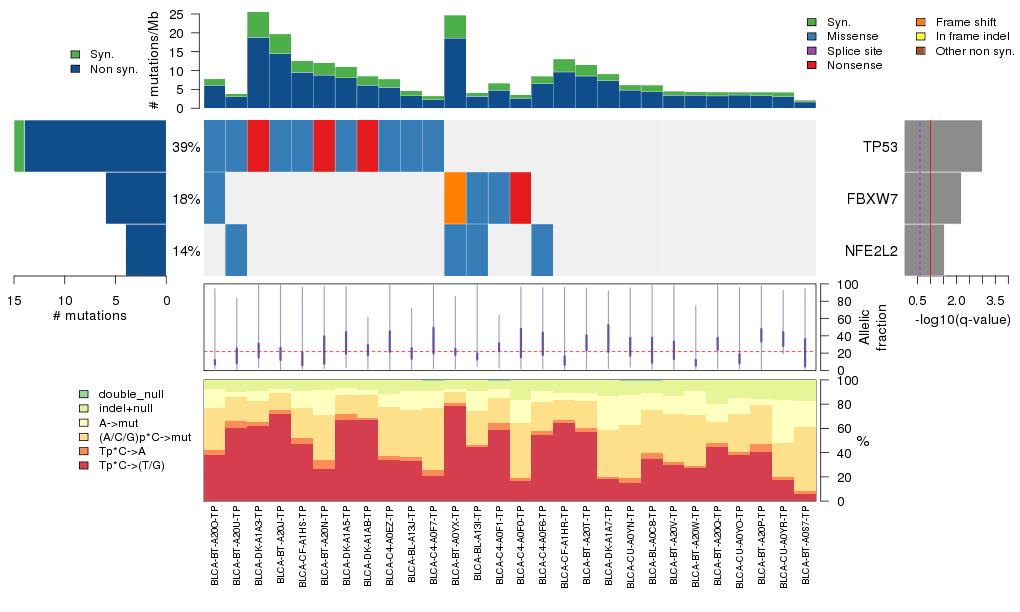
Figure 5. Get High-res Image The matrix in the center of the figure represents individual mutations in patient samples, color-coded by type of mutation, for the significantly mutated genes. The rate of synonymous and non-synonymous mutations is displayed at the top of the matrix. The barplot on the left of the matrix shows the number of mutations in each gene. The percentages represent the fraction of tumors with at least one mutation in the specified gene. The barplot to the right of the matrix displays the q-values for the most significantly mutated genes. The purple boxplots below the matrix (only displayed if required columns are present in the provided MAF) represent the distributions of allelic fractions observed in each sample. The plot at the bottom represents the base substitution distribution of individual samples, using the same categories that were used to calculate significance.
Column Descriptions:
-
N = number of sequenced bases in this gene across the individual set
-
n = number of (nonsilent) mutations in this gene across the individual set
-
npat = number of patients (individuals) with at least one nonsilent mutation
-
nsite = number of unique sites having a non-silent mutation
-
nsil = number of silent mutations in this gene across the individual set
-
n1 = number of nonsilent mutations of type: Tp*C->(T/G)
-
n2 = number of nonsilent mutations of type: Tp*C->A
-
n3 = number of nonsilent mutations of type: (A/C/G)p*C->mut
-
n4 = number of nonsilent mutations of type: A->mut
-
n5 = number of nonsilent mutations of type: indel+null
-
n6 = number of nonsilent mutations of type: double_null
-
p_classic = p-value for the observed amount of nonsilent mutations being elevated in this gene
-
p_ns_s = p-value for the observed nonsilent/silent ratio being elevated in this gene
-
p_cons = p-value for enrichment of mutations at evolutionarily most-conserved sites in gene
-
p_joint = p-value for clustering + conservation
-
p = p-value (overall)
-
q = q-value, False Discovery Rate (Benjamini-Hochberg procedure)
Table 3. Get Full Table A Ranked List of Significantly Mutated Genes. Number of significant genes found: 3. Number of genes displayed: 35. Click on a gene name to display its stick figure depicting the distribution of mutations and mutation types across the chosen gene (this feature may not be available for all significant genes).
| rank | gene | description | N | n | npat | nsite | nsil | n1 | n2 | n3 | n4 | n5 | n6 | p_classic | p_ns_s | p_clust | p_cons | p_joint | p | q |
|---|---|---|---|---|---|---|---|---|---|---|---|---|---|---|---|---|---|---|---|---|
| 1 | TP53 | tumor protein p53 | 34506 | 14 | 11 | 13 | 1 | 2 | 0 | 8 | 1 | 3 | 0 | 1e-14 | 0.1 | 0.000023 | 0.0031 | 0.000022 | 0 | 0 |
| 2 | FBXW7 | F-box and WD repeat domain containing 7 | 68665 | 6 | 5 | 5 | 0 | 2 | 0 | 2 | 0 | 2 | 0 | 9.3e-06 | 0.34 | 0.003 | 0.071 | 0.0034 | 5.8e-07 | 0.0052 |
| 3 | NFE2L2 | nuclear factor (erythroid-derived 2)-like 2 | 50092 | 4 | 4 | 4 | 0 | 1 | 0 | 1 | 2 | 0 | 0 | 0.000018 | 0.4 | 0.27 | 0.0095 | 0.016 | 4.4e-06 | 0.027 |
| 4 | KDM6A | lysine (K)-specific demethylase 6A | 109258 | 6 | 6 | 6 | 2 | 0 | 0 | 0 | 0 | 6 | 0 | 4.1e-06 | 0.98 | 0.87 | 0.42 | 1 | 0.000055 | 0.25 |
| 5 | ZNF814 | zinc finger protein 814 | 55308 | 3 | 3 | 1 | 0 | 0 | 0 | 3 | 0 | 0 | 0 | 0.0017 | 0.59 | 0.00014 | 0.98 | 0.0039 | 0.000084 | 0.28 |
| 6 | GPS2 | G protein pathway suppressor 2 | 26706 | 3 | 3 | 3 | 0 | 0 | 1 | 0 | 0 | 1 | 1 | 0.000013 | 0.58 | 0.4 | 0.37 | 0.55 | 0.000095 | 0.28 |
| 7 | HCN1 | hyperpolarization activated cyclic nucleotide-gated potassium channel 1 | 68545 | 4 | 4 | 4 | 1 | 1 | 0 | 1 | 0 | 1 | 1 | 0.000025 | 0.61 | 0.31 | 0.73 | 0.41 | 0.00013 | 0.33 |
| 8 | POTEC | POTE ankyrin domain family, member C | 42155 | 3 | 3 | 2 | 0 | 0 | 0 | 2 | 1 | 0 | 0 | 0.00029 | 0.55 | 0.011 | 0.84 | 0.064 | 0.00022 | 0.5 |
| 9 | MLL | myeloid/lymphoid or mixed-lineage leukemia (trithorax homolog, Drosophila) | 326788 | 9 | 7 | 8 | 1 | 7 | 0 | 0 | 0 | 2 | 0 | 0.0034 | 0.48 | 0.0036 | 0.63 | 0.0088 | 0.00035 | 0.64 |
| 10 | CDH8 | cadherin 8, type 2 | 68247 | 3 | 2 | 3 | 0 | 0 | 2 | 0 | 0 | 1 | 0 | 0.0048 | 0.52 | 0.0044 | 0.13 | 0.0065 | 0.00035 | 0.64 |
| 11 | ARID1A | AT rich interactive domain 1A (SWI-like) | 162255 | 8 | 6 | 8 | 1 | 3 | 0 | 0 | 0 | 5 | 0 | 0.000068 | 0.66 | 0.31 | 0.93 | 0.58 | 0.00044 | 0.7 |
| 12 | PYGO1 | pygopus homolog 1 (Drosophila) | 35616 | 3 | 3 | 3 | 0 | 0 | 0 | 1 | 1 | 1 | 0 | 0.00023 | 0.52 | 0.088 | 0.62 | 0.21 | 0.00052 | 0.7 |
| 13 | OR2T35 | olfactory receptor, family 2, subfamily T, member 35 | 8109 | 2 | 2 | 1 | 0 | 0 | 0 | 0 | 0 | 2 | 0 | 0.0001 | 1 | 0.016 | 0.92 | 0.47 | 0.00052 | 0.7 |
| 14 | C17orf81 | chromosome 17 open reading frame 81 | 29954 | 3 | 2 | 3 | 1 | 2 | 0 | 1 | 0 | 0 | 0 | 0.0077 | 0.78 | 0.0087 | 0.081 | 0.0065 | 0.00054 | 0.7 |
| 15 | NAA25 | N(alpha)-acetyltransferase 25, NatB auxiliary subunit | 82616 | 4 | 4 | 4 | 0 | 1 | 1 | 1 | 0 | 1 | 0 | 0.00036 | 0.44 | 0.12 | 0.86 | 0.16 | 0.00062 | 0.74 |
| 16 | PPBP | pro-platelet basic protein (chemokine (C-X-C motif) ligand 7) | 11172 | 2 | 2 | 2 | 0 | 0 | 1 | 1 | 0 | 0 | 0 | 0.00012 | 0.56 | 0.47 | 0.35 | 0.55 | 0.00068 | 0.77 |
| 17 | BCLAF1 | BCL2-associated transcription factor 1 | 78524 | 5 | 4 | 5 | 0 | 2 | 0 | 0 | 2 | 1 | 0 | 0.00022 | 0.4 | 0.24 | 0.88 | 0.33 | 0.00078 | 0.83 |
| 18 | ERCC2 | excision repair cross-complementing rodent repair deficiency, complementation group 2 (xeroderma pigmentosum D) | 60112 | 4 | 4 | 4 | 0 | 1 | 0 | 1 | 2 | 0 | 0 | 0.00014 | 0.35 | 0.91 | 0.03 | 0.6 | 0.00086 | 0.87 |
| 19 | CREBBP | CREB binding protein (Rubinstein-Taybi syndrome) | 195325 | 5 | 5 | 5 | 1 | 0 | 0 | 2 | 0 | 3 | 0 | 0.0015 | 0.54 | 0.056 | 0.28 | 0.078 | 0.0012 | 1 |
| 20 | HRNR | hornerin | 181633 | 6 | 6 | 6 | 0 | 2 | 1 | 2 | 1 | 0 | 0 | 0.00021 | 0.34 | 0.44 | 0.46 | 0.57 | 0.0012 | 1 |
| 21 | C11orf85 | chromosome 11 open reading frame 85 | 19112 | 2 | 2 | 2 | 0 | 0 | 0 | 0 | 1 | 1 | 0 | 0.00056 | 0.58 | 0.2 | 0.9 | 0.22 | 0.0012 | 1 |
| 22 | HLA-A | major histocompatibility complex, class I, A | 29882 | 3 | 3 | 3 | 0 | 0 | 0 | 1 | 0 | 2 | 0 | 0.00013 | 0.54 | 1 | 0.67 | 0.93 | 0.0012 | 1 |
| 23 | ELF3 | E74-like factor 3 (ets domain transcription factor, epithelial-specific ) | 32054 | 3 | 3 | 3 | 0 | 0 | 0 | 1 | 0 | 2 | 0 | 0.0002 | 0.72 | 0.44 | 0.48 | 0.7 | 0.0014 | 1 |
| 24 | PCDHAC1 | protocadherin alpha subfamily C, 1 | 82079 | 4 | 4 | 4 | 0 | 1 | 0 | 1 | 2 | 0 | 0 | 0.00014 | 0.33 | 0.78 | 0.81 | 1 | 0.0014 | 1 |
| 25 | XPR1 | xenotropic and polytropic retrovirus receptor | 59450 | 5 | 4 | 5 | 1 | 3 | 0 | 0 | 0 | 2 | 0 | 0.00031 | 0.64 | 0.31 | 0.47 | 0.47 | 0.0014 | 1 |
| 26 | OTUD7A | OTU domain containing 7A | 48592 | 4 | 4 | 4 | 0 | 3 | 0 | 1 | 0 | 0 | 0 | 0.00015 | 0.28 | 0.91 | 0.75 | 1 | 0.0015 | 1 |
| 27 | C22orf24 | chromosome 22 open reading frame 24 | 6765 | 1 | 1 | 1 | 0 | 0 | 0 | 0 | 1 | 0 | 0 | 0.0017 | 0.75 | NaN | NaN | NaN | 0.0017 | 1 |
| 28 | PLAUR | plasminogen activator, urokinase receptor | 28994 | 3 | 2 | 3 | 0 | 3 | 0 | 0 | 0 | 0 | 0 | 0.0092 | 0.38 | 0.0073 | 0.38 | 0.022 | 0.0019 | 1 |
| 29 | LETMD1 | LETM1 domain containing 1 | 31332 | 3 | 3 | 3 | 0 | 1 | 0 | 0 | 2 | 0 | 0 | 0.00063 | 0.42 | 0.81 | 0.11 | 0.36 | 0.0021 | 1 |
| 30 | OPCML | opioid binding protein/cell adhesion molecule-like | 31380 | 3 | 3 | 3 | 1 | 1 | 0 | 1 | 1 | 0 | 0 | 0.00023 | 0.73 | 0.9 | 0.87 | 1 | 0.0022 | 1 |
| 31 | CREB3L3 | cAMP responsive element binding protein 3-like 3 | 39059 | 3 | 2 | 3 | 0 | 3 | 0 | 0 | 0 | 0 | 0 | 0.011 | 0.38 | 0.049 | 0.0094 | 0.022 | 0.0023 | 1 |
| 32 | HMCN1 | hemicentin 1 | 479312 | 9 | 8 | 9 | 0 | 4 | 0 | 1 | 2 | 2 | 0 | 0.003 | 0.14 | 0.27 | 0.042 | 0.087 | 0.0024 | 1 |
| 33 | DENR | density-regulated protein | 8547 | 1 | 1 | 1 | 0 | 0 | 1 | 0 | 0 | 0 | 0 | 0.0025 | 0.88 | NaN | NaN | NaN | 0.0025 | 1 |
| 34 | ADHFE1 | alcohol dehydrogenase, iron containing, 1 | 39147 | 2 | 2 | 2 | 0 | 0 | 0 | 1 | 1 | 0 | 0 | 0.0078 | 0.59 | 0.018 | 0.46 | 0.036 | 0.0026 | 1 |
| 35 | CRYBB1 | crystallin, beta B1 | 21812 | 2 | 1 | 2 | 1 | 0 | 1 | 0 | 0 | 1 | 0 | 0.019 | 0.85 | 0.0091 | 0.083 | 0.015 | 0.0026 | 1 |
Figure S1. This figure depicts the distribution of mutations and mutation types across the TP53 significant gene.
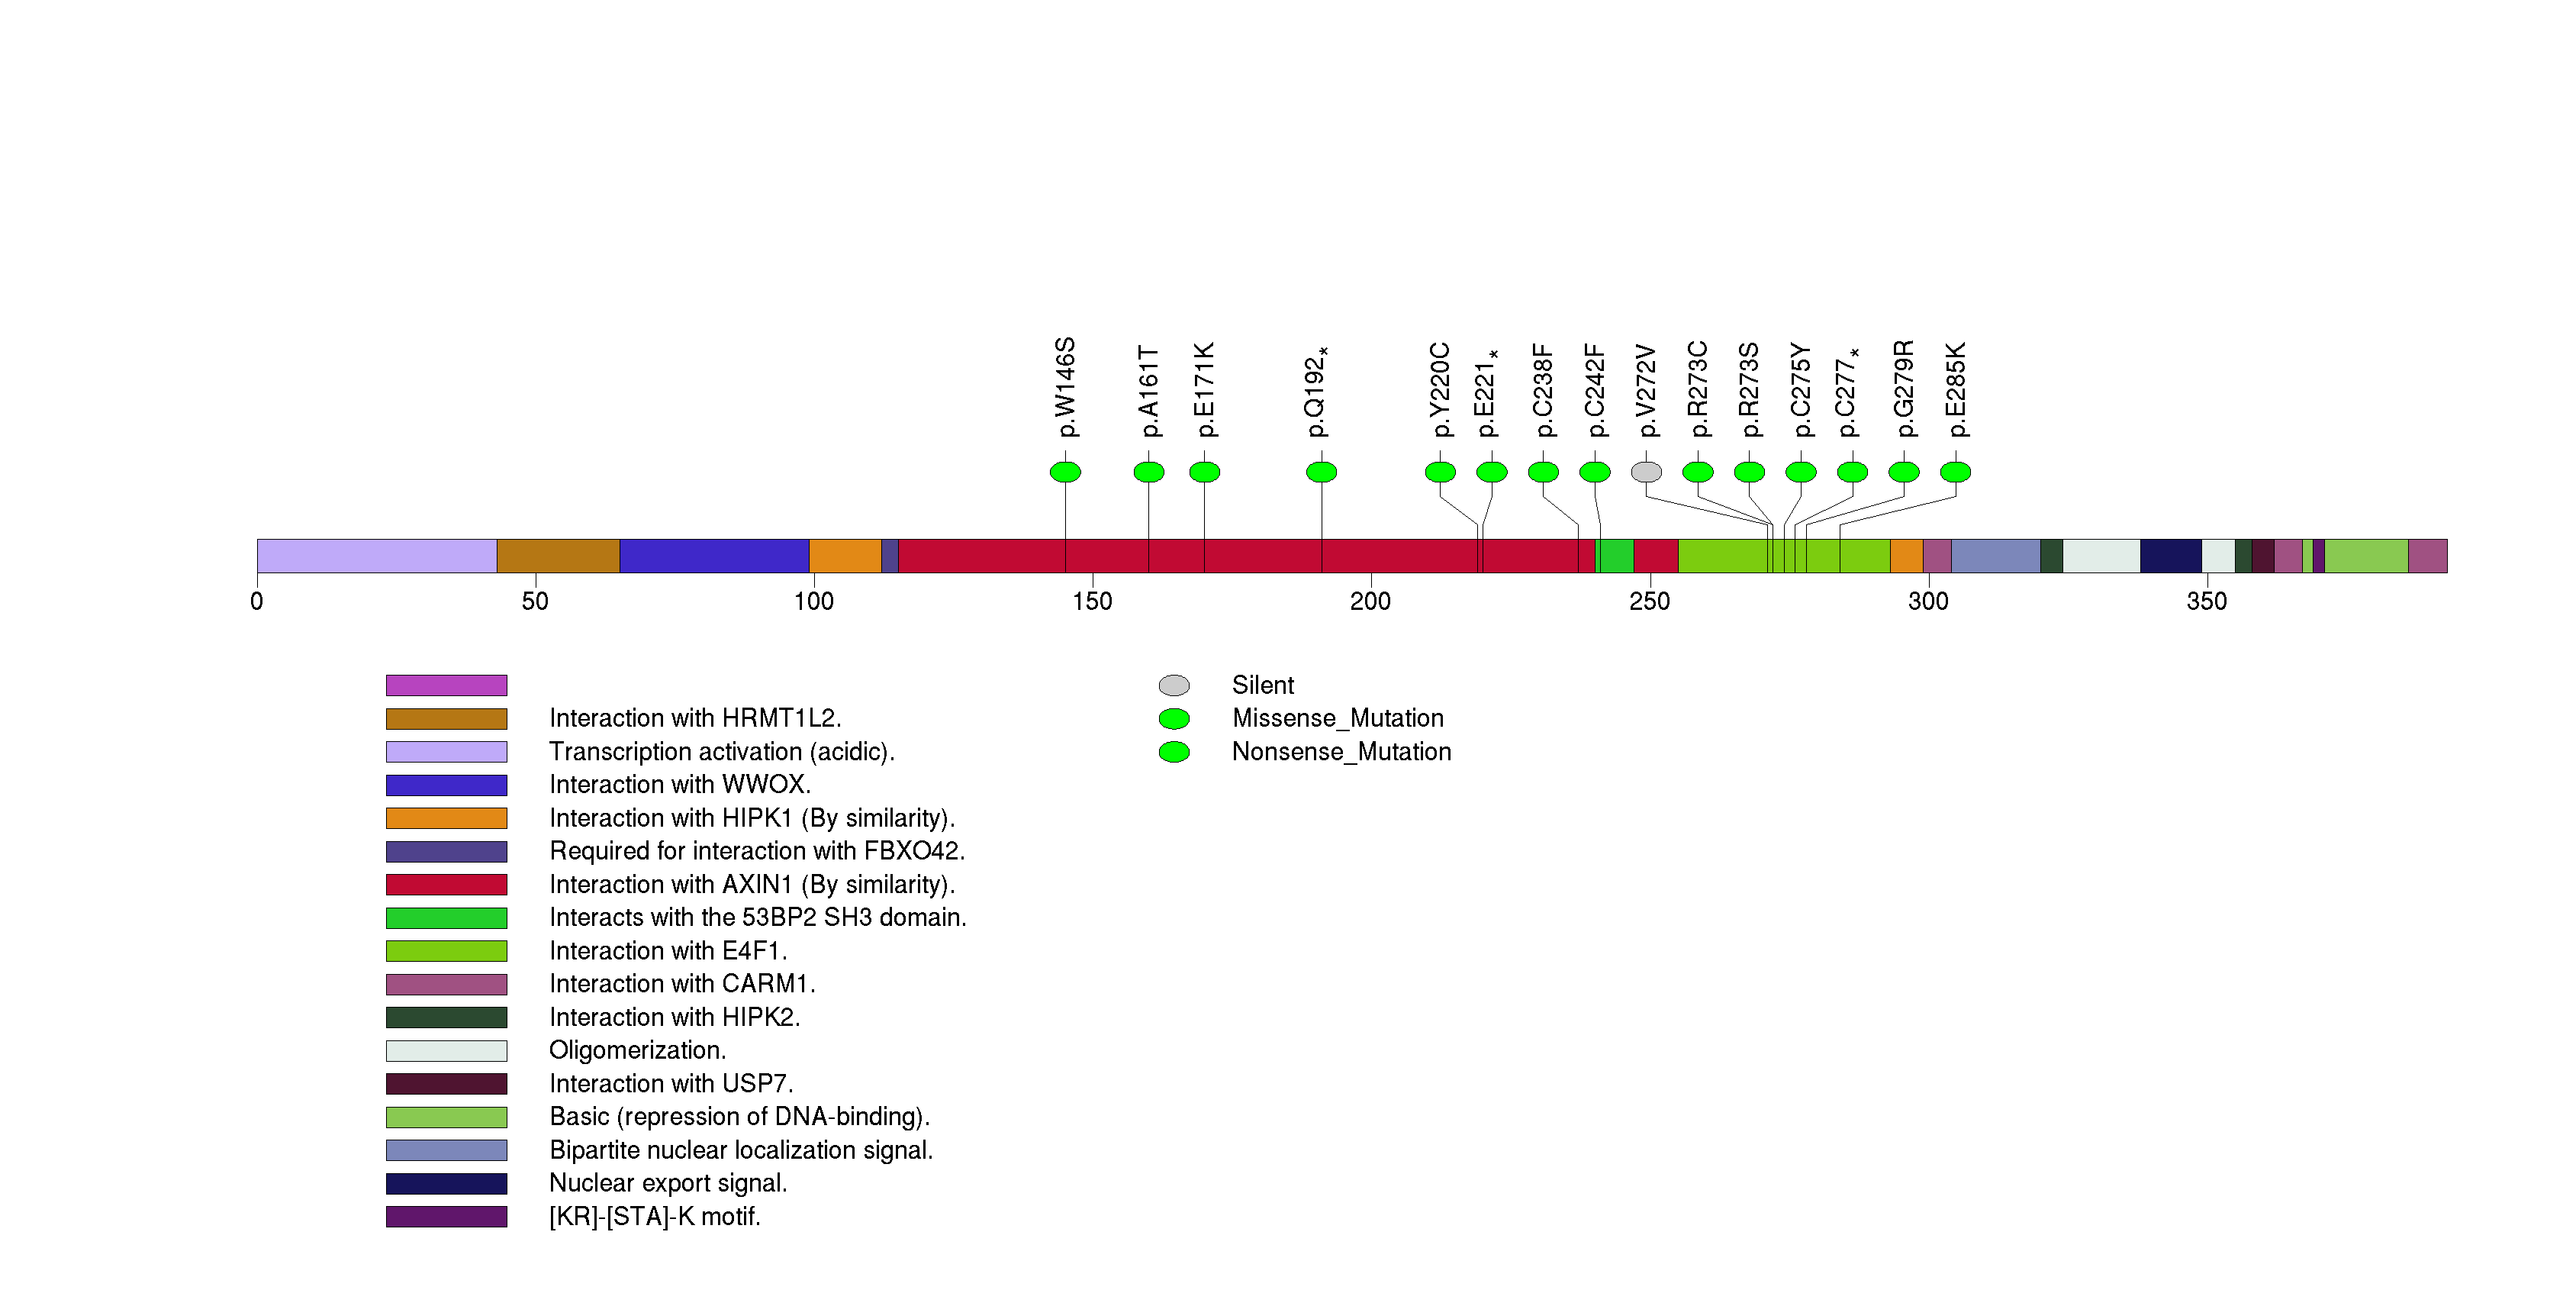
Figure S2. This figure depicts the distribution of mutations and mutation types across the FBXW7 significant gene.
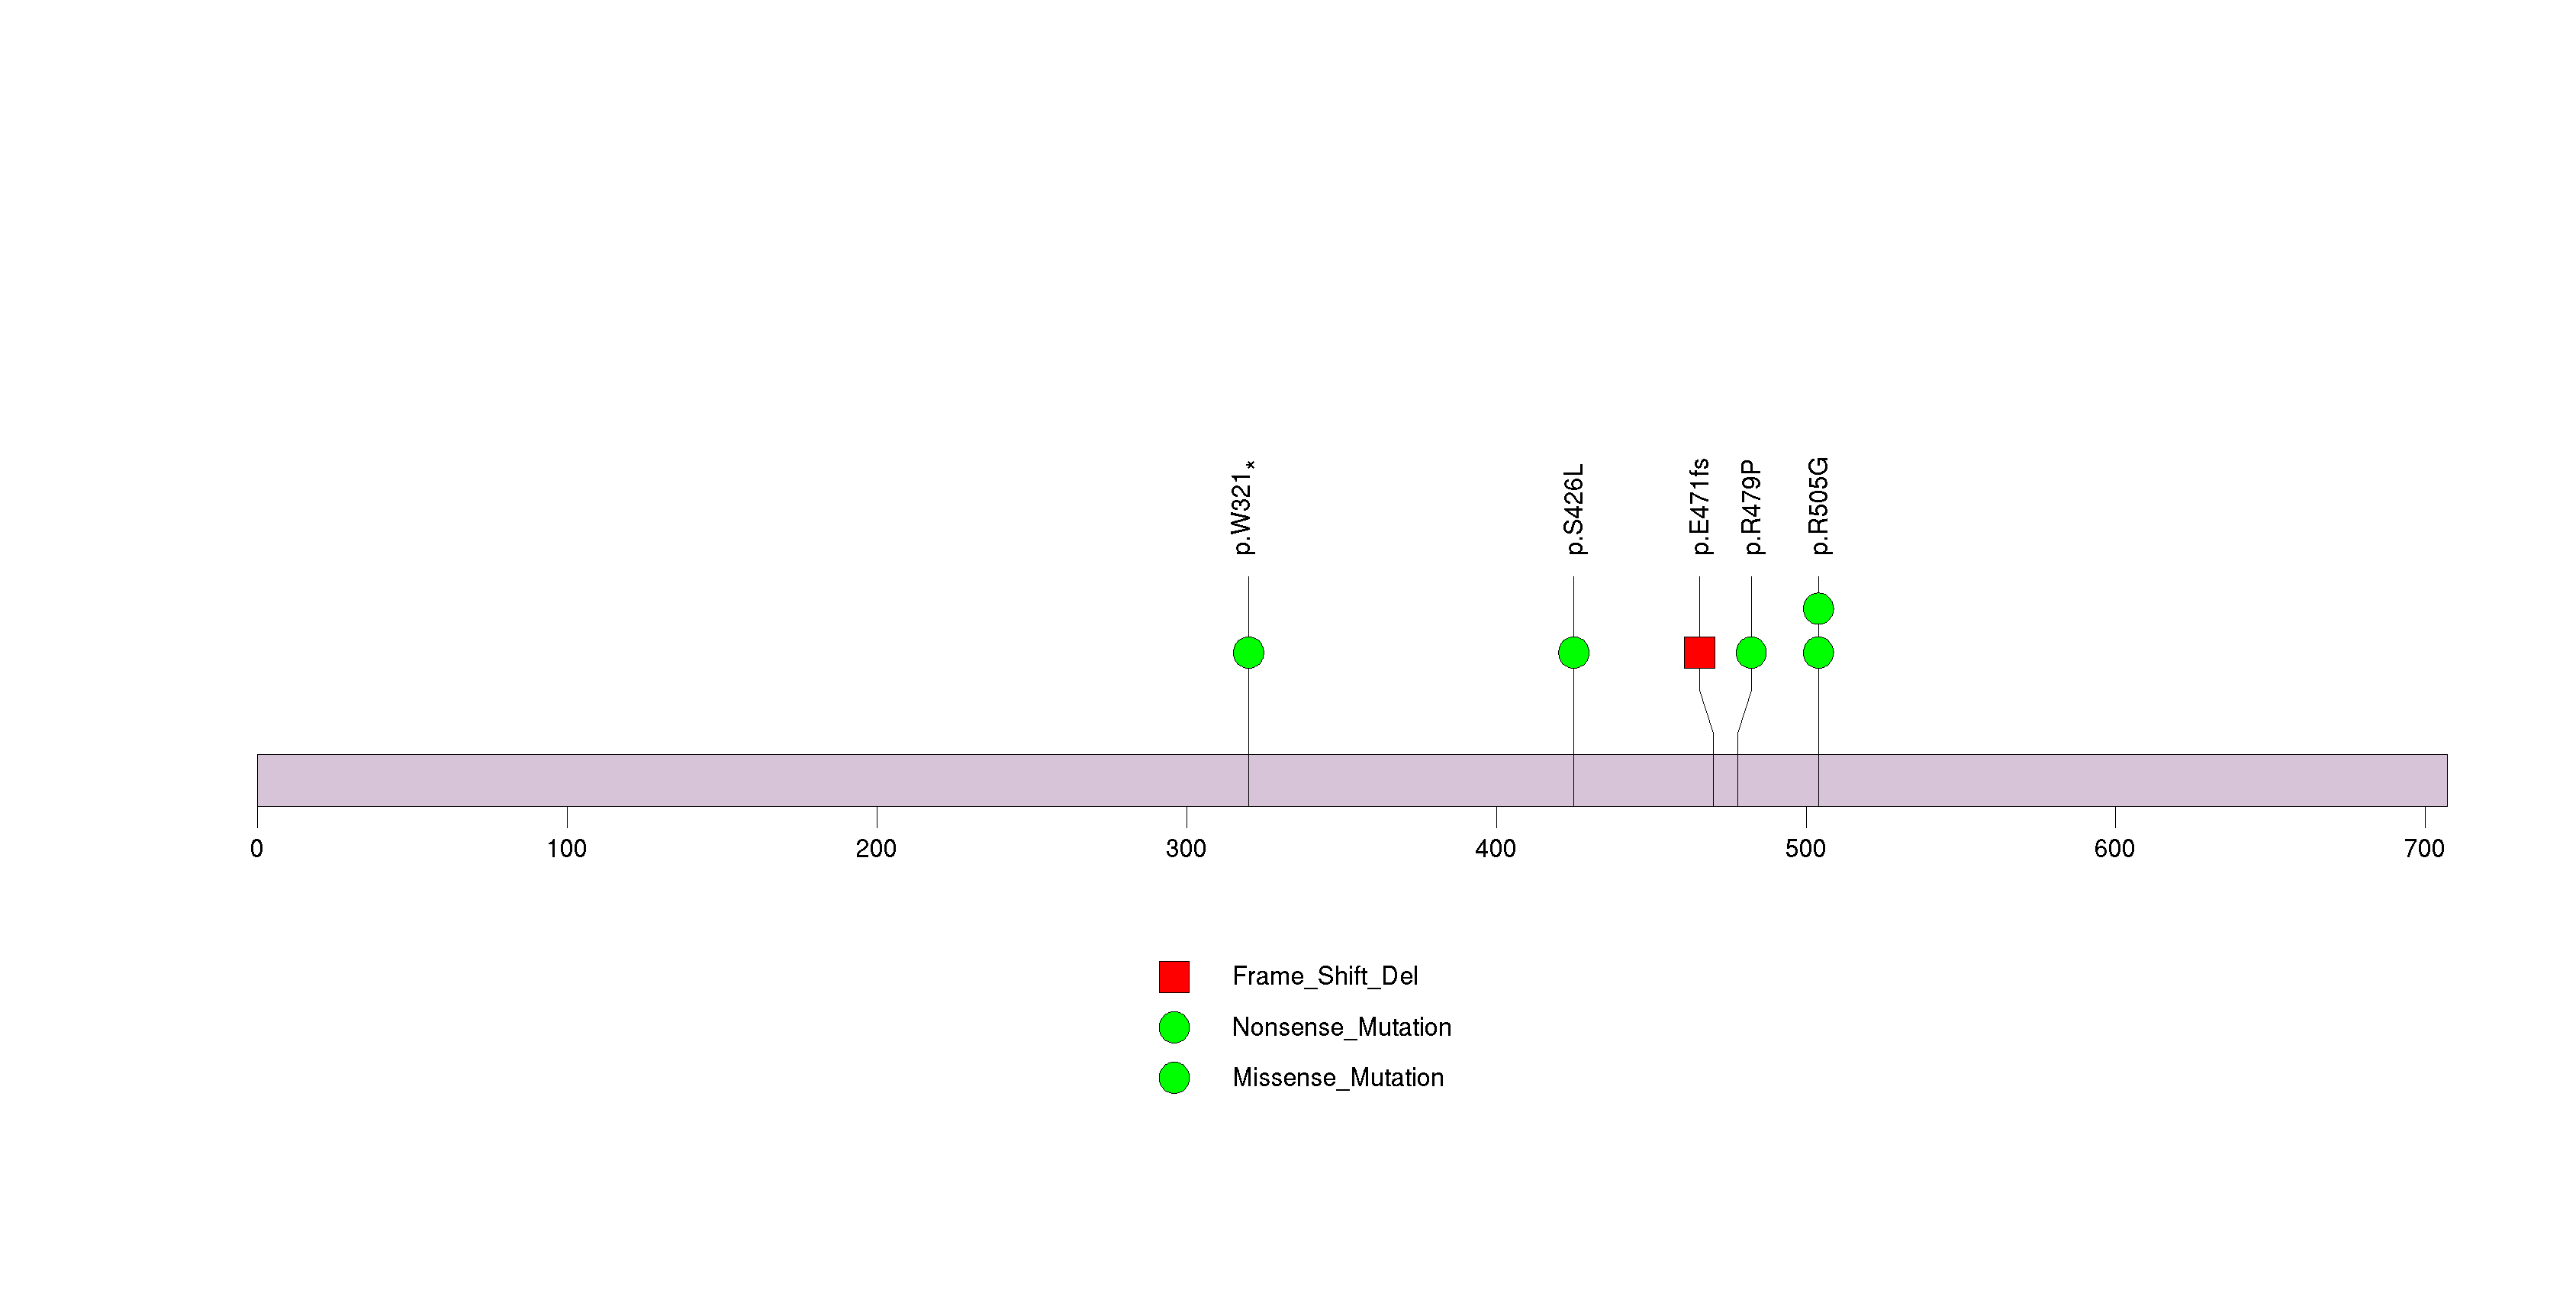
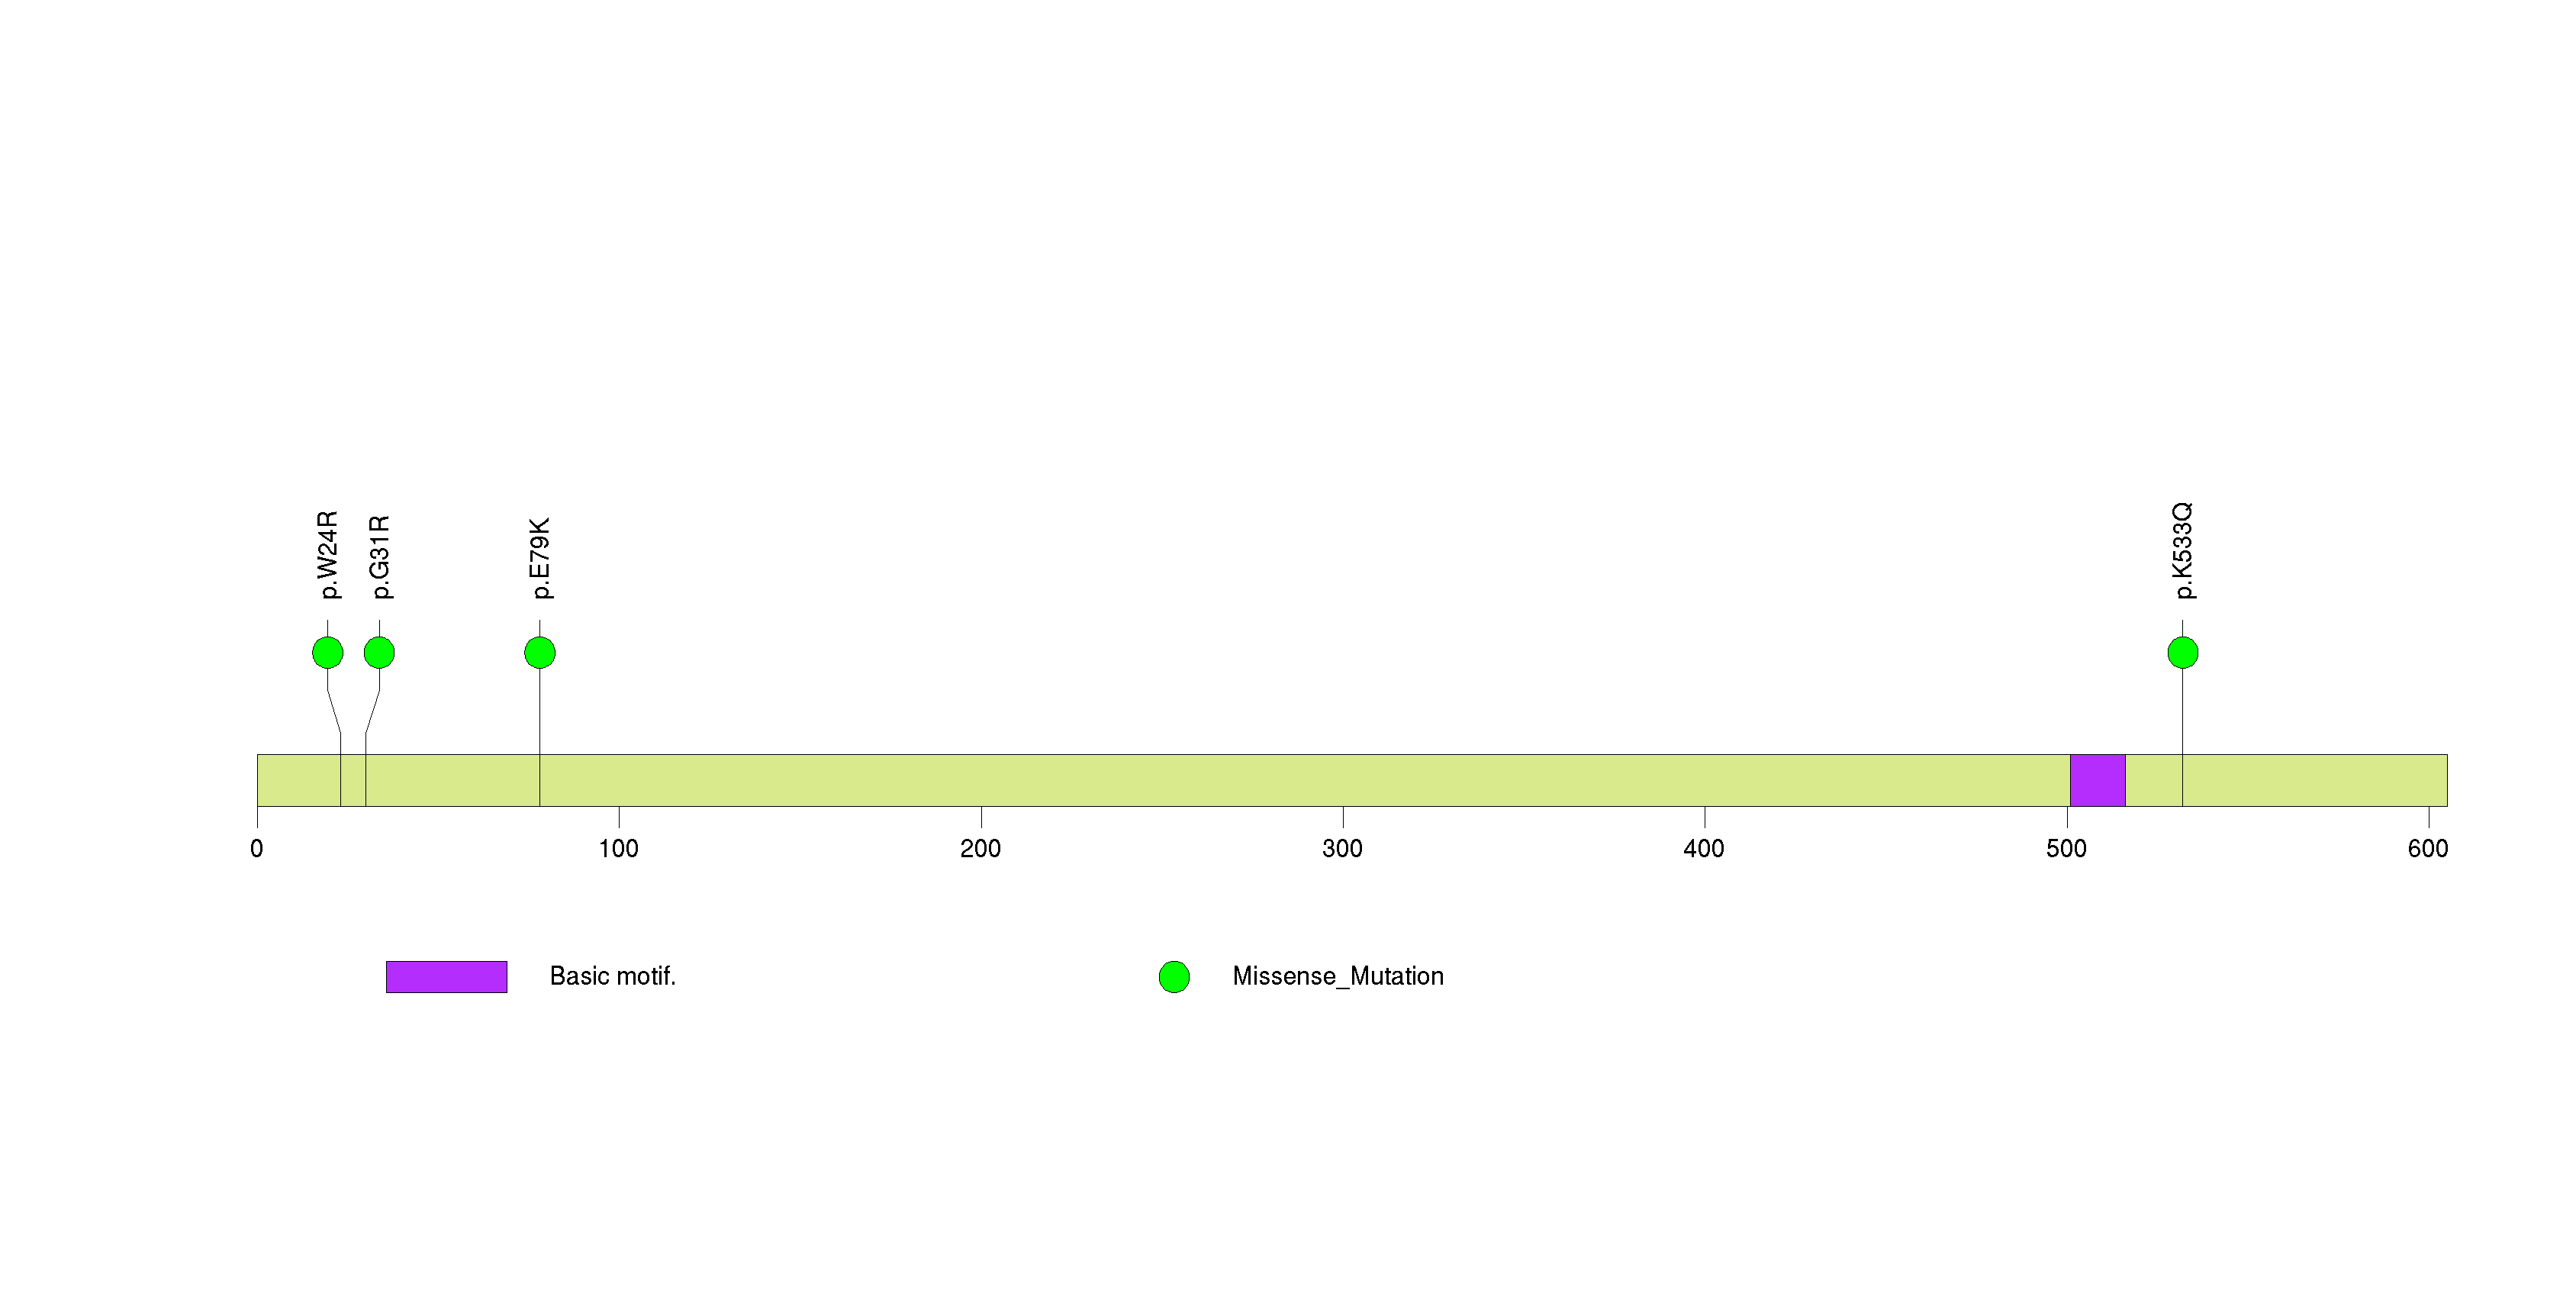
Figure S3. This figure depicts the distribution of mutations and mutation types across the NFE2L2 significant gene.
In this analysis, COSMIC is used as a filter to increase power by restricting the territory of each gene. Cosmic version: v48.
Table 4. Get Full Table Significantly mutated genes (COSMIC territory only). To access the database please go to: COSMIC. Number of significant genes found: 3. Number of genes displayed: 10
| rank | gene | description | n | cos | n_cos | N_cos | cos_ev | p | q |
|---|---|---|---|---|---|---|---|---|---|
| 1 | TP53 | tumor protein p53 | 14 | 356 | 14 | 9968 | 2964 | 1e-13 | 4.6e-10 |
| 2 | FBXW7 | F-box and WD repeat domain containing 7 | 6 | 91 | 4 | 2548 | 102 | 3.3e-09 | 7.6e-06 |
| 3 | FGFR3 | fibroblast growth factor receptor 3 (achondroplasia, thanatophoric dwarfism) | 2 | 62 | 2 | 1736 | 216 | 0.000066 | 0.099 |
| 4 | DPYSL4 | dihydropyrimidinase-like 4 | 1 | 1 | 1 | 28 | 2 | 0.00019 | 0.17 |
| 5 | TBC1D8B | TBC1 domain family, member 8B (with GRAM domain) | 2 | 1 | 1 | 28 | 1 | 0.00019 | 0.17 |
| 6 | BMX | BMX non-receptor tyrosine kinase | 2 | 2 | 1 | 56 | 2 | 0.00037 | 0.24 |
| 7 | GABRA6 | gamma-aminobutyric acid (GABA) A receptor, alpha 6 | 2 | 2 | 1 | 56 | 1 | 0.00037 | 0.24 |
| 8 | BAZ1A | bromodomain adjacent to zinc finger domain, 1A | 1 | 4 | 1 | 112 | 1 | 0.00074 | 0.32 |
| 9 | PHIP | pleckstrin homology domain interacting protein | 3 | 4 | 1 | 112 | 1 | 0.00074 | 0.32 |
| 10 | SCN9A | sodium channel, voltage-gated, type IX, alpha subunit | 1 | 4 | 1 | 112 | 1 | 0.00074 | 0.32 |
Note:
n - number of (nonsilent) mutations in this gene across the individual set.
cos = number of unique mutated sites in this gene in COSMIC
n_cos = overlap between n and cos.
N_cos = number of individuals times cos.
cos_ev = total evidence: number of reports in COSMIC for mutations seen in this gene.
p = p-value for seeing the observed amount of overlap in this gene)
q = q-value, False Discovery Rate (Benjamini-Hochberg procedure)
Table 5. Get Full Table Genes with Clustered Mutations
| num | gene | desc | n | mindist | nmuts0 | nmuts3 | nmuts12 | npairs0 | npairs3 | npairs12 |
|---|---|---|---|---|---|---|---|---|---|---|
| 4056 | ZNF814 | zinc finger protein 814 | 3 | 0 | 3 | 3 | 3 | 3 | 3 | 3 |
| 3618 | TP53 | tumor protein p53 | 14 | 0 | 1 | 6 | 18 | 1 | 6 | 18 |
| 668 | CDH8 | cadherin 8, type 2 | 3 | 0 | 1 | 1 | 1 | 1 | 1 | 1 |
| 828 | CORO2B | coronin, actin binding protein, 2B | 2 | 0 | 1 | 1 | 1 | 1 | 1 | 1 |
| 862 | CRYBB1 | crystallin, beta B1 | 2 | 0 | 1 | 1 | 1 | 1 | 1 | 1 |
| 890 | CUL1 | cullin 1 | 4 | 0 | 1 | 1 | 1 | 1 | 1 | 1 |
| 1287 | FBXW7 | F-box and WD repeat domain containing 7 | 6 | 0 | 1 | 1 | 1 | 1 | 1 | 1 |
| 1300 | FGA | fibrinogen alpha chain | 5 | 0 | 1 | 1 | 1 | 1 | 1 | 1 |
| 1356 | FOXRED2 | FAD-dependent oxidoreductase domain containing 2 | 2 | 0 | 1 | 1 | 1 | 1 | 1 | 1 |
| 1712 | INPP4B | inositol polyphosphate-4-phosphatase, type II, 105kDa | 2 | 0 | 1 | 1 | 1 | 1 | 1 | 1 |
Note:
n - number of mutations in this gene in the individual set.
mindist - distance (in aa) between closest pair of mutations in this gene
npairs3 - how many pairs of mutations are within 3 aa of each other.
npairs12 - how many pairs of mutations are within 12 aa of each other.
Table 6. Get Full Table A Ranked List of Significantly Mutated Genesets. (Source: MSigDB GSEA Cannonical Pathway Set).Number of significant genesets found: 17. Number of genesets displayed: 10
| rank | geneset | description | genes | N_genes | mut_tally | N | n | npat | nsite | nsil | n1 | n2 | n3 | n4 | n5 | n6 | p_ns_s | p | q |
|---|---|---|---|---|---|---|---|---|---|---|---|---|---|---|---|---|---|---|---|
| 1 | TIDPATHWAY | On ligand binding, interferon gamma receptors stimulate JAK2 kinase to phosphorylate STAT transcription factors, which promote expression of interferon responsive genes. | DNAJA3, HSPA1A, IFNG, IFNGR1, IFNGR2, IKBKB, JAK2, LIN7A, NFKB1, NFKBIA, RB1, RELA, TIP-1, TNF, TNFRSF1A, TNFRSF1B, TP53, USH1C, WT1 | 18 | IFNGR2(1), JAK2(1), RB1(2), RELA(1), TNFRSF1B(1), TP53(14), USH1C(1) | 754587 | 21 | 15 | 19 | 1 | 5 | 1 | 9 | 1 | 4 | 1 | 0.023 | 2.3e-08 | 0.000014 |
| 2 | PMLPATHWAY | Ring-shaped PML nuclear bodies regulate transcription and are required co-activators in p53- and DAXX-mediated apoptosis. | CREBBP, DAXX, HRAS, PAX3, PML, PRAM-1, RARA, RB1, SIRT1, SP100, TNF, TNFRSF1A, TNFRSF1B, TNFRSF6, TNFSF6, TP53, UBL1 | 13 | CREBBP(5), DAXX(1), PML(3), RARA(2), RB1(2), SP100(1), TNFRSF1B(1), TP53(14) | 792662 | 29 | 17 | 27 | 2 | 7 | 0 | 13 | 1 | 7 | 1 | 0.012 | 7.1e-08 | 0.000022 |
| 3 | RNAPATHWAY | dsRNA-activated protein kinase phosphorylates elF2a, which generally inhibits translation, and activates NF-kB to provoke inflammation. | CHUK, DNAJC3, EIF2S1, EIF2S2, MAP3K14, NFKB1, NFKBIA, PRKR, RELA, TP53 | 9 | DNAJC3(1), RELA(1), TP53(14) | 408205 | 16 | 12 | 15 | 1 | 4 | 0 | 8 | 1 | 3 | 0 | 0.085 | 3.5e-07 | 0.000071 |
| 4 | TERTPATHWAY | hTERC, the RNA subunit of telomerase, and hTERT, the catalytic protein subunit, are required for telomerase activity and are overexpressed in many cancers. | HDAC1, MAX, MYC, SP1, SP3, TP53, WT1, ZNF42 | 7 | SP3(2), TP53(14) | 292760 | 16 | 12 | 15 | 2 | 4 | 0 | 8 | 1 | 3 | 0 | 0.19 | 9.9e-07 | 0.00015 |
| 5 | FBW7PATHWAY | Cyclin E interacts with cell cycle checkpoint kinase cdk2 to allow transcription of genes required for S phase, including transcription of additional cyclin E. | CCNE1, CDC34, CDK2, CUL1, E2F1, FBXW7, RB1, SKP1A, TFDP1 | 8 | CUL1(4), FBXW7(6), RB1(2) | 343289 | 12 | 9 | 9 | 0 | 5 | 0 | 3 | 0 | 3 | 1 | 0.06 | 6.6e-06 | 0.00082 |
| 6 | RBPATHWAY | The ATM protein kinase recognizes DNA damage and blocks cell cycle progression by phosphorylating chk1 and p53, which normally inhibits Rb to allow G1/S transitions. | ATM, CDC2, CDC25A, CDC25B, CDC25C, CDK2, CDK4, CHEK1, MYT1, RB1, TP53, WEE1, YWHAH | 12 | ATM(3), RB1(2), TP53(14), WEE1(1) | 734757 | 20 | 16 | 18 | 3 | 3 | 0 | 9 | 2 | 5 | 1 | 0.3 | 0.000032 | 0.0032 |
| 7 | PLK3PATHWAY | Active Plk3 phosphorylates CDC25c, blocking the G2/M transition, and phosphorylates p53 to induce apoptosis. | ATM, ATR, CDC25C, CHEK1, CHEK2, CNK, TP53, YWHAH | 7 | ATM(3), ATR(3), TP53(14) | 670310 | 20 | 13 | 19 | 2 | 6 | 0 | 9 | 2 | 3 | 0 | 0.18 | 0.000078 | 0.0068 |
| 8 | SA_G1_AND_S_PHASES | Cdk2, 4, and 6 bind cyclin D in G1, while cdk2/cyclin E promotes the G1/S transition. | ARF1, ARF3, CCND1, CDK2, CDK4, CDKN1A, CDKN1B, CDKN2A, CFL1, E2F1, E2F2, MDM2, NXT1, PRB1, TP53 | 15 | CCND1(1), CDKN1A(2), E2F2(1), TP53(14) | 345627 | 18 | 12 | 17 | 3 | 4 | 0 | 9 | 2 | 3 | 0 | 0.22 | 0.00017 | 0.013 |
| 9 | ARFPATHWAY | Cyclin-dependent kinase inhibitor 2A is a tumor suppressor that induces G1 arrest and can activate the p53 pathway, leading to G2/M arrest. | ABL1, CDKN2A, E2F1, MDM2, MYC, PIK3CA, PIK3R1, POLR1A, POLR1B, POLR1C, POLR1D, RAC1, RB1, TBX2, TP53, TWIST1 | 16 | ABL1(1), PIK3CA(3), PIK3R1(1), RB1(2), TP53(14) | 838723 | 21 | 13 | 19 | 3 | 5 | 1 | 9 | 1 | 4 | 1 | 0.16 | 0.00031 | 0.021 |
| 10 | G1PATHWAY | CDK4/6-cyclin D and CDK2-cyclin E phosphorylate Rb, which allows the transcription of genes needed for the G1/S cell cycle transition. | ABL1, ATM, ATR, CCNA1, CCND1, CCNE1, CDC2, CDC25A, CDK2, CDK4, CDK6, CDKN1A, CDKN1B, CDKN2A, CDKN2B, DHFR, E2F1, GSK3B, HDAC1, MADH3, MADH4, RB1, SKP2, TFDP1, TGFB1, TGFB2, TGFB3, TP53 | 25 | ABL1(1), ATM(3), ATR(3), CCND1(1), CDK6(1), CDKN1A(2), RB1(2), TP53(14) | 1250337 | 27 | 17 | 25 | 3 | 10 | 0 | 10 | 2 | 4 | 1 | 0.079 | 0.00035 | 0.021 |
Table 7. Get Full Table A Ranked List of Significantly Mutated Genesets (Excluding Significantly Mutated Genes). Number of significant genesets found: 0. Number of genesets displayed: 10
| rank | geneset | description | genes | N_genes | mut_tally | N | n | npat | nsite | nsil | n1 | n2 | n3 | n4 | n5 | n6 | p_ns_s | p | q |
|---|---|---|---|---|---|---|---|---|---|---|---|---|---|---|---|---|---|---|---|
| 1 | CTLPATHWAY | Cytotoxic T lymphocytes induce apoptosis in infected cells presenting antigen-MHC-I complexes via the perforin and Fas/Fas ligand pathways. | B2M, CD3D, CD3E, CD3G, CD3Z, GZMB, HLA-A, ICAM1, ITGAL, ITGB2, PRF1, TNFRSF6, TNFSF6, TRA@, TRB@ | 10 | B2M(1), GZMB(1), HLA-A(3), ICAM1(1), PRF1(3) | 363702 | 9 | 8 | 9 | 1 | 2 | 0 | 4 | 1 | 2 | 0 | 0.25 | 0.00042 | 0.1 |
| 2 | D4GDIPATHWAY | D4-GDI inhibits the pro-apoptotic Rho GTPases and is cleaved by caspase-3. | ADPRT, APAF1, ARHGAP5, ARHGDIB, CASP1, CASP10, CASP3, CASP8, CASP9, CYCS, GZMB, JUN, PRF1 | 12 | ARHGAP5(4), CASP8(2), GZMB(1), PRF1(3) | 537688 | 10 | 9 | 10 | 1 | 1 | 0 | 5 | 4 | 0 | 0 | 0.28 | 0.00058 | 0.1 |
| 3 | PMLPATHWAY | Ring-shaped PML nuclear bodies regulate transcription and are required co-activators in p53- and DAXX-mediated apoptosis. | CREBBP, DAXX, HRAS, PAX3, PML, PRAM-1, RARA, RB1, SIRT1, SP100, TNF, TNFRSF1A, TNFRSF1B, TNFRSF6, TNFSF6, TP53, UBL1 | 12 | CREBBP(5), DAXX(1), PML(3), RARA(2), RB1(2), SP100(1), TNFRSF1B(1) | 758156 | 15 | 11 | 14 | 1 | 5 | 0 | 5 | 0 | 4 | 1 | 0.074 | 0.00062 | 0.1 |
| 4 | FBW7PATHWAY | Cyclin E interacts with cell cycle checkpoint kinase cdk2 to allow transcription of genes required for S phase, including transcription of additional cyclin E. | CCNE1, CDC34, CDK2, CUL1, E2F1, FBXW7, RB1, SKP1A, TFDP1 | 7 | CUL1(4), RB1(2) | 274624 | 6 | 6 | 4 | 0 | 3 | 0 | 1 | 0 | 1 | 1 | 0.2 | 0.00067 | 0.1 |
| 5 | IL7PATHWAY | IL-7 is required for B and T cell development and proliferation and may contribute to activation of VDJ recombination. | BCL2, CREBBP, EP300, FYN, IL2RG, IL7, IL7R, JAK1, JAK3, LCK, NMI, PIK3CA, PIK3R1, PTK2B, STAT5A, STAT5B | 16 | CREBBP(5), EP300(3), IL2RG(1), JAK1(1), LCK(1), PIK3CA(3), PIK3R1(1), STAT5B(1) | 1162044 | 16 | 14 | 16 | 2 | 5 | 1 | 5 | 2 | 3 | 0 | 0.17 | 0.002 | 0.19 |
| 6 | SKP2E2FPATHWAY | E2F-1, a transcription factor that promotes the G1/S transition, is repressed by Rb and activated by cdk2/cyclin E. | CCNA1, CCNE1, CDC34, CDK2, CUL1, E2F1, RB1, SKP1A, SKP2, TFDP1 | 9 | CUL1(4), RB1(2) | 356034 | 6 | 6 | 4 | 1 | 3 | 0 | 1 | 0 | 1 | 1 | 0.48 | 0.0025 | 0.19 |
| 7 | P27PATHWAY | p27 blocks the G1/S transition by inhibiting the checkpoint kinase cdk2/cyclin E and is inhibited by cdk2-mediated ubiquitination. | CCNE1, CDK2, CDKN1B, CKS1B, CUL1, E2F1, NEDD8, RB1, RBX1, SKP1A, SKP2, TFDP1, UBE2M | 12 | CUL1(4), RB1(2) | 357550 | 6 | 6 | 4 | 0 | 3 | 0 | 1 | 0 | 1 | 1 | 0.2 | 0.0025 | 0.19 |
| 8 | PDGFPATHWAY | Platelet-derived growth factor (PDGF) receptor is phosphorylated on ligand binding and promotes cell proliferation. | CSNK2A1, ELK1, FOS, GRB2, HRAS, JAK1, JUN, MAP2K1, MAP2K4, MAP3K1, MAPK3, MAPK8, PDGFA, PDGFRA, PIK3CA, PIK3R1, PLCG1, PRKCA, PRKCB1, RAF1, RASA1, SHC1, SOS1, SRF, STAT1, STAT3, STAT5A | 26 | CSNK2A1(1), FOS(1), JAK1(1), MAP2K1(1), MAP3K1(2), MAPK8(2), PDGFRA(1), PIK3CA(3), PIK3R1(1), PLCG1(2), RASA1(1), SOS1(2), STAT1(1) | 1449993 | 19 | 14 | 19 | 1 | 11 | 1 | 4 | 2 | 1 | 0 | 0.036 | 0.0026 | 0.19 |
| 9 | RAC1PATHWAY | Rac-1 is a Rho family G protein that stimulates formation of actin-dependent structures such as filopodia and lamellopodia. | ARFIP2, CDK5, CDK5R1, CFL1, CHN1, LIMK1, MAP3K1, MYL2, MYLK, NCF2, PAK1, PDGFRA, PIK3CA, PIK3R1, PLD1, PPP1R12B, RAC1, RALBP1, RPS6KB1, TRIO, VAV1, WASF1 | 22 | CDK5(1), CHN1(1), MAP3K1(2), MYLK(2), NCF2(2), PDGFRA(1), PIK3CA(3), PIK3R1(1), PPP1R12B(1), TRIO(4) | 1450712 | 18 | 14 | 18 | 0 | 8 | 2 | 5 | 1 | 2 | 0 | 0.0088 | 0.003 | 0.19 |
| 10 | TPOPATHWAY | Thrombopoietin binds to its receptor and activates cell growth through the Erk and JNK MAP kinase pathways, protein kinase C, and JAK/STAT activation. | CSNK2A1, FOS, GRB2, HRAS, JAK2, JUN, MAP2K1, MAPK3, MPL, PIK3CA, PIK3R1, PLCG1, PRKCA, PRKCB1, RAF1, RASA1, SHC1, SOS1, STAT1, STAT3, STAT5A, STAT5B, THPO | 22 | CSNK2A1(1), FOS(1), JAK2(1), MAP2K1(1), MPL(1), PIK3CA(3), PIK3R1(1), PLCG1(2), RASA1(1), SOS1(2), STAT1(1), STAT5B(1) | 1245136 | 16 | 14 | 16 | 0 | 10 | 1 | 4 | 1 | 0 | 0 | 0.016 | 0.0034 | 0.19 |
In brief, we tabulate the number of mutations and the number of covered bases for each gene. The counts are broken down by mutation context category: four context categories that are discovered by MutSig, and one for indel and 'null' mutations, which include indels, nonsense mutations, splice-site mutations, and non-stop (read-through) mutations. For each gene, we calculate the probability of seeing the observed constellation of mutations, i.e. the product P1 x P2 x ... x Pm, or a more extreme one, given the background mutation rates calculated across the dataset. [1]
In addition to the links below, the full results of the analysis summarized in this report can also be downloaded programmatically using firehose_get, or interactively from either the Broad GDAC website or TCGA Data Coordination Center Portal.