This pipeline uses various statistical tests to identify mRNAs whose expression levels correlated to selected clinical features.
Testing the association between 18282 genes and 10 clinical features across 953 samples, statistically thresholded by Q value < 0.05, 10 clinical features related to at least one genes.
-
4 genes correlated to 'Time to Death'.
-
NFKBIA|4792 , PGK1|5230 , DIP2B|57609 , PARP3|10039
-
958 genes correlated to 'AGE'.
-
ESR1|2099 , TMEFF1|8577 , DSC2|1824 , LRFN5|145581 , TFPI2|7980 , ...
-
42 genes correlated to 'NEOPLASM.DISEASESTAGE'.
-
ABCA10|10349 , MMRN1|22915 , SDPR|8436 , GRRP1|79927 , LHFP|10186 , ...
-
27 genes correlated to 'PATHOLOGY.T.STAGE'.
-
NDNL2|56160 , ZMYM6|9204 , ERMN|57471 , C14ORF139|79686 , SELE|6401 , ...
-
11 genes correlated to 'PATHOLOGY.N.STAGE'.
-
HMSD|284293 , DAAM1|23002 , NR2F2|7026 , SNED1|25992 , RGS4|5999 , ...
-
113 genes correlated to 'PATHOLOGY.M.STAGE'.
-
PPIAL4G|644591 , CCDC130|81576 , NACA2|342538 , HOOK2|29911 , EXD3|54932 , ...
-
19 genes correlated to 'GENDER'.
-
NLGN4Y|22829 , ZFY|7544 , PRKY|5616 , SYT9|143425 , GSTA1|2938 , ...
-
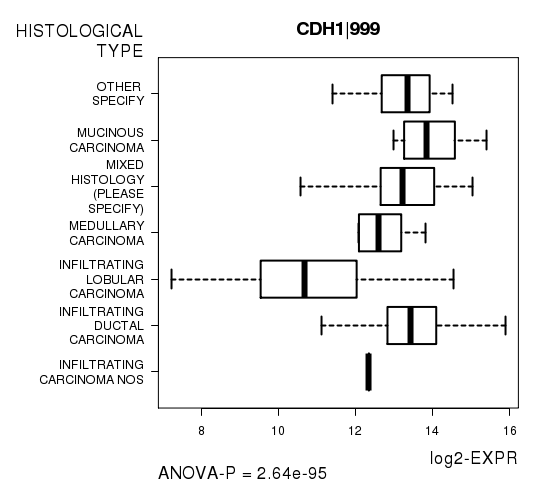
5610 genes correlated to 'HISTOLOGICAL.TYPE'.
-
CDH1|999 , RAPGEF3|10411 , USHBP1|83878 , AVPR2|554 , PSMD14|10213 , ...
-
2 genes correlated to 'RADIATIONS.RADIATION.REGIMENINDICATION'.
-
PCDH17|27253 , SELO|83642
-
4 genes correlated to 'NUMBER.OF.LYMPH.NODES'.
-
HMSD|284293 , SNED1|25992 , POU4F1|5457 , NUDT4|11163
Complete statistical result table is provided in Supplement Table 1
Table 1. Get Full Table This table shows the clinical features, statistical methods used, and the number of genes that are significantly associated with each clinical feature at Q value < 0.05.
| Clinical feature | Statistical test | Significant genes | Associated with | Associated with | ||
|---|---|---|---|---|---|---|
| Time to Death | Cox regression test | N=4 | shorter survival | N=2 | longer survival | N=2 |
| AGE | Spearman correlation test | N=958 | older | N=258 | younger | N=700 |
| NEOPLASM DISEASESTAGE | ANOVA test | N=42 | ||||
| PATHOLOGY T STAGE | Spearman correlation test | N=27 | higher stage | N=4 | lower stage | N=23 |
| PATHOLOGY N STAGE | Spearman correlation test | N=11 | higher stage | N=10 | lower stage | N=1 |
| PATHOLOGY M STAGE | ANOVA test | N=113 | ||||
| GENDER | t test | N=19 | male | N=8 | female | N=11 |
| HISTOLOGICAL TYPE | ANOVA test | N=5610 | ||||
| RADIATIONS RADIATION REGIMENINDICATION | t test | N=2 | yes | N=1 | no | N=1 |
| NUMBER OF LYMPH NODES | Spearman correlation test | N=4 | higher number.of.lymph.nodes | N=2 | lower number.of.lymph.nodes | N=2 |
Table S1. Basic characteristics of clinical feature: 'Time to Death'
| Time to Death | Duration (Months) | 0-234.2 (median=21.6) |
| censored | N = 788 | |
| death | N = 111 | |
| Significant markers | N = 4 | |
| associated with shorter survival | 2 | |
| associated with longer survival | 2 |
Table S2. Get Full Table List of 4 genes significantly associated with 'Time to Death' by Cox regression test
| HazardRatio | Wald_P | Q | C_index | |
|---|---|---|---|---|
| NFKBIA|4792 | 0.42 | 1.919e-07 | 0.0035 | 0.359 |
| PGK1|5230 | 1.97 | 6.694e-07 | 0.012 | 0.675 |
| DIP2B|57609 | 2.4 | 1.175e-06 | 0.021 | 0.595 |
| PARP3|10039 | 0.6 | 2.465e-06 | 0.045 | 0.355 |
Figure S1. Get High-res Image As an example, this figure shows the association of NFKBIA|4792 to 'Time to Death'. four curves present the cumulative survival rates of 4 quartile subsets of patients. P value = 1.92e-07 with univariate Cox regression analysis using continuous log-2 expression values.
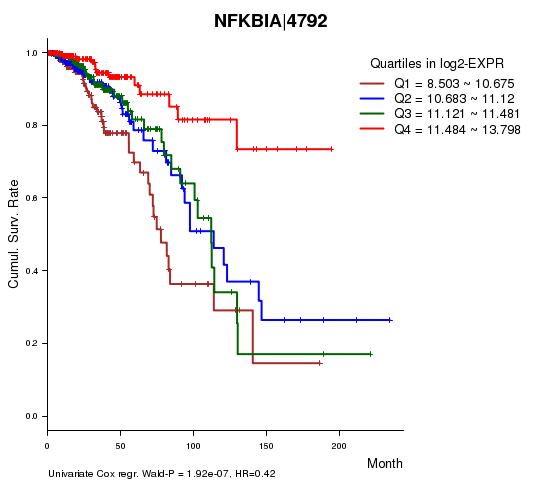
Table S3. Basic characteristics of clinical feature: 'AGE'
| AGE | Mean (SD) | 58.42 (13) |
| Significant markers | N = 958 | |
| pos. correlated | 258 | |
| neg. correlated | 700 |
Table S4. Get Full Table List of top 10 genes significantly correlated to 'AGE' by Spearman correlation test
| SpearmanCorr | corrP | Q | |
|---|---|---|---|
| ESR1|2099 | 0.3537 | 2.249e-29 | 4.11e-25 |
| TMEFF1|8577 | -0.2642 | 1.218e-16 | 2.23e-12 |
| DSC2|1824 | -0.2567 | 9.213e-16 | 1.68e-11 |
| LRFN5|145581 | -0.2594 | 1.004e-15 | 1.84e-11 |
| TFPI2|7980 | -0.2547 | 2.096e-15 | 3.83e-11 |
| DZIP1|22873 | -0.2532 | 2.325e-15 | 4.25e-11 |
| LAMA1|284217 | -0.2414 | 4.759e-14 | 8.7e-10 |
| DIO2|1734 | -0.2411 | 4.988e-14 | 9.12e-10 |
| ZNF521|25925 | -0.2404 | 5.874e-14 | 1.07e-09 |
| FMO1|2326 | -0.2401 | 6.741e-14 | 1.23e-09 |
Figure S2. Get High-res Image As an example, this figure shows the association of ESR1|2099 to 'AGE'. P value = 2.25e-29 with Spearman correlation analysis. The straight line presents the best linear regression.
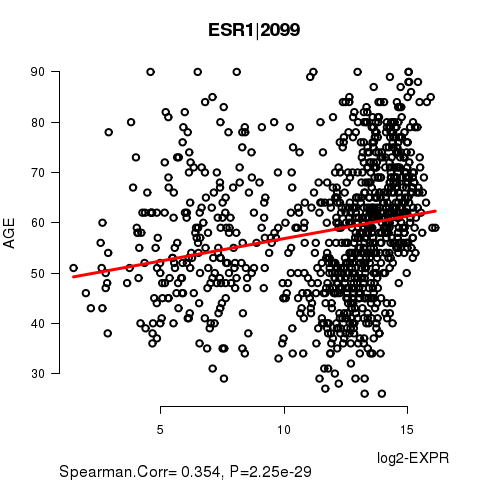
Table S5. Basic characteristics of clinical feature: 'NEOPLASM.DISEASESTAGE'
| NEOPLASM.DISEASESTAGE | Labels | N |
| STAGE I | 77 | |
| STAGE IA | 72 | |
| STAGE IB | 11 | |
| STAGE II | 9 | |
| STAGE IIA | 324 | |
| STAGE IIB | 217 | |
| STAGE III | 2 | |
| STAGE IIIA | 130 | |
| STAGE IIIB | 25 | |
| STAGE IIIC | 52 | |
| STAGE IV | 15 | |
| STAGE TIS | 1 | |
| STAGE X | 17 | |
| Significant markers | N = 42 |
Table S6. Get Full Table List of top 10 genes differentially expressed by 'NEOPLASM.DISEASESTAGE'
| ANOVA_P | Q | |
|---|---|---|
| ABCA10|10349 | 6.45e-09 | 0.000118 |
| MMRN1|22915 | 9.189e-09 | 0.000168 |
| SDPR|8436 | 1.485e-08 | 0.000271 |
| GRRP1|79927 | 2.23e-08 | 0.000408 |
| LHFP|10186 | 3.917e-08 | 0.000716 |
| ABCA9|10350 | 5.658e-08 | 0.00103 |
| SPARCL1|8404 | 5.694e-08 | 0.00104 |
| PGGT1B|5229 | 6.837e-08 | 0.00125 |
| C7|730 | 1.543e-07 | 0.00282 |
| ADCY4|196883 | 2.343e-07 | 0.00428 |
Figure S3. Get High-res Image As an example, this figure shows the association of ABCA10|10349 to 'NEOPLASM.DISEASESTAGE'. P value = 6.45e-09 with ANOVA analysis.
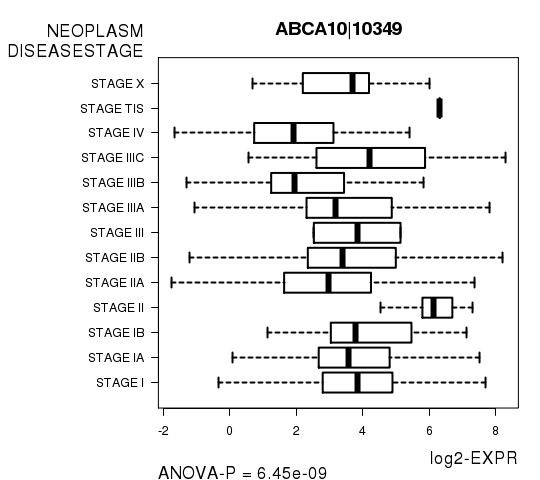
Table S7. Basic characteristics of clinical feature: 'PATHOLOGY.T.STAGE'
| PATHOLOGY.T.STAGE | Mean (SD) | 1.93 (0.72) |
| N | ||
| 1 | 251 | |
| 2 | 552 | |
| 3 | 113 | |
| 4 | 34 | |
| Significant markers | N = 27 | |
| pos. correlated | 4 | |
| neg. correlated | 23 |
Table S8. Get Full Table List of top 10 genes significantly correlated to 'PATHOLOGY.T.STAGE' by Spearman correlation test
| SpearmanCorr | corrP | Q | |
|---|---|---|---|
| NDNL2|56160 | -0.1768 | 4.147e-08 | 0.000758 |
| ZMYM6|9204 | -0.1755 | 5.156e-08 | 0.000943 |
| ERMN|57471 | -0.1717 | 1.052e-07 | 0.00192 |
| C14ORF139|79686 | -0.1653 | 2.991e-07 | 0.00547 |
| SELE|6401 | -0.1646 | 3.412e-07 | 0.00624 |
| TLR10|81793 | -0.1639 | 3.882e-07 | 0.00709 |
| CNN3|1266 | -0.1633 | 4.164e-07 | 0.00761 |
| ZNF167|55888 | -0.1613 | 5.892e-07 | 0.0108 |
| KIAA1217|56243 | -0.1609 | 6.234e-07 | 0.0114 |
| CCND2|894 | -0.1605 | 6.614e-07 | 0.0121 |
Figure S4. Get High-res Image As an example, this figure shows the association of NDNL2|56160 to 'PATHOLOGY.T.STAGE'. P value = 4.15e-08 with Spearman correlation analysis.
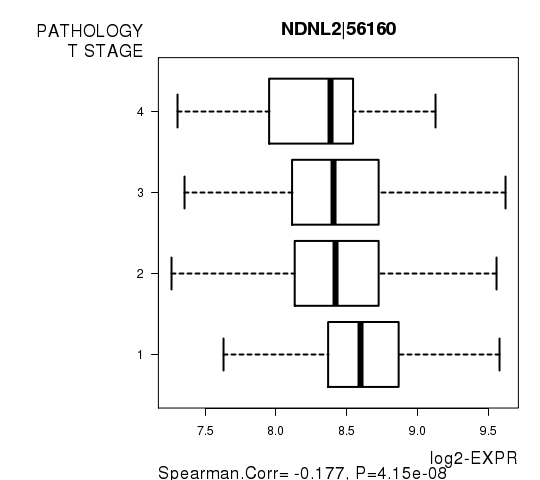
Table S9. Basic characteristics of clinical feature: 'PATHOLOGY.N.STAGE'
| PATHOLOGY.N.STAGE | Mean (SD) | 0.77 (0.9) |
| N | ||
| 0 | 450 | |
| 1 | 319 | |
| 2 | 106 | |
| 3 | 63 | |
| Significant markers | N = 11 | |
| pos. correlated | 10 | |
| neg. correlated | 1 |
Table S10. Get Full Table List of top 10 genes significantly correlated to 'PATHOLOGY.N.STAGE' by Spearman correlation test
| SpearmanCorr | corrP | Q | |
|---|---|---|---|
| HMSD|284293 | -0.2446 | 7.513e-09 | 0.000137 |
| DAAM1|23002 | 0.1665 | 2.946e-07 | 0.00539 |
| NR2F2|7026 | 0.1661 | 3.139e-07 | 0.00574 |
| SNED1|25992 | 0.1637 | 4.618e-07 | 0.00844 |
| RGS4|5999 | 0.1628 | 5.399e-07 | 0.00987 |
| F2R|2149 | 0.1624 | 5.714e-07 | 0.0104 |
| NUDT4|11163 | 0.1612 | 6.907e-07 | 0.0126 |
| SVEP1|79987 | 0.1606 | 7.762e-07 | 0.0142 |
| HTR2B|3357 | 0.1599 | 8.57e-07 | 0.0157 |
| BAHD1|22893 | 0.1541 | 2.129e-06 | 0.0389 |
Figure S5. Get High-res Image As an example, this figure shows the association of HMSD|284293 to 'PATHOLOGY.N.STAGE'. P value = 7.51e-09 with Spearman correlation analysis.
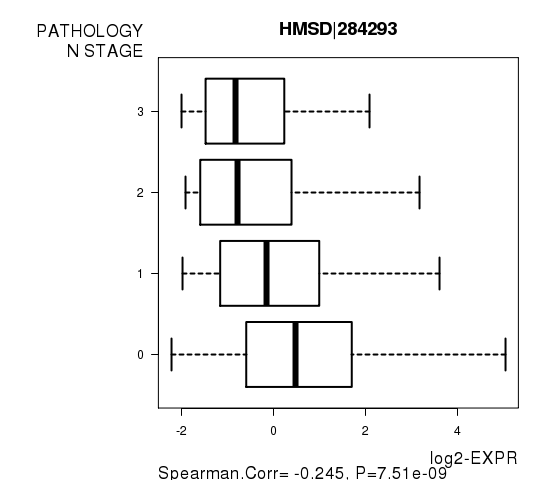
Table S11. Basic characteristics of clinical feature: 'PATHOLOGY.M.STAGE'
| PATHOLOGY.M.STAGE | Labels | N |
| CM0 (I+) | 2 | |
| M0 | 828 | |
| M1 | 15 | |
| MX | 108 | |
| Significant markers | N = 113 |
Table S12. Get Full Table List of top 10 genes differentially expressed by 'PATHOLOGY.M.STAGE'
| ANOVA_P | Q | |
|---|---|---|
| PPIAL4G|644591 | 4.859e-12 | 8.88e-08 |
| CCDC130|81576 | 1.217e-11 | 2.23e-07 |
| NACA2|342538 | 9.321e-11 | 1.7e-06 |
| HOOK2|29911 | 1.071e-10 | 1.96e-06 |
| EXD3|54932 | 4.874e-10 | 8.91e-06 |
| MAP2K7|5609 | 8.595e-10 | 1.57e-05 |
| VENTX|27287 | 9.357e-10 | 1.71e-05 |
| NEURL2|140825 | 1.226e-09 | 2.24e-05 |
| ID2B|84099 | 1.894e-09 | 3.46e-05 |
| AKAP8|10270 | 9.463e-09 | 0.000173 |
Figure S6. Get High-res Image As an example, this figure shows the association of PPIAL4G|644591 to 'PATHOLOGY.M.STAGE'. P value = 4.86e-12 with ANOVA analysis.
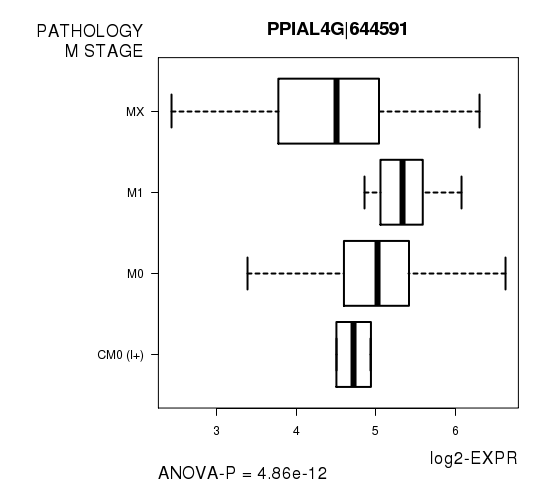
Table S13. Basic characteristics of clinical feature: 'GENDER'
| GENDER | Labels | N |
| FEMALE | 943 | |
| MALE | 10 | |
| Significant markers | N = 19 | |
| Higher in MALE | 8 | |
| Higher in FEMALE | 11 |
Table S14. Get Full Table List of top 10 genes differentially expressed by 'GENDER'
| T(pos if higher in 'MALE') | ttestP | Q | AUC | |
|---|---|---|---|---|
| NLGN4Y|22829 | 40.73 | 3.978e-13 | 7.16e-09 | 1 |
| ZFY|7544 | 36.08 | 1.318e-11 | 2.37e-07 | 1 |
| PRKY|5616 | 30.19 | 3.251e-11 | 5.85e-07 | 1 |
| SYT9|143425 | 13.68 | 2.925e-10 | 5.27e-06 | 0.7979 |
| GSTA1|2938 | -16.78 | 1.851e-08 | 0.000333 | 0.8942 |
| MYH16|84176 | -12.43 | 1.112e-07 | 0.002 | 0.8488 |
| RND2|8153 | 11.12 | 1.119e-07 | 0.00202 | 0.8371 |
| SUMF2|25870 | -8.63 | 1.561e-07 | 0.00281 | 0.7338 |
| RIMS4|140730 | 11.55 | 1.641e-07 | 0.00295 | 0.8772 |
| HTR4|3360 | -12.63 | 2.078e-07 | 0.00374 | 0.8039 |
Figure S7. Get High-res Image As an example, this figure shows the association of NLGN4Y|22829 to 'GENDER'. P value = 3.98e-13 with T-test analysis.
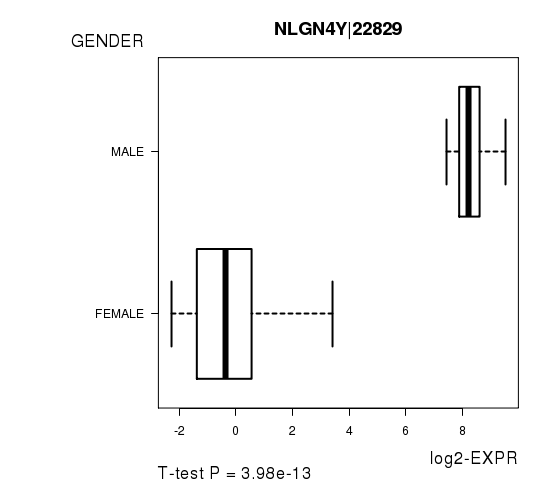
Table S15. Basic characteristics of clinical feature: 'HISTOLOGICAL.TYPE'
| HISTOLOGICAL.TYPE | Labels | N |
| INFILTRATING CARCINOMA NOS | 1 | |
| INFILTRATING DUCTAL CARCINOMA | 711 | |
| INFILTRATING LOBULAR CARCINOMA | 152 | |
| MEDULLARY CARCINOMA | 5 | |
| MIXED HISTOLOGY (PLEASE SPECIFY) | 27 | |
| MUCINOUS CARCINOMA | 14 | |
| OTHER SPECIFY | 42 | |
| Significant markers | N = 5610 |
Table S16. Get Full Table List of top 10 genes differentially expressed by 'HISTOLOGICAL.TYPE'
| ANOVA_P | Q | |
|---|---|---|
| CDH1|999 | 2.645e-95 | 4.84e-91 |
| RAPGEF3|10411 | 1.135e-43 | 2.07e-39 |
| USHBP1|83878 | 3.691e-41 | 6.75e-37 |
| AVPR2|554 | 9.55e-39 | 1.75e-34 |
| PSMD14|10213 | 2.076e-37 | 3.8e-33 |
| KANK3|256949 | 5.224e-37 | 9.55e-33 |
| MUSTN1|389125 | 9.243e-37 | 1.69e-32 |
| MUC2|4583 | 1.022e-36 | 1.87e-32 |
| BTG2|7832 | 1.796e-36 | 3.28e-32 |
| GPIHBP1|338328 | 2.139e-36 | 3.91e-32 |
Figure S8. Get High-res Image As an example, this figure shows the association of CDH1|999 to 'HISTOLOGICAL.TYPE'. P value = 2.64e-95 with ANOVA analysis.
2 genes related to 'RADIATIONS.RADIATION.REGIMENINDICATION'.
Table S17. Basic characteristics of clinical feature: 'RADIATIONS.RADIATION.REGIMENINDICATION'
| RADIATIONS.RADIATION.REGIMENINDICATION | Labels | N |
| NO | 231 | |
| YES | 722 | |
| Significant markers | N = 2 | |
| Higher in YES | 1 | |
| Higher in NO | 1 |
Table S18. Get Full Table List of 2 genes differentially expressed by 'RADIATIONS.RADIATION.REGIMENINDICATION'
| T(pos if higher in 'YES') | ttestP | Q | AUC | |
|---|---|---|---|---|
| PCDH17|27253 | -4.99 | 8.475e-07 | 0.0155 | 0.5922 |
| SELO|83642 | 4.9 | 1.306e-06 | 0.0239 | 0.5949 |
Figure S9. Get High-res Image As an example, this figure shows the association of PCDH17|27253 to 'RADIATIONS.RADIATION.REGIMENINDICATION'. P value = 8.47e-07 with T-test analysis.
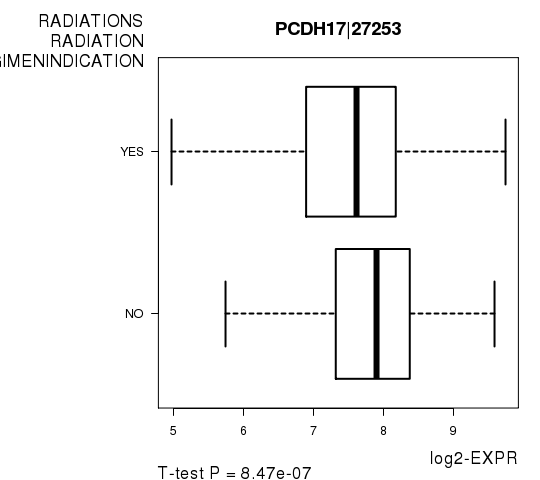
Table S19. Basic characteristics of clinical feature: 'NUMBER.OF.LYMPH.NODES'
| NUMBER.OF.LYMPH.NODES | Mean (SD) | 2.32 (4.6) |
| Significant markers | N = 4 | |
| pos. correlated | 2 | |
| neg. correlated | 2 |
Table S20. Get Full Table List of 4 genes significantly correlated to 'NUMBER.OF.LYMPH.NODES' by Spearman correlation test
| SpearmanCorr | corrP | Q | |
|---|---|---|---|
| HMSD|284293 | -0.267 | 3.955e-09 | 7.23e-05 |
| SNED1|25992 | 0.1798 | 3.11e-07 | 0.00568 |
| POU4F1|5457 | -0.2276 | 1.297e-06 | 0.0237 |
| NUDT4|11163 | 0.1691 | 1.536e-06 | 0.0281 |
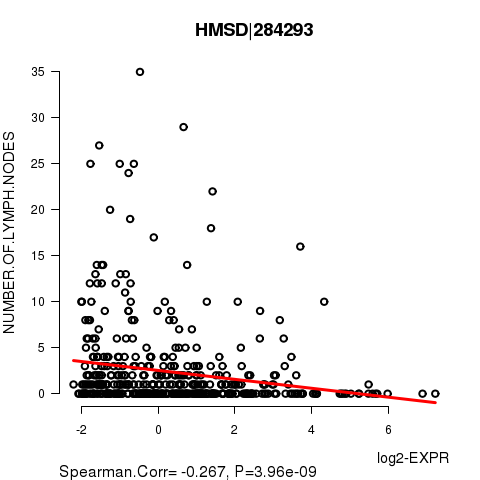
Figure S10. Get High-res Image As an example, this figure shows the association of HMSD|284293 to 'NUMBER.OF.LYMPH.NODES'. P value = 3.96e-09 with Spearman correlation analysis. The straight line presents the best linear regression.
-
Expresson data file = BRCA-TP.uncv2.mRNAseq_RSEM_normalized_log2.txt
-
Clinical data file = BRCA-TP.clin.merged.picked.txt
-
Number of patients = 953
-
Number of genes = 18282
-
Number of clinical features = 10
For survival clinical features, Wald's test in univariate Cox regression analysis with proportional hazards model (Andersen and Gill 1982) was used to estimate the P values using the 'coxph' function in R. Kaplan-Meier survival curves were plot using the four quartile subgroups of patients based on expression levels
For continuous numerical clinical features, Spearman's rank correlation coefficients (Spearman 1904) and two-tailed P values were estimated using 'cor.test' function in R
For multi-class clinical features (ordinal or nominal), one-way analysis of variance (Howell 2002) was applied to compare the log2-expression levels between different clinical classes using 'anova' function in R
For two-class clinical features, two-tailed Student's t test with unequal variance (Lehmann and Romano 2005) was applied to compare the log2-expression levels between the two clinical classes using 't.test' function in R
For multiple hypothesis correction, Q value is the False Discovery Rate (FDR) analogue of the P value (Benjamini and Hochberg 1995), defined as the minimum FDR at which the test may be called significant. We used the 'Benjamini and Hochberg' method of 'p.adjust' function in R to convert P values into Q values.
In addition to the links below, the full results of the analysis summarized in this report can also be downloaded programmatically using firehose_get, or interactively from either the Broad GDAC website or TCGA Data Coordination Center Portal.