This report serves to describe the mutational landscape and properties of a given individual set, as well as rank genes and genesets according to mutational significance. MutSig v2.0 and MutSigCV v0.9 merged result was used to generate the results found in this report.
-
Working with individual set: BRCA-TP
-
Number of patients in set: 772
The input for this pipeline is a set of individuals with the following files associated for each:
-
An annotated .maf file describing the mutations called for the respective individual, and their properties.
-
A .wig file that contains information about the coverage of the sample.
-
MAF used for this analysis:BRCA-TP.final_analysis_set.maf
-
Significantly mutated genes (q ≤ 0.1): 74
-
Mutations seen in COSMIC: 727
-
Significantly mutated genes in COSMIC territory: 15
-
Significantly mutated genesets: 122
-
Read 772 MAFs of type "WashU"
-
Total number of mutations in input MAFs: 47116
-
After removing 330 mutations outside chr1-24: 46786
-
After removing 1798 noncoding mutations: 44988
-
After collapsing adjacent/redundant mutations: 44986
-
Number of mutations before filtering: 44986
-
After removing 4216 mutations outside gene set: 40770
-
After removing 87 mutations outside category set: 40683
-
After removing 11 "impossible" mutations in
-
gene-patient-category bins of zero coverage: 36369
Table 1. Get Full Table Table representing breakdown of mutations by type.
| type | count |
|---|---|
| Frame_Shift_Del | 1283 |
| Frame_Shift_Ins | 736 |
| In_Frame_Del | 756 |
| In_Frame_Ins | 266 |
| Missense_Mutation | 25965 |
| Nonsense_Mutation | 1986 |
| Nonstop_Mutation | 38 |
| Silent | 8788 |
| Splice_Site | 865 |
| Total | 40683 |
Table 2. Get Full Table A breakdown of mutation rates per category discovered for this individual set.
| category | n | N | rate | rate_per_mb | relative_rate | exp_ns_s_ratio |
|---|---|---|---|---|---|---|
| *CpG->T | 5184 | 1101604176 | 4.7e-06 | 4.7 | 3.2 | 2.2 |
| *Cp(A/C/T)->T | 5809 | 9664813395 | 6e-07 | 0.6 | 0.4 | 1.7 |
| C->(G/A) | 9423 | 10766417571 | 8.8e-07 | 0.88 | 0.59 | 4.9 |
| A->mut | 5543 | 10671091617 | 5.2e-07 | 0.52 | 0.35 | 3.8 |
| indel+null | 5849 | 21437509188 | 2.7e-07 | 0.27 | 0.18 | NaN |
| double_null | 81 | 21437509188 | 3.8e-09 | 0.0038 | 0.0025 | NaN |
| Total | 31889 | 21437509188 | 1.5e-06 | 1.5 | 1 | 3.5 |
The x axis represents the samples. The y axis represents the exons, one row per exon, and they are sorted by average coverage across samples. For exons with exactly the same average coverage, they are sorted next by the %GC of the exon. (The secondary sort is especially useful for the zero-coverage exons at the bottom).
Figure 1.
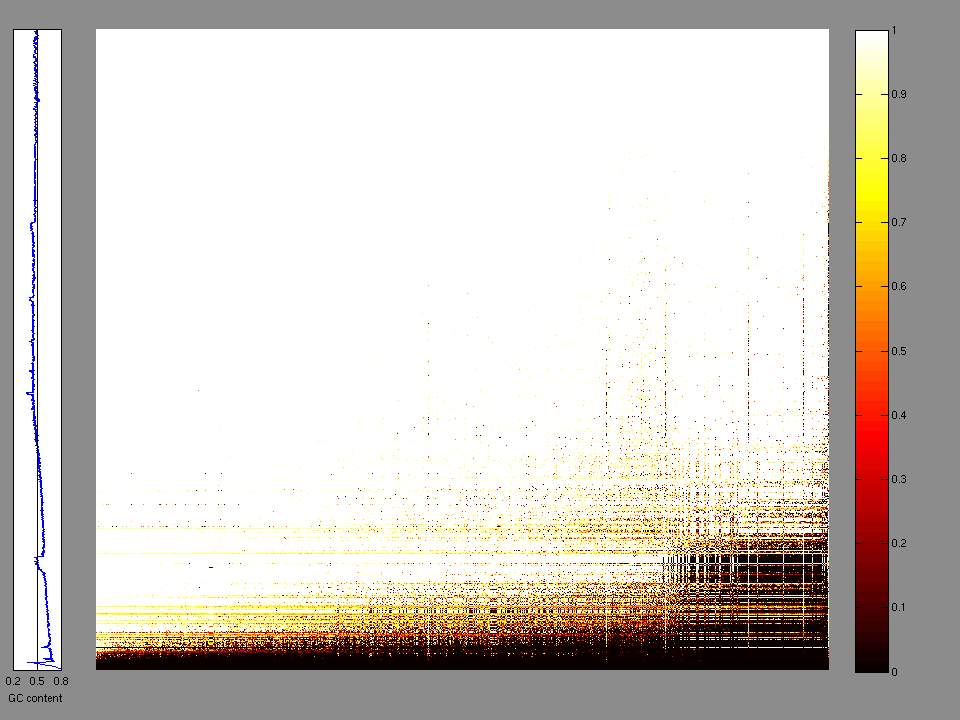
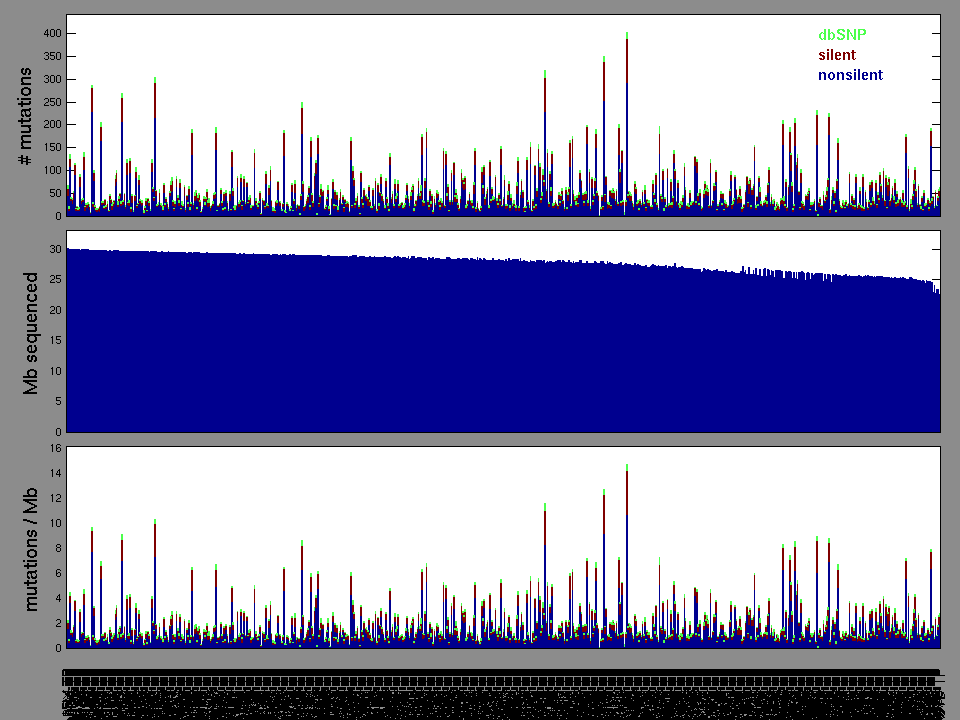
Figure 2. Patients counts and rates file used to generate this plot: BRCA-TP.patients.counts_and_rates.txt
The mutation spectrum is depicted in the lego plots below in which the 96 possible mutation types are subdivided into six large blocks, color-coded to reflect the base substitution type. Each large block is further subdivided into the 16 possible pairs of 5' and 3' neighbors, as listed in the 4x4 trinucleotide context legend. The height of each block corresponds to the mutation frequency for that kind of mutation (counts of mutations normalized by the base coverage in a given bin). The shape of the spectrum is a signature for dominant mutational mechanisms in different tumor types.
Figure 3. Get High-res Image SNV Mutation rate lego plot for entire set. Each bin is normalized by base coverage for that bin. Colors represent the six SNV types on the upper right. The three-base context for each mutation is labeled in the 4x4 legend on the lower right. The fractional breakdown of SNV counts is shown in the pie chart on the upper left. If this figure is blank, not enough information was provided in the MAF to generate it.
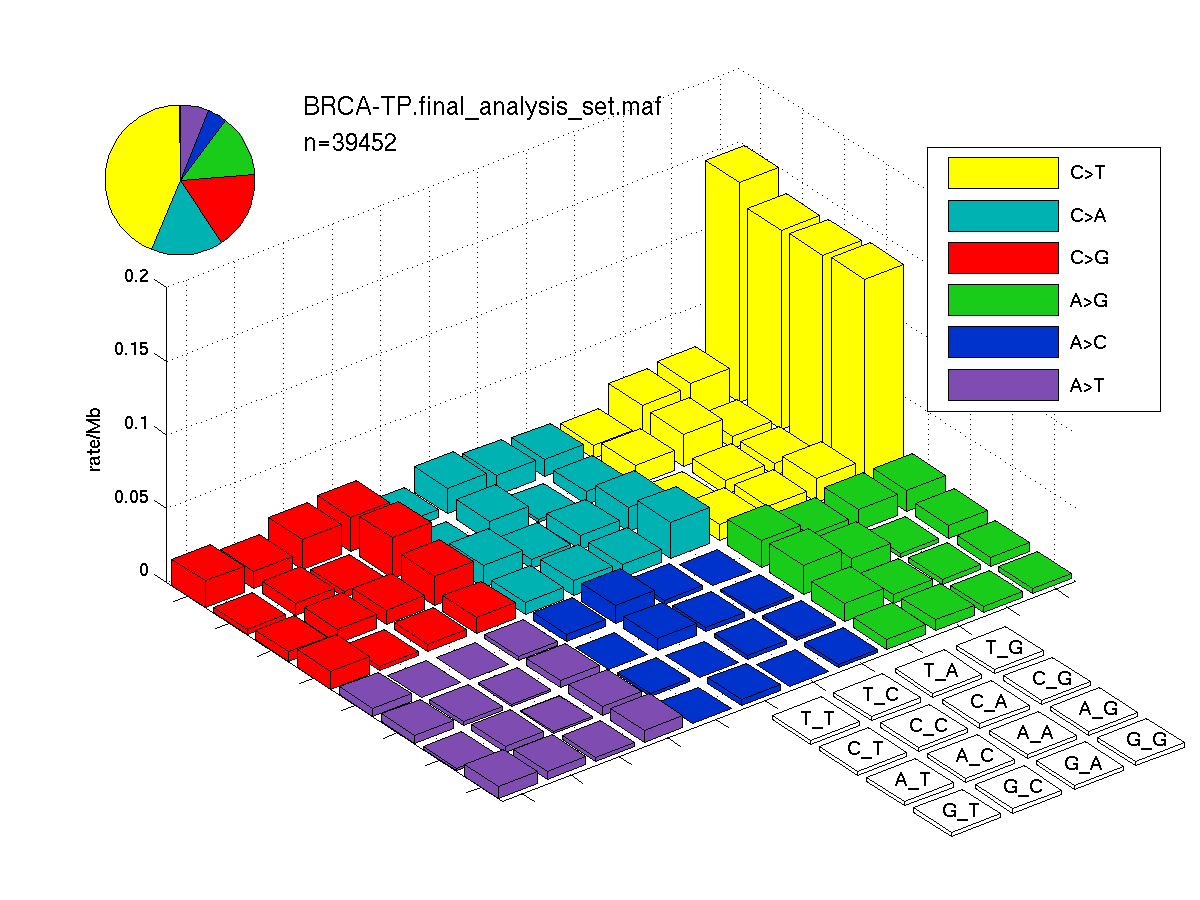
Figure 4. Get High-res Image SNV Mutation rate lego plots for 4 slices of mutation allele fraction (0<=AF<0.1, 0.1<=AF<0.25, 0.25<=AF<0.5, & 0.5<=AF) . The color code and three-base context legends are the same as the previous figure. If this figure is blank, not enough information was provided in the MAF to generate it.

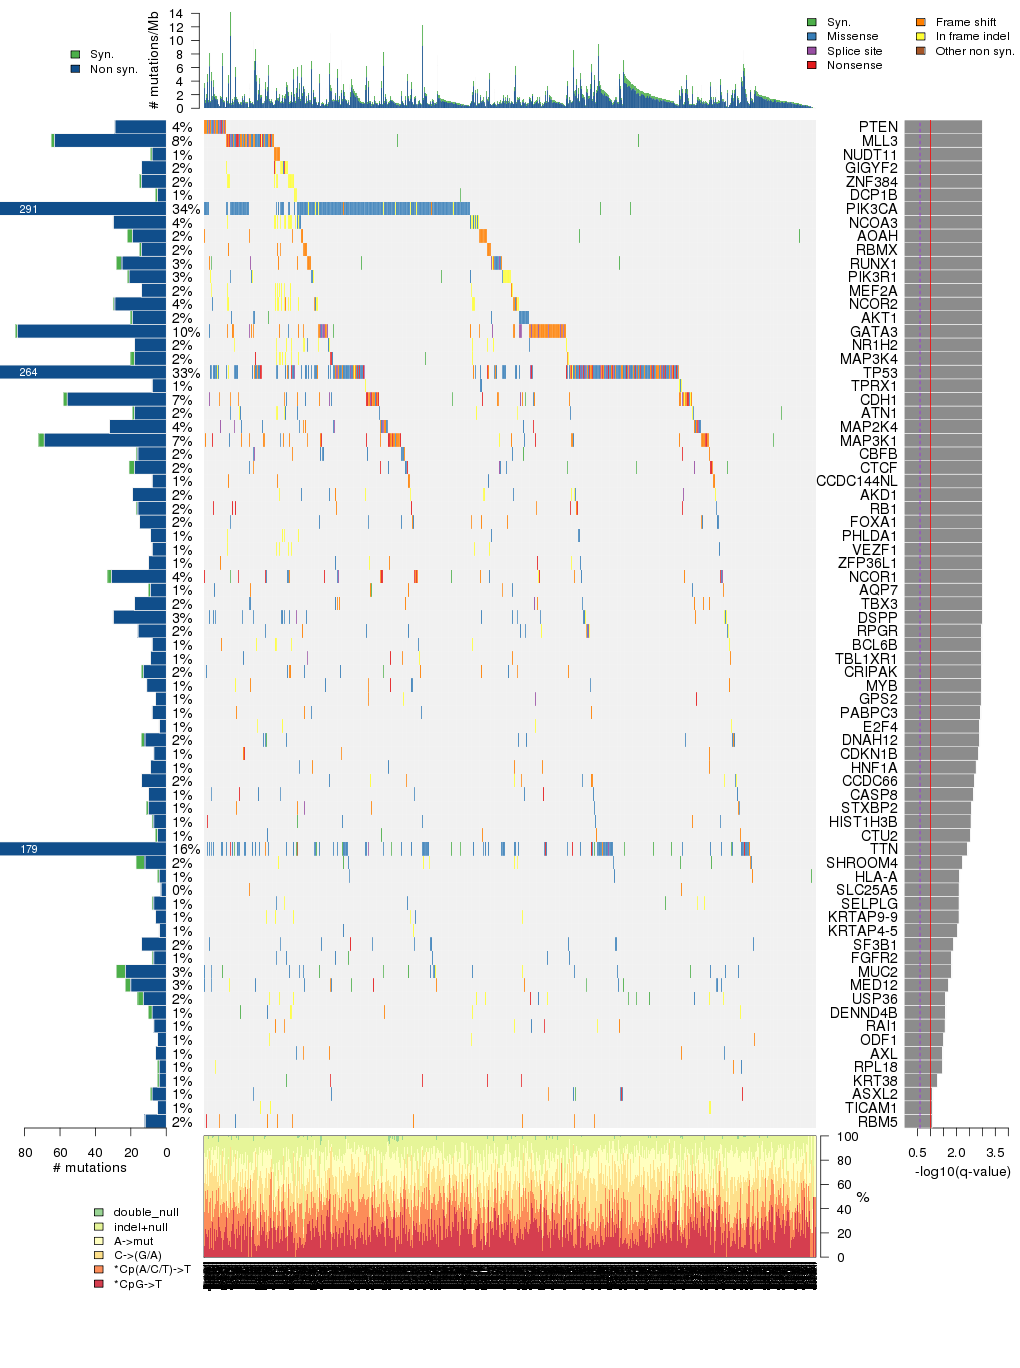
Figure 5. Get High-res Image The matrix in the center of the figure represents individual mutations in patient samples, color-coded by type of mutation, for the significantly mutated genes. The rate of synonymous and non-synonymous mutations is displayed at the top of the matrix. The barplot on the left of the matrix shows the number of mutations in each gene. The percentages represent the fraction of tumors with at least one mutation in the specified gene. The barplot to the right of the matrix displays the q-values for the most significantly mutated genes. The purple boxplots below the matrix (only displayed if required columns are present in the provided MAF) represent the distributions of allelic fractions observed in each sample. The plot at the bottom represents the base substitution distribution of individual samples, using the same categories that were used to calculate significance.
Column Descriptions:
-
N = number of sequenced bases in this gene across the individual set
-
n = number of (nonsilent) mutations in this gene across the individual set
-
npat = number of patients (individuals) with at least one nonsilent mutation
-
nsite = number of unique sites having a non-silent mutation
-
nsil = number of silent mutations in this gene across the individual set
-
n1 = number of nonsilent mutations of type: *CpG->T
-
n2 = number of nonsilent mutations of type: *Cp(A/C/T)->T
-
n3 = number of nonsilent mutations of type: C->(G/A)
-
n4 = number of nonsilent mutations of type: A->mut
-
n5 = number of nonsilent mutations of type: indel+null
-
n6 = number of nonsilent mutations of type: double_null
-
p_cons = p-value for enrichment of mutations at evolutionarily most-conserved sites in gene
-
p_joint = p-value for clustering + conservation
-
p = p-value (overall)
-
q = q-value, False Discovery Rate (Benjamini-Hochberg procedure)
Table 3. Get Full Table A Ranked List of Significantly Mutated Genes. Number of significant genes found: 74. Number of genes displayed: 35. Click on a gene name to display its stick figure depicting the distribution of mutations and mutation types across the chosen gene (this feature may not be available for all significant genes).
| rank | gene | description | N | n | npat | nsite | nsil | n1 | n2 | n3 | n4 | n5 | n6 | p_clust | p_cons | p_joint | p_cv | p | q |
|---|---|---|---|---|---|---|---|---|---|---|---|---|---|---|---|---|---|---|---|
| 1 | PTEN | phosphatase and tensin homolog (mutated in multiple advanced cancers 1) | 956652 | 29 | 29 | 26 | 0 | 1 | 0 | 3 | 4 | 20 | 1 | 0.046 | 0.23 | 0.061 | 0 | 0 | 0 |
| 2 | MLL3 | myeloid/lymphoid or mixed-lineage leukemia 3 | 11396219 | 63 | 61 | 59 | 2 | 5 | 11 | 7 | 4 | 34 | 2 | 0.049 | 0.19 | 0.058 | 0 | 0 | 0 |
| 3 | NUDT11 | nudix (nucleoside diphosphate linked moiety X)-type motif 11 | 361639 | 8 | 8 | 1 | 1 | 0 | 0 | 0 | 0 | 8 | 0 | 0 | 1 | 0 | 1 | 0 | 0 |
| 4 | GIGYF2 | GRB10 interacting GYF protein 2 | 3088772 | 14 | 13 | 4 | 0 | 1 | 0 | 0 | 0 | 13 | 0 | 0 | 1 | 0 | 0.86 | 0 | 0 |
| 5 | ZNF384 | zinc finger protein 384 | 1360722 | 14 | 14 | 1 | 1 | 0 | 0 | 0 | 0 | 14 | 0 | 0 | 1 | 0 | 0 | 0 | 0 |
| 6 | DCP1B | DCP1 decapping enzyme homolog B (S. cerevisiae) | 1373345 | 5 | 5 | 1 | 1 | 0 | 0 | 0 | 0 | 5 | 0 | 0 | 0.97 | 0 | 0.98 | 0 | 0 |
| 7 | PIK3CA | phosphoinositide-3-kinase, catalytic, alpha polypeptide | 2526504 | 287 | 261 | 49 | 4 | 5 | 101 | 11 | 154 | 16 | 0 | 0 | 0 | 0 | 1.2e-14 | 0 | 0 |
| 8 | NCOA3 | nuclear receptor coactivator 3 | 3363126 | 30 | 29 | 12 | 0 | 1 | 2 | 3 | 2 | 22 | 0 | 0 | 0.99 | 0 | 2.4e-15 | 0 | 0 |
| 9 | AOAH | acyloxyacyl hydrolase (neutrophil) | 1514305 | 19 | 19 | 1 | 3 | 0 | 0 | 0 | 0 | 19 | 0 | 0 | 1 | 0 | 1.3e-14 | 0 | 0 |
| 10 | RBMX | RNA binding motif protein, X-linked | 966111 | 14 | 13 | 3 | 1 | 0 | 1 | 0 | 0 | 13 | 0 | 0 | 0.52 | 0 | 0 | 0 | 0 |
| 11 | RUNX1 | runt-related transcription factor 1 (acute myeloid leukemia 1; aml1 oncogene) | 794236 | 25 | 25 | 23 | 3 | 0 | 2 | 1 | 4 | 17 | 1 | 0.0031 | 0.28 | 0.0062 | 0 | 0 | 0 |
| 12 | PIK3R1 | phosphoinositide-3-kinase, regulatory subunit 1 (alpha) | 1797680 | 21 | 21 | 20 | 1 | 0 | 3 | 2 | 3 | 13 | 0 | 2e-07 | 0.061 | 6.8e-06 | 2.2e-14 | 0 | 0 |
| 13 | MEF2A | myocyte enhancer factor 2A | 1255054 | 14 | 14 | 3 | 0 | 0 | 0 | 0 | 1 | 13 | 0 | 0 | 0 | 0 | 3.7e-15 | 0 | 0 |
| 14 | NCOR2 | nuclear receptor co-repressor 2 | 3826500 | 29 | 29 | 7 | 1 | 1 | 0 | 2 | 0 | 26 | 0 | 2e-07 | 1 | 5.2e-06 | 6.3e-15 | 0 | 0 |
| 15 | AKT1 | v-akt murine thymoma viral oncogene homolog 1 | 951700 | 19 | 19 | 2 | 1 | 0 | 18 | 0 | 1 | 0 | 0 | 0 | 6.4e-06 | 0 | 0.00012 | 0 | 0 |
| 16 | GATA3 | GATA binding protein 3 | 764273 | 84 | 81 | 50 | 1 | 0 | 1 | 1 | 4 | 77 | 1 | 0 | 0.51 | 0 | 0 | 0 | 0 |
| 17 | NR1H2 | nuclear receptor subfamily 1, group H, member 2 | 802056 | 18 | 18 | 5 | 0 | 2 | 0 | 0 | 1 | 15 | 0 | 0 | 1 | 0 | 1.9e-15 | 0 | 0 |
| 18 | MAP3K4 | mitogen-activated protein kinase kinase kinase 4 | 3667040 | 18 | 18 | 5 | 2 | 0 | 1 | 0 | 0 | 17 | 0 | 0 | 0.68 | 0 | 4.7e-08 | 0 | 0 |
| 19 | TP53 | tumor protein p53 | 974889 | 261 | 257 | 145 | 3 | 35 | 28 | 32 | 62 | 104 | 0 | 0 | 0 | 0 | 0 | 0 | 0 |
| 20 | TPRX1 | tetra-peptide repeat homeobox 1 | 736132 | 8 | 7 | 4 | 0 | 0 | 0 | 0 | 4 | 4 | 0 | 0 | 0.88 | 0 | 1.4e-07 | 0 | 0 |
| 21 | CDH1 | cadherin 1, type 1, E-cadherin (epithelial) | 1998729 | 56 | 55 | 49 | 2 | 2 | 4 | 2 | 1 | 47 | 0 | 0.65 | 0.38 | 0.73 | 0 | 0 | 0 |
| 22 | ATN1 | atrophin 1 | 2206723 | 18 | 17 | 9 | 1 | 0 | 5 | 2 | 0 | 11 | 0 | 8e-05 | 0.97 | 0.00032 | 1.8e-13 | 2.2e-15 | 1.7e-12 |
| 23 | MAP2K4 | mitogen-activated protein kinase kinase 4 | 863577 | 32 | 32 | 28 | 0 | 3 | 2 | 5 | 2 | 20 | 0 | 0.072 | 0.19 | 0.095 | 2.6e-15 | 9e-15 | 6.5e-12 |
| 24 | MAP3K1 | mitogen-activated protein kinase kinase kinase 1 | 3179186 | 69 | 57 | 65 | 3 | 0 | 1 | 6 | 9 | 37 | 16 | 0.87 | 0.21 | 0.64 | 1e-15 | 2.3e-14 | 1.6e-11 |
| 25 | CBFB | core-binding factor, beta subunit | 359167 | 16 | 16 | 16 | 1 | 0 | 4 | 3 | 4 | 5 | 0 | 0.058 | 0.3 | 0.075 | 1.5e-14 | 3.9e-14 | 2.6e-11 |
| 26 | CTCF | CCCTC-binding factor (zinc finger protein) | 1695933 | 18 | 18 | 16 | 3 | 1 | 1 | 3 | 5 | 8 | 0 | 0.011 | 0.002 | 0.0013 | 1.3e-12 | 5.7e-14 | 3.7e-11 |
| 27 | CCDC144NL | coiled-coil domain containing 144 family, N-terminal like | 495337 | 8 | 8 | 3 | 0 | 1 | 0 | 0 | 0 | 7 | 0 | 0.000027 | 1 | 0.00015 | 1.3e-10 | 6.4e-13 | 4e-10 |
| 28 | AKD1 | adenylate kinase domain containing 1 | 4187803 | 19 | 19 | 10 | 0 | 0 | 2 | 4 | 0 | 13 | 0 | 0.72 | 0.68 | 1 | 2e-12 | 5.7e-11 | 3.4e-08 |
| 29 | RB1 | retinoblastoma 1 (including osteosarcoma) | 2081432 | 16 | 14 | 15 | 1 | 0 | 1 | 0 | 2 | 13 | 0 | 0.84 | 0.21 | 0.63 | 8.4e-12 | 1.4e-10 | 8.1e-08 |
| 30 | FOXA1 | forkhead box A1 | 763360 | 15 | 15 | 15 | 0 | 1 | 3 | 2 | 4 | 5 | 0 | 0.0091 | 0.092 | 0.0066 | 1.3e-09 | 2.2e-10 | 1.2e-07 |
| 31 | PHLDA1 | pleckstrin homology-like domain, family A, member 1 | 522212 | 9 | 9 | 5 | 0 | 0 | 0 | 4 | 0 | 5 | 0 | 0.0097 | 0.85 | 0.021 | 5.9e-10 | 3.2e-10 | 1.7e-07 |
| 32 | VEZF1 | vascular endothelial zinc finger 1 | 1198490 | 8 | 8 | 3 | 0 | 0 | 0 | 1 | 0 | 7 | 0 | 1e-05 | 1 | 0.000057 | 9.3e-07 | 1.3e-09 | 6.8e-07 |
| 33 | ZFP36L1 | zinc finger protein 36, C3H type-like 1 | 695039 | 10 | 10 | 10 | 0 | 0 | 1 | 1 | 1 | 7 | 0 | 0.021 | 0.8 | 0.042 | 1.6e-09 | 1.6e-09 | 8.2e-07 |
| 34 | NCOR1 | nuclear receptor co-repressor 1 | 5748805 | 31 | 31 | 31 | 2 | 0 | 2 | 5 | 2 | 21 | 1 | 0.35 | 0.56 | 0.52 | 7.4e-10 | 8.7e-09 | 4.3e-06 |
| 35 | AQP7 | aquaporin 7 | 796413 | 9 | 9 | 6 | 1 | 1 | 0 | 1 | 1 | 6 | 0 | 0.0018 | 0.63 | 0.0059 | 6.5e-08 | 8.8e-09 | 4.3e-06 |
In this analysis, COSMIC is used as a filter to increase power by restricting the territory of each gene. Cosmic version: v48.
Table 4. Get Full Table Significantly mutated genes (COSMIC territory only). To access the database please go to: COSMIC. Number of significant genes found: 15. Number of genes displayed: 10
| rank | gene | description | n | cos | n_cos | N_cos | cos_ev | p | q |
|---|---|---|---|---|---|---|---|---|---|
| 1 | PIK3CA | phosphoinositide-3-kinase, catalytic, alpha polypeptide | 287 | 220 | 268 | 169840 | 161927 | 0 | 0 |
| 2 | TP53 | tumor protein p53 | 261 | 356 | 248 | 274832 | 47662 | 0 | 0 |
| 3 | CDH1 | cadherin 1, type 1, E-cadherin (epithelial) | 56 | 185 | 23 | 142820 | 37 | 0 | 0 |
| 4 | PTEN | phosphatase and tensin homolog (mutated in multiple advanced cancers 1) | 29 | 767 | 29 | 592124 | 1024 | 0 | 0 |
| 5 | MAP2K4 | mitogen-activated protein kinase kinase 4 | 32 | 15 | 6 | 11580 | 10 | 6.1e-13 | 5.3e-10 |
| 6 | PIK3R1 | phosphoinositide-3-kinase, regulatory subunit 1 (alpha) | 21 | 33 | 12 | 25476 | 20 | 1.2e-12 | 8e-10 |
| 7 | GATA3 | GATA binding protein 3 | 84 | 34 | 32 | 26248 | 212 | 1.3e-12 | 8e-10 |
| 8 | ERBB2 | v-erb-b2 erythroblastic leukemia viral oncogene homolog 2, neuro/glioblastoma derived oncogene homolog (avian) | 13 | 42 | 8 | 32424 | 50 | 1.6e-12 | 8.5e-10 |
| 9 | RUNX1 | runt-related transcription factor 1 (acute myeloid leukemia 1; aml1 oncogene) | 25 | 178 | 17 | 137416 | 57 | 5.7e-12 | 2.7e-09 |
| 10 | FGFR2 | fibroblast growth factor receptor 2 (bacteria-expressed kinase, keratinocyte growth factor receptor, craniofacial dysostosis 1, Crouzon syndrome, Pfeiffer syndrome, Jackson-Weiss syndrome) | 7 | 51 | 5 | 39372 | 21 | 5.5e-09 | 2.4e-06 |
Note:
n - number of (nonsilent) mutations in this gene across the individual set.
cos = number of unique mutated sites in this gene in COSMIC
n_cos = overlap between n and cos.
N_cos = number of individuals times cos.
cos_ev = total evidence: number of reports in COSMIC for mutations seen in this gene.
p = p-value for seeing the observed amount of overlap in this gene)
q = q-value, False Discovery Rate (Benjamini-Hochberg procedure)
Table 5. Get Full Table A Ranked List of Significantly Mutated Genesets. (Source: MSigDB GSEA Cannonical Pathway Set).Number of significant genesets found: 122. Number of genesets displayed: 10
| rank | geneset | description | genes | N_genes | mut_tally | N | n | npat | nsite | nsil | n1 | n2 | n3 | n4 | n5 | n6 | p_ns_s | p | q |
|---|---|---|---|---|---|---|---|---|---|---|---|---|---|---|---|---|---|---|---|
| 1 | ARFPATHWAY | Cyclin-dependent kinase inhibitor 2A is a tumor suppressor that induces G1 arrest and can activate the p53 pathway, leading to G2/M arrest. | ABL1, CDKN2A, E2F1, MDM2, MYC, PIK3CA, PIK3R1, POLR1A, POLR1B, POLR1C, POLR1D, RAC1, RB1, TBX2, TP53, TWIST1 | 16 | ABL1(5), E2F1(4), MDM2(2), MYC(1), PIK3CA(287), PIK3R1(21), POLR1A(6), POLR1B(2), POLR1C(2), POLR1D(4), RB1(16), TP53(261) | 21722333 | 611 | 480 | 255 | 16 | 45 | 137 | 49 | 227 | 153 | 0 | <1.00e-15 | <1.00e-15 | <1.31e-14 |
| 2 | HSA04620_TOLL_LIKE_RECEPTOR_SIGNALING_PATHWAY | Genes involved in Toll-like receptor signaling pathway | AKT1, AKT2, AKT3, CASP8, CCL3, CCL4, CCL5, CD14, CD40, CD80, CD86, CHUK, CXCL10, CXCL11, CXCL9, FADD, FOS, IFNA1, IFNA10, IFNA13, IFNA14, IFNA16, IFNA17, IFNA2, IFNA21, IFNA4, IFNA5, IFNA6, IFNA7, IFNA8, IFNAR1, IFNAR2, IFNB1, IKBKB, IKBKE, IKBKG, IL12A, IL12B, IL1B, IL6, IL8, IRAK1, IRAK4, IRF3, IRF5, IRF7, JUN, LBP, LY96, MAP2K1, MAP2K2, MAP2K3, MAP2K4, MAP2K6, MAP2K7, MAP3K7, MAP3K7IP1, MAP3K7IP2, MAP3K8, MAPK1, MAPK10, MAPK11, MAPK12, MAPK13, MAPK14, MAPK3, MAPK8, MAPK9, MYD88, NFKB1, NFKB2, NFKBIA, PIK3CA, PIK3CB, PIK3CD, PIK3CG, PIK3R1, PIK3R2, PIK3R3, PIK3R5, RAC1, RELA, RIPK1, SPP1, STAT1, TBK1, TICAM1, TICAM2, TIRAP, TLR1, TLR2, TLR3, TLR4, TLR5, TLR6, TLR7, TLR8, TLR9, TNF, TOLLIP, TRAF3, TRAF6 | 98 | AKT1(19), AKT2(3), AKT3(4), CASP8(10), CD14(2), CD40(1), CD86(2), CHUK(1), IFNA1(1), IFNA10(1), IFNA13(1), IFNA14(2), IFNA16(1), IFNA17(1), IFNA2(3), IFNA21(1), IFNA4(1), IFNA6(2), IFNAR1(1), IFNAR2(1), IFNB1(1), IKBKB(4), IKBKE(2), IL12A(1), IL12B(1), IL6(2), IRAK1(2), IRAK4(3), IRF3(3), IRF5(1), IRF7(1), JUN(3), LBP(1), MAP2K1(1), MAP2K2(1), MAP2K3(2), MAP2K4(32), MAP2K6(1), MAP2K7(1), MAP3K7(1), MAP3K8(2), MAPK1(1), MAPK10(2), MAPK13(1), MAPK14(2), MAPK3(1), MAPK8(2), NFKB1(4), NFKB2(3), NFKBIA(1), PIK3CA(287), PIK3CB(6), PIK3CD(4), PIK3CG(3), PIK3R1(21), PIK3R3(2), RELA(1), RIPK1(3), SPP1(2), STAT1(1), TBK1(1), TICAM1(5), TIRAP(1), TLR1(1), TLR2(1), TLR3(5), TLR4(13), TLR5(2), TLR7(8), TLR8(3), TLR9(1), TRAF3(2), TRAF6(3) | 97377478 | 517 | 400 | 253 | 43 | 27 | 160 | 56 | 187 | 85 | 2 | <1.00e-15 | <1.00e-15 | <1.31e-14 |
| 3 | HSA04012_ERBB_SIGNALING_PATHWAY | Genes involved in ErbB signaling pathway | ABL1, ABL2, AKT1, AKT2, AKT3, ARAF, AREG, BAD, BRAF, BTC, CAMK2A, CAMK2B, CAMK2D, CAMK2G, CBL, CBLB, CBLC, CDKN1A, CDKN1B, CRK, CRKL, EGF, EGFR, EIF4EBP1, ELK1, ERBB2, ERBB3, ERBB4, EREG, FRAP1, GAB1, GRB2, GSK3B, HBEGF, HRAS, JUN, KRAS, MAP2K1, MAP2K2, MAP2K4, MAP2K7, MAPK1, MAPK10, MAPK3, MAPK8, MAPK9, MYC, NCK1, NCK2, NRAS, NRG1, NRG2, NRG3, NRG4, PAK1, PAK2, PAK3, PAK4, PAK6, PAK7, PIK3CA, PIK3CB, PIK3CD, PIK3CG, PIK3R1, PIK3R2, PIK3R3, PIK3R5, PLCG1, PLCG2, PRKCA, PRKCB1, PRKCG, PTK2, RAF1, RPS6KB1, RPS6KB2, SHC1, SHC2, SHC3, SHC4, SOS1, SOS2, SRC, STAT5A, STAT5B, TGFA | 85 | ABL1(5), ABL2(4), AKT1(19), AKT2(3), AKT3(4), ARAF(4), AREG(1), BRAF(3), BTC(1), CAMK2A(2), CAMK2D(4), CAMK2G(1), CBL(4), CBLB(10), CBLC(2), CDKN1B(7), CRK(1), CRKL(1), EGF(3), EGFR(5), ELK1(2), ERBB2(13), ERBB3(11), ERBB4(6), GAB1(2), GRB2(1), JUN(3), KRAS(6), MAP2K1(1), MAP2K2(1), MAP2K4(32), MAP2K7(1), MAPK1(1), MAPK10(2), MAPK3(1), MAPK8(2), MYC(1), NCK1(1), NCK2(1), NRAS(1), NRG1(2), NRG3(4), PAK1(2), PAK2(2), PAK3(2), PAK4(1), PAK6(1), PAK7(2), PIK3CA(287), PIK3CB(6), PIK3CD(4), PIK3CG(3), PIK3R1(21), PIK3R3(2), PLCG1(6), PLCG2(3), PRKCG(2), PTK2(5), RAF1(1), RPS6KB1(2), RPS6KB2(4), SHC1(1), SHC2(1), SHC3(1), SHC4(2), SOS1(4), SOS2(4), STAT5A(4), STAT5B(5), TGFA(1) | 112604599 | 558 | 393 | 290 | 53 | 39 | 160 | 78 | 198 | 83 | 0 | <1.00e-15 | <1.00e-15 | <1.31e-14 |
| 4 | APOPTOSIS | APAF1, BAD, BAK1, BCL2L7P1, BAX, BCL2, BCL2L1, BCL2L11, BID, BIRC2, BIRC3, BIRC4, BIRC5, BNIP3L, CASP1, CASP10, CASP1, COPl, CASP2, CASP3, CASP4, CASP6, CASP7, CASP8, CASP9, CHUK, CYCS, DFFA, DFFB, FADD, FAS, FASLG, GZMB, HELLS, HRK, IKBKB, IKBKG, IRF1, IRF2, IRF3, IRF4, IRF5, IRF6, IRF7, JUN, LTA, MAP2K4, MAP3K1, MAPK10, MDM2, MYC, NFKB1, NFKBIA, NFKBIB, NFKBIE, PRF1, RELA, RIPK1, TNF, TNFRSF10B, TNFRSF1A, TNFRSF1B, TNFRSF21, TNFRSF25, TNFRSF25, PLEKHG5, TNFSF10, TP53, TP73, TRADD, TRAF1, TRAF2, TRAF3 | 65 | APAF1(3), BAK1(2), BAX(2), BCL2L11(4), BID(4), BIRC3(1), CASP1(1), CASP2(3), CASP4(1), CASP6(2), CASP7(1), CASP8(10), CASP9(1), CHUK(1), DFFB(2), FAS(1), FASLG(2), IKBKB(4), IRF1(1), IRF3(3), IRF5(1), IRF6(2), IRF7(1), JUN(3), LTA(1), MAP2K4(32), MAP3K1(69), MAPK10(2), MDM2(2), MYC(1), NFKB1(4), NFKBIA(1), NFKBIE(1), PLEKHG5(3), PRF1(2), RELA(1), RIPK1(3), TNFRSF1A(1), TNFRSF21(2), TNFRSF25(1), TP53(261), TP73(1), TRAF1(1), TRAF3(2) | 61619955 | 447 | 372 | 322 | 16 | 51 | 55 | 60 | 83 | 181 | 17 | <1.00e-15 | <1.00e-15 | <1.31e-14 | |
| 5 | ST_FAS_SIGNALING_PATHWAY | The Fas receptor induces apoptosis and NF-kB activation when bound to Fas ligand. | ADPRT, ALG2, BAK1, BAX, BFAR, BIRC4, BTK, CAD, CASP10, CASP3, CASP8, CASP8AP2, CD7, CDK2AP1, CSNK1A1, DAXX, DEDD, DEDD2, DFFA, DIABLO, EGFR, EPHB2, FADD, FAF1, FAIM2, FREQ, HRB, HSPB1, IL1A, IL8, MAP2K4, MAP2K7, MAP3K1, MAP3K5, MAPK1, MAPK10, MAPK8, MAPK8IP1, MAPK8IP2, MAPK8IP3, MAPK9, MCP, MET, NFAT5, NFKB1, NFKB2, NFKBIA, NFKBIB, NFKBIE, NFKBIL1, NFKBIL2, NR0B2, PFN1, PFN2, PTPN13, RALBP1, RIPK1, ROCK1, SMPD1, TNFRSF6, TNFRSF6B, TP53, TPX2, TRAF2, TUFM, VIL2 | 56 | ALG2(2), BAK1(2), BAX(2), BFAR(2), BTK(4), CAD(10), CASP8(10), CSNK1A1(1), DAXX(2), EGFR(5), EPHB2(3), IL1A(1), MAP2K4(32), MAP2K7(1), MAP3K1(69), MAP3K5(2), MAPK1(1), MAPK10(2), MAPK8(2), MAPK8IP1(2), MAPK8IP2(2), MAPK8IP3(3), MET(7), NFAT5(6), NFKB1(4), NFKB2(3), NFKBIA(1), NFKBIE(1), NR0B2(2), PTPN13(5), RALBP1(1), RIPK1(3), ROCK1(4), SMPD1(1), TP53(261), TUFM(2) | 75893988 | 461 | 368 | 336 | 27 | 53 | 55 | 68 | 87 | 181 | 17 | <1.00e-15 | <1.00e-15 | <1.31e-14 |
| 6 | SIG_CHEMOTAXIS | Genes related to chemotaxis | ACTR2, ACTR3, AKT1, AKT2, AKT3, ANGPTL2, ARHGAP1, ARHGAP4, ARHGEF11, BTK, CDC42, CFL1, CFL2, GDI1, GDI2, INPPL1, ITPR1, ITPR2, ITPR3, LIMK1, MYLK, MYLK2, P101-PI3K, PAK1, PAK2, PAK3, PAK4, PAK6, PAK7, PDK1, PIK3CA, PIK3CD, PIK3CG, PIK3R1, PITX2, PPP1R13B, PTEN, RACGAP1, RHO, ROCK1, ROCK2, RPS4X, SAG, WASF1, WASL | 44 | AKT1(19), AKT2(3), AKT3(4), ANGPTL2(1), ARHGAP4(1), ARHGEF11(3), BTK(4), GDI1(4), INPPL1(4), ITPR1(10), ITPR2(7), ITPR3(6), LIMK1(4), MYLK(8), MYLK2(2), PAK1(2), PAK2(2), PAK3(2), PAK4(1), PAK6(1), PAK7(2), PDK1(1), PIK3CA(287), PIK3CD(4), PIK3CG(3), PIK3R1(21), PITX2(3), PPP1R13B(3), PTEN(29), RHO(4), ROCK1(4), ROCK2(4), RPS4X(2), SAG(1), WASF1(5), WASL(1) | 78418068 | 462 | 367 | 203 | 41 | 24 | 143 | 46 | 182 | 66 | 1 | <1.00e-15 | <1.00e-15 | <1.31e-14 |
| 7 | HSA00562_INOSITOL_PHOSPHATE_METABOLISM | Genes involved in inositol phosphate metabolism | CARKL, FN3K, IMPA1, IMPA2, INPP1, INPP4A, INPP4B, INPP5A, INPP5B, INPP5E, INPPL1, IPMK, ISYNA1, ITGB1BP3, ITPK1, ITPKA, ITPKB, MINPP1, MIOX, OCRL, PI4KA, PI4KB, PIB5PA, PIK3C3, PIK3CA, PIK3CB, PIK3CD, PIK3CG, PIP4K2A, PIP4K2B, PIP4K2C, PIP5K1A, PIP5K1B, PIP5K1C, PIP5K3, PLCB1, PLCB2, PLCB3, PLCB4, PLCD1, PLCD3, PLCD4, PLCE1, PLCG1, PLCG2, PLCZ1, PTEN, PTPMT1, SKIP, SYNJ1, SYNJ2 | 47 | FN3K(1), IMPA1(1), INPP4A(4), INPP4B(5), INPP5A(2), INPP5B(5), INPPL1(4), IPMK(1), ITGB1BP3(1), ITPK1(1), ITPKA(1), ITPKB(7), MINPP1(1), OCRL(6), PI4KA(5), PI4KB(1), PIK3C3(2), PIK3CA(287), PIK3CB(6), PIK3CD(4), PIK3CG(3), PIP4K2A(1), PIP4K2C(6), PIP5K1A(2), PIP5K1B(1), PIP5K1C(4), PLCB1(4), PLCB2(2), PLCB3(3), PLCB4(7), PLCD1(1), PLCD3(3), PLCD4(1), PLCE1(12), PLCG1(6), PLCG2(3), PLCZ1(8), PTEN(29), SYNJ1(2), SYNJ2(1) | 81472703 | 444 | 366 | 200 | 36 | 28 | 119 | 52 | 180 | 64 | 1 | <1.00e-15 | <1.00e-15 | <1.31e-14 |
| 8 | SIG_PIP3_SIGNALING_IN_CARDIAC_MYOCTES | Genes related to PIP3 signaling in cardiac myocytes | AKT1, AKT2, AKT3, BAD, BCL2L1, CDC42, CDK2, CDKN1B, CDKN2A, CREB1, CREB3, CREB5, EBP, ERBB4, F2RL2, FOXO3A, FRAP1, GAB1, GADD45A, GRB2, GSK3A, GSK3B, IFI27, IGF1, IGFBP1, INPPL1, IRS1, IRS2, IRS4, MET, MYC, NOLC1, P101-PI3K, PAK1, PAK2, PAK3, PAK4, PAK6, PAK7, PARD3, PARD6A, PDK1, PIK3CA, PIK3CD, PPP1R13B, PREX1, PSCD3, PTEN, PTK2, PTPN1, RPS6KA1, RPS6KA2, RPS6KA3, RPS6KB1, SFN, SHC1, SLC2A4, SOS1, SOS2, TSC1, TSC2, YWHAB, YWHAE, YWHAG, YWHAH, YWHAQ, YWHAZ | 62 | AKT1(19), AKT2(3), AKT3(4), CDK2(1), CDKN1B(7), CREB1(1), CREB3(1), CREB5(1), EBP(1), ERBB4(6), F2RL2(1), GAB1(2), GRB2(1), GSK3A(3), IFI27(2), IGF1(1), INPPL1(4), IRS1(2), IRS4(6), MET(7), MYC(1), NOLC1(2), PAK1(2), PAK2(2), PAK3(2), PAK4(1), PAK6(1), PAK7(2), PARD3(4), PDK1(1), PIK3CA(287), PIK3CD(4), PPP1R13B(3), PREX1(10), PTEN(29), PTK2(5), RPS6KA1(2), RPS6KA2(4), RPS6KA3(4), RPS6KB1(2), SHC1(1), SLC2A4(1), SOS1(4), SOS2(4), TSC1(4), TSC2(2), YWHAB(1), YWHAG(1), YWHAZ(1) | 82302068 | 460 | 366 | 200 | 39 | 29 | 142 | 52 | 175 | 61 | 1 | <1.00e-15 | <1.00e-15 | <1.31e-14 |
| 9 | SIG_INSULIN_RECEPTOR_PATHWAY_IN_CARDIAC_MYOCYTES | Genes related to the insulin receptor pathway | AKT1, AKT2, AKT3, BRD4, CAP1, CBL, CDC42, CDKN2A, F2RL2, FLOT1, FLOT2, FOXO1A, GRB2, GSK3A, GSK3B, IGFBP1, INPPL1, IRS1, IRS2, IRS4, LNPEP, MAPK1, MAPK3, PARD3, PARD6A, PDK1, PIK3CA, PIK3CD, PIK3R1, PPYR1, PSCD3, PTEN, PTPN1, RAF1, RPS6KA1, RPS6KA2, RPS6KA3, RPS6KB1, SERPINB6, SFN, SHC1, SLC2A4, SORBS1, SOS1, SOS2, YWHAB, YWHAE, YWHAG, YWHAH, YWHAQ, YWHAZ | 48 | AKT1(19), AKT2(3), AKT3(4), BRD4(2), CAP1(2), CBL(4), F2RL2(1), FLOT1(1), FLOT2(2), GRB2(1), GSK3A(3), INPPL1(4), IRS1(2), IRS4(6), MAPK1(1), MAPK3(1), PARD3(4), PDK1(1), PIK3CA(287), PIK3CD(4), PIK3R1(21), PPYR1(1), PTEN(29), RAF1(1), RPS6KA1(2), RPS6KA2(4), RPS6KA3(4), RPS6KB1(2), SERPINB6(1), SHC1(1), SLC2A4(1), SORBS1(5), SOS1(4), SOS2(4), YWHAB(1), YWHAG(1), YWHAZ(1) | 62745024 | 435 | 362 | 176 | 35 | 25 | 135 | 43 | 172 | 59 | 1 | <1.00e-15 | <1.00e-15 | <1.31e-14 |
| 10 | PPARAPATHWAY | Peroxisome proliferators regulate gene expression via PPAR/RXR heterodimers which bind to peroxisome-proliferator response elements (PPREs). | ACOX1, APOA1, APOA2, CD36, CITED2, CPT1B, CREBBP, DUSP1, DUT, EHHADH, EP300, FABP1, FAT, FRA8B, HSD17B4, HSPA1A, HSPCA, INS, JUN, LPL, MAPK1, MAPK3, ME1, MRPL11, MYC, NCOA1, NCOR1, NCOR2, NFKBIA, NOS2A, NR0B2, NR1H3, NR2F1, NRIP1, PDGFA, PIK3CA, PIK3R1, PPARA, PPARBP, PPARGC1, PRKACB, PRKACG, PRKAR1A, PRKAR1B, PRKAR2A, PRKAR2B, PRKCA, PRKCB1, PTGS2, RB1, RELA, RXRA, SP1, SRA1, STAT5A, STAT5B, TNF | 49 | ACOX1(2), CD36(1), CITED2(2), CPT1B(2), CREBBP(7), EHHADH(3), EP300(7), FABP1(1), HSD17B4(6), JUN(3), LPL(1), MAPK1(1), MAPK3(1), MRPL11(1), MYC(1), NCOA1(2), NCOR1(31), NCOR2(29), NFKBIA(1), NR0B2(2), NR2F1(1), NRIP1(3), PIK3CA(287), PIK3R1(21), PPARA(2), PRKACG(1), PRKAR1A(4), PRKAR2A(1), PRKAR2B(1), PTGS2(2), RB1(16), RELA(1), RXRA(1), SP1(3), SRA1(1), STAT5A(4), STAT5B(5) | 68924350 | 458 | 361 | 195 | 30 | 20 | 120 | 40 | 172 | 105 | 1 | <1.00e-15 | <1.00e-15 | <1.31e-14 |
In brief, we tabulate the number of mutations and the number of covered bases for each gene. The counts are broken down by mutation context category: four context categories that are discovered by MutSig, and one for indel and 'null' mutations, which include indels, nonsense mutations, splice-site mutations, and non-stop (read-through) mutations. For each gene, we calculate the probability of seeing the observed constellation of mutations, i.e. the product P1 x P2 x ... x Pm, or a more extreme one, given the background mutation rates calculated across the dataset. [1]
In addition to the links below, the full results of the analysis summarized in this report can also be downloaded programmatically using firehose_get, or interactively from either the Broad GDAC website or TCGA Data Coordination Center Portal.