This pipeline computes the correlation between significant copy number variation (cnv focal) genes and selected clinical features.
Testing the association between copy number variation 52 focal events and 9 clinical features across 68 patients, 4 significant findings detected with Q value < 0.25.
-
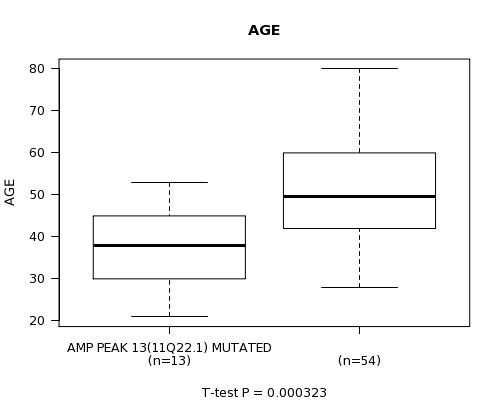
AMP PEAK 13(11Q22.1) MUTATION ANALYSIS cnv correlated to 'AGE'.
-
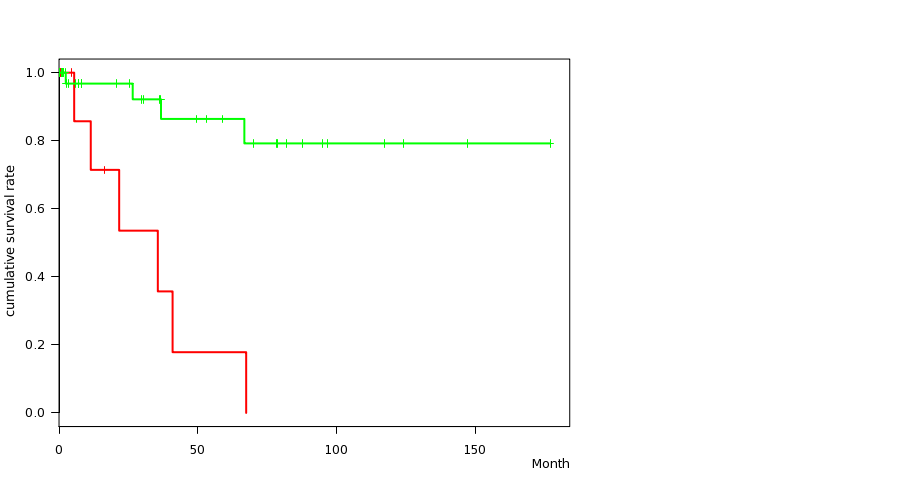
DEL PEAK 12(7Q34) MUTATION ANALYSIS cnv correlated to 'Time to Death'.
-
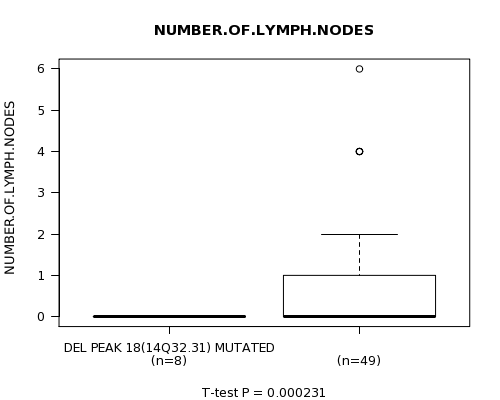
DEL PEAK 18(14Q32.31) MUTATION ANALYSIS cnv correlated to 'NUMBER.OF.LYMPH.NODES'.
-
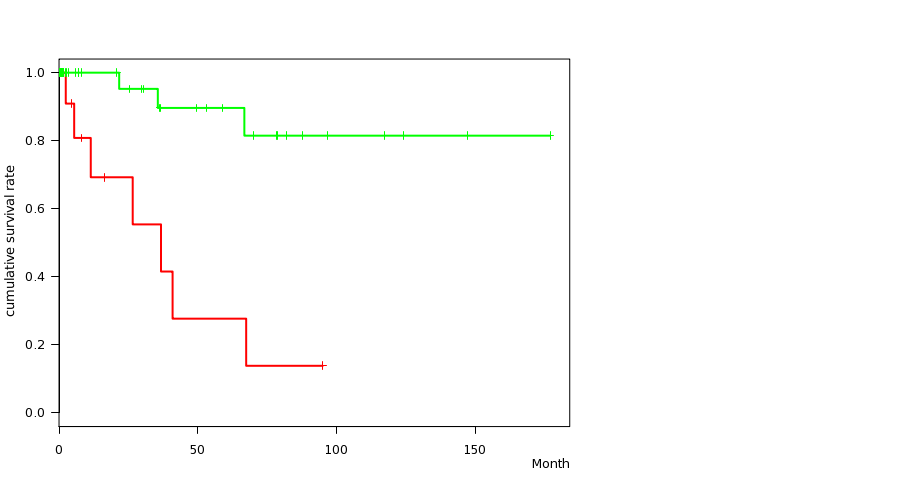
DEL PEAK 30(XQ21.33) MUTATION ANALYSIS cnv correlated to 'Time to Death'.
Table 1. Get Full Table Overview of the association between significant copy number variation of 52 focal events and 9 clinical features. Shown in the table are P values (Q values). Thresholded by Q value < 0.25, 4 significant findings detected.
|
Clinical Features |
Time to Death |
AGE |
PATHOLOGY T STAGE |
PATHOLOGY N STAGE |
PATHOLOGY M STAGE |
HISTOLOGICAL TYPE |
RADIATIONS RADIATION REGIMENINDICATION |
NUMBERPACKYEARSSMOKED |
NUMBER OF LYMPH NODES |
||
| nCNV (%) | nWild-Type | logrank test | t-test | Fisher's exact test | Fisher's exact test | Fisher's exact test | Fisher's exact test | Fisher's exact test | t-test | t-test | |
| AMP PEAK 13(11Q22 1) MUTATION ANALYSIS | 13 (19%) | 55 |
0.306 (1.00) |
0.000323 (0.145) |
0.521 (1.00) |
1 (1.00) |
1 (1.00) |
1 (1.00) |
0.445 (1.00) |
0.556 (1.00) |
|
| DEL PEAK 12(7Q34) MUTATION ANALYSIS | 12 (18%) | 56 |
2.92e-05 (0.0132) |
0.466 (1.00) |
0.726 (1.00) |
0.28 (1.00) |
0.452 (1.00) |
1 (1.00) |
0.0123 (1.00) |
0.935 (1.00) |
0.103 (1.00) |
| DEL PEAK 18(14Q32 31) MUTATION ANALYSIS | 9 (13%) | 59 |
0.186 (1.00) |
0.105 (1.00) |
0.254 (1.00) |
0.251 (1.00) |
0.618 (1.00) |
0.158 (1.00) |
0.673 (1.00) |
0.000231 (0.104) |
|
| DEL PEAK 30(XQ21 33) MUTATION ANALYSIS | 15 (22%) | 53 |
0.000125 (0.0567) |
0.679 (1.00) |
0.521 (1.00) |
0.513 (1.00) |
0.653 (1.00) |
0.801 (1.00) |
0.0649 (1.00) |
0.145 (1.00) |
0.42 (1.00) |
| AMP PEAK 1(1Q21 3) MUTATION ANALYSIS | 37 (54%) | 31 |
0.0804 (1.00) |
0.459 (1.00) |
0.294 (1.00) |
0.789 (1.00) |
0.226 (1.00) |
0.453 (1.00) |
0.55 (1.00) |
0.92 (1.00) |
0.303 (1.00) |
| AMP PEAK 2(2P24 3) MUTATION ANALYSIS | 16 (24%) | 52 |
0.718 (1.00) |
0.116 (1.00) |
0.53 (1.00) |
0.757 (1.00) |
1 (1.00) |
0.525 (1.00) |
1 (1.00) |
0.657 (1.00) |
0.62 (1.00) |
| AMP PEAK 3(2Q32 3) MUTATION ANALYSIS | 9 (13%) | 59 |
0.762 (1.00) |
0.026 (1.00) |
0.704 (1.00) |
1 (1.00) |
1 (1.00) |
1 (1.00) |
1 (1.00) |
0.428 (1.00) |
|
| AMP PEAK 4(3Q26 2) MUTATION ANALYSIS | 50 (74%) | 18 |
0.427 (1.00) |
0.78 (1.00) |
0.375 (1.00) |
0.544 (1.00) |
0.474 (1.00) |
0.00134 (0.599) |
0.323 (1.00) |
0.865 (1.00) |
0.0319 (1.00) |
| AMP PEAK 5(3Q28) MUTATION ANALYSIS | 49 (72%) | 19 |
0.147 (1.00) |
0.653 (1.00) |
0.251 (1.00) |
0.771 (1.00) |
0.346 (1.00) |
0.00202 (0.903) |
0.742 (1.00) |
0.865 (1.00) |
0.38 (1.00) |
| AMP PEAK 6(4Q12) MUTATION ANALYSIS | 8 (12%) | 60 |
0.543 (1.00) |
0.895 (1.00) |
0.406 (1.00) |
1 (1.00) |
0.514 (1.00) |
0.174 (1.00) |
0.347 (1.00) |
0.855 (1.00) |
0.19 (1.00) |
| AMP PEAK 7(6P21 33) MUTATION ANALYSIS | 19 (28%) | 49 |
0.935 (1.00) |
0.141 (1.00) |
1 (1.00) |
1 (1.00) |
0.483 (1.00) |
0.299 (1.00) |
1 (1.00) |
0.654 (1.00) |
0.177 (1.00) |
| AMP PEAK 8(8Q24 21) MUTATION ANALYSIS | 28 (41%) | 40 |
0.851 (1.00) |
0.528 (1.00) |
0.29 (1.00) |
1 (1.00) |
0.64 (1.00) |
0.812 (1.00) |
0.368 (1.00) |
0.511 (1.00) |
0.984 (1.00) |
| AMP PEAK 9(9P24 1) MUTATION ANALYSIS | 12 (18%) | 56 |
0.0942 (1.00) |
0.534 (1.00) |
0.312 (1.00) |
0.191 (1.00) |
0.828 (1.00) |
1 (1.00) |
0.435 (1.00) |
0.317 (1.00) |
0.752 (1.00) |
| AMP PEAK 10(9P24 1) MUTATION ANALYSIS | 14 (21%) | 54 |
0.0942 (1.00) |
0.992 (1.00) |
0.53 (1.00) |
0.522 (1.00) |
1 (1.00) |
1 (1.00) |
0.27 (1.00) |
0.317 (1.00) |
0.955 (1.00) |
| AMP PEAK 11(11P13) MUTATION ANALYSIS | 3 (4%) | 65 |
0.127 (1.00) |
0.333 (1.00) |
0.384 (1.00) |
0.505 (1.00) |
|||||
| AMP PEAK 12(11Q13 3) MUTATION ANALYSIS | 9 (13%) | 59 |
0.625 (1.00) |
0.138 (1.00) |
1 (1.00) |
1 (1.00) |
0.75 (1.00) |
0.302 (1.00) |
0.377 (1.00) |
0.194 (1.00) |
0.761 (1.00) |
| AMP PEAK 14(13Q22 1) MUTATION ANALYSIS | 12 (18%) | 56 |
0.232 (1.00) |
0.649 (1.00) |
0.735 (1.00) |
0.483 (1.00) |
0.819 (1.00) |
0.75 (1.00) |
0.435 (1.00) |
0.000955 (0.429) |
0.129 (1.00) |
| AMP PEAK 15(14Q24 1) MUTATION ANALYSIS | 11 (16%) | 57 |
0.919 (1.00) |
0.69 (1.00) |
0.726 (1.00) |
1 (1.00) |
0.626 (1.00) |
0.533 (1.00) |
0.437 (1.00) |
0.78 (1.00) |
0.378 (1.00) |
| AMP PEAK 16(15Q26 1) MUTATION ANALYSIS | 14 (21%) | 54 |
0.428 (1.00) |
0.781 (1.00) |
0.089 (1.00) |
1 (1.00) |
1 (1.00) |
0.158 (1.00) |
0.717 (1.00) |
0.825 (1.00) |
|
| AMP PEAK 17(16P13 13) MUTATION ANALYSIS | 13 (19%) | 55 |
0.349 (1.00) |
0.0868 (1.00) |
0.00192 (0.857) |
0.191 (1.00) |
0.114 (1.00) |
0.469 (1.00) |
1 (1.00) |
0.376 (1.00) |
|
| AMP PEAK 18(17Q12) MUTATION ANALYSIS | 7 (10%) | 61 |
0.831 (1.00) |
0.279 (1.00) |
0.0418 (1.00) |
0.036 (1.00) |
0.531 (1.00) |
1 (1.00) |
0.627 (1.00) |
0.424 (1.00) |
|
| AMP PEAK 19(17Q25 1) MUTATION ANALYSIS | 18 (26%) | 50 |
0.977 (1.00) |
0.351 (1.00) |
0.24 (1.00) |
0.0699 (1.00) |
1 (1.00) |
0.693 (1.00) |
0.745 (1.00) |
0.893 (1.00) |
0.278 (1.00) |
| AMP PEAK 20(19Q13 32) MUTATION ANALYSIS | 21 (31%) | 47 |
0.0108 (1.00) |
0.733 (1.00) |
0.782 (1.00) |
0.774 (1.00) |
0.444 (1.00) |
0.724 (1.00) |
0.00699 (1.00) |
0.644 (1.00) |
0.476 (1.00) |
| AMP PEAK 21(20Q11 21) MUTATION ANALYSIS | 27 (40%) | 41 |
0.224 (1.00) |
0.788 (1.00) |
0.418 (1.00) |
0.287 (1.00) |
0.715 (1.00) |
0.472 (1.00) |
1 (1.00) |
0.462 (1.00) |
0.681 (1.00) |
| AMP PEAK 22(XQ28) MUTATION ANALYSIS | 14 (21%) | 54 |
0.195 (1.00) |
0.038 (1.00) |
0.208 (1.00) |
0.114 (1.00) |
1 (1.00) |
0.407 (1.00) |
0.717 (1.00) |
0.175 (1.00) |
0.0375 (1.00) |
| DEL PEAK 1(1P36 23) MUTATION ANALYSIS | 10 (15%) | 58 |
0.743 (1.00) |
0.972 (1.00) |
1 (1.00) |
1 (1.00) |
0.374 (1.00) |
0.106 (1.00) |
0.418 (1.00) |
0.365 (1.00) |
0.724 (1.00) |
| DEL PEAK 2(2Q22 1) MUTATION ANALYSIS | 10 (15%) | 58 |
0.969 (1.00) |
0.211 (1.00) |
0.254 (1.00) |
0.466 (1.00) |
0.618 (1.00) |
0.522 (1.00) |
0.0254 (1.00) |
0.14 (1.00) |
0.461 (1.00) |
| DEL PEAK 3(2Q37 1) MUTATION ANALYSIS | 28 (41%) | 40 |
0.792 (1.00) |
0.00535 (1.00) |
0.18 (1.00) |
1 (1.00) |
0.714 (1.00) |
0.668 (1.00) |
1 (1.00) |
0.19 (1.00) |
0.168 (1.00) |
| DEL PEAK 4(3P22 1) MUTATION ANALYSIS | 25 (37%) | 43 |
0.171 (1.00) |
0.0599 (1.00) |
0.422 (1.00) |
0.0125 (1.00) |
0.805 (1.00) |
0.0342 (1.00) |
0.119 (1.00) |
0.627 (1.00) |
0.0229 (1.00) |
| DEL PEAK 5(3P14 2) MUTATION ANALYSIS | 29 (43%) | 39 |
0.179 (1.00) |
0.176 (1.00) |
0.422 (1.00) |
0.104 (1.00) |
0.642 (1.00) |
0.0139 (1.00) |
0.078 (1.00) |
0.483 (1.00) |
0.0428 (1.00) |
| DEL PEAK 6(4Q22 1) MUTATION ANALYSIS | 15 (22%) | 53 |
0.00324 (1.00) |
0.273 (1.00) |
1 (1.00) |
0.198 (1.00) |
0.851 (1.00) |
0.505 (1.00) |
0.275 (1.00) |
0.961 (1.00) |
0.171 (1.00) |
| DEL PEAK 7(4Q35 2) MUTATION ANALYSIS | 21 (31%) | 47 |
0.0163 (1.00) |
0.357 (1.00) |
0.565 (1.00) |
0.774 (1.00) |
0.682 (1.00) |
0.0542 (1.00) |
0.336 (1.00) |
0.483 (1.00) |
0.248 (1.00) |
| DEL PEAK 8(5Q15) MUTATION ANALYSIS | 20 (29%) | 48 |
0.024 (1.00) |
0.0484 (1.00) |
0.251 (1.00) |
0.253 (1.00) |
0.764 (1.00) |
0.142 (1.00) |
0.323 (1.00) |
0.616 (1.00) |
0.28 (1.00) |
| DEL PEAK 9(5Q35 2) MUTATION ANALYSIS | 19 (28%) | 49 |
0.024 (1.00) |
0.171 (1.00) |
0.375 (1.00) |
0.549 (1.00) |
1 (1.00) |
0.056 (1.00) |
0.191 (1.00) |
0.616 (1.00) |
0.419 (1.00) |
| DEL PEAK 10(6P24 2) MUTATION ANALYSIS | 9 (13%) | 59 |
0.663 (1.00) |
0.0147 (1.00) |
0.704 (1.00) |
0.104 (1.00) |
0.774 (1.00) |
1 (1.00) |
0.673 (1.00) |
0.481 (1.00) |
|
| DEL PEAK 11(6Q26) MUTATION ANALYSIS | 21 (31%) | 47 |
0.138 (1.00) |
0.122 (1.00) |
1 (1.00) |
0.774 (1.00) |
0.799 (1.00) |
0.646 (1.00) |
0.197 (1.00) |
0.0823 (1.00) |
0.936 (1.00) |
| DEL PEAK 13(10Q23 31) MUTATION ANALYSIS | 17 (25%) | 51 |
0.0267 (1.00) |
0.866 (1.00) |
0.769 (1.00) |
0.13 (1.00) |
0.859 (1.00) |
1 (1.00) |
0.315 (1.00) |
0.562 (1.00) |
0.0919 (1.00) |
| DEL PEAK 14(11P15 5) MUTATION ANALYSIS | 20 (29%) | 48 |
0.535 (1.00) |
0.375 (1.00) |
1 (1.00) |
0.774 (1.00) |
1 (1.00) |
0.142 (1.00) |
1 (1.00) |
0.756 (1.00) |
0.206 (1.00) |
| DEL PEAK 15(11Q25) MUTATION ANALYSIS | 43 (63%) | 25 |
0.355 (1.00) |
0.748 (1.00) |
0.592 (1.00) |
0.786 (1.00) |
1 (1.00) |
0.0179 (1.00) |
0.548 (1.00) |
0.608 (1.00) |
0.722 (1.00) |
| DEL PEAK 16(13Q12 12) MUTATION ANALYSIS | 22 (32%) | 46 |
0.707 (1.00) |
0.256 (1.00) |
1 (1.00) |
0.252 (1.00) |
0.386 (1.00) |
0.0873 (1.00) |
0.758 (1.00) |
0.438 (1.00) |
0.152 (1.00) |
| DEL PEAK 17(13Q14 2) MUTATION ANALYSIS | 25 (37%) | 43 |
0.285 (1.00) |
0.695 (1.00) |
1 (1.00) |
0.287 (1.00) |
0.558 (1.00) |
0.0342 (1.00) |
1 (1.00) |
0.46 (1.00) |
0.293 (1.00) |
| DEL PEAK 19(15Q15 1) MUTATION ANALYSIS | 15 (22%) | 53 |
0.417 (1.00) |
0.308 (1.00) |
1 (1.00) |
0.35 (1.00) |
0.851 (1.00) |
0.324 (1.00) |
0.719 (1.00) |
0.281 (1.00) |
0.982 (1.00) |
| DEL PEAK 20(16Q11 2) MUTATION ANALYSIS | 14 (21%) | 54 |
0.795 (1.00) |
0.024 (1.00) |
0.515 (1.00) |
0.0447 (1.00) |
1 (1.00) |
0.0133 (1.00) |
0.0573 (1.00) |
0.268 (1.00) |
|
| DEL PEAK 21(16Q23 1) MUTATION ANALYSIS | 13 (19%) | 55 |
0.643 (1.00) |
0.124 (1.00) |
0.737 (1.00) |
0.735 (1.00) |
0.828 (1.00) |
0.00217 (0.968) |
0.275 (1.00) |
0.442 (1.00) |
0.894 (1.00) |
| DEL PEAK 22(17P12) MUTATION ANALYSIS | 19 (28%) | 49 |
0.206 (1.00) |
0.296 (1.00) |
0.24 (1.00) |
0.771 (1.00) |
0.166 (1.00) |
1 (1.00) |
0.512 (1.00) |
0.857 (1.00) |
0.763 (1.00) |
| DEL PEAK 23(17Q25 3) MUTATION ANALYSIS | 13 (19%) | 55 |
0.0152 (1.00) |
0.95 (1.00) |
0.304 (1.00) |
0.483 (1.00) |
1 (1.00) |
0.569 (1.00) |
1 (1.00) |
0.886 (1.00) |
0.697 (1.00) |
| DEL PEAK 24(19P13 3) MUTATION ANALYSIS | 16 (24%) | 52 |
0.313 (1.00) |
0.59 (1.00) |
0.189 (1.00) |
1 (1.00) |
0.844 (1.00) |
0.294 (1.00) |
0.0781 (1.00) |
0.688 (1.00) |
0.463 (1.00) |
| DEL PEAK 25(19Q13 33) MUTATION ANALYSIS | 8 (12%) | 60 |
0.0957 (1.00) |
0.661 (1.00) |
0.43 (1.00) |
0.708 (1.00) |
0.138 (1.00) |
1 (1.00) |
1 (1.00) |
0.291 (1.00) |
|
| DEL PEAK 26(20P12 1) MUTATION ANALYSIS | 13 (19%) | 55 |
0.641 (1.00) |
0.534 (1.00) |
1 (1.00) |
0.735 (1.00) |
0.828 (1.00) |
0.469 (1.00) |
0.0554 (1.00) |
0.761 (1.00) |
0.927 (1.00) |
| DEL PEAK 27(21Q21 1) MUTATION ANALYSIS | 14 (21%) | 54 |
0.13 (1.00) |
0.206 (1.00) |
1 (1.00) |
1 (1.00) |
1 (1.00) |
1 (1.00) |
0.717 (1.00) |
0.29 (1.00) |
|
| DEL PEAK 28(22Q13 32) MUTATION ANALYSIS | 16 (24%) | 52 |
0.286 (1.00) |
0.297 (1.00) |
0.755 (1.00) |
0.522 (1.00) |
1 (1.00) |
0.404 (1.00) |
0.291 (1.00) |
0.023 (1.00) |
0.141 (1.00) |
| DEL PEAK 29(XP11 3) MUTATION ANALYSIS | 21 (31%) | 47 |
0.219 (1.00) |
0.446 (1.00) |
0.565 (1.00) |
1 (1.00) |
0.883 (1.00) |
0.32 (1.00) |
0.108 (1.00) |
0.0193 (1.00) |
0.724 (1.00) |
P value = 0.000323 (t-test), Q value = 0.15
Table S1. Gene #13: 'AMP PEAK 13(11Q22.1) MUTATION STATUS' versus Clinical Feature #2: 'AGE'
| nPatients | Mean (Std.Dev) | |
|---|---|---|
| ALL | 67 | 48.2 (13.1) |
| AMP PEAK 13(11Q22.1) MUTATED | 13 | 37.2 (9.9) |
| AMP PEAK 13(11Q22.1) WILD-TYPE | 54 | 50.8 (12.4) |
Figure S1. Get High-res Image Gene #13: 'AMP PEAK 13(11Q22.1) MUTATION STATUS' versus Clinical Feature #2: 'AGE'
P value = 2.92e-05 (logrank test), Q value = 0.013
Table S2. Gene #34: 'DEL PEAK 12(7Q34) MUTATION STATUS' versus Clinical Feature #1: 'Time to Death'
| nPatients | nDeath | Duration Range (Median), Month | |
|---|---|---|---|
| ALL | 66 | 10 | 0.1 - 177.0 (6.4) |
| DEL PEAK 12(7Q34) MUTATED | 12 | 6 | 0.6 - 67.5 (8.4) |
| DEL PEAK 12(7Q34) WILD-TYPE | 54 | 4 | 0.1 - 177.0 (6.4) |
Figure S2. Get High-res Image Gene #34: 'DEL PEAK 12(7Q34) MUTATION STATUS' versus Clinical Feature #1: 'Time to Death'
P value = 0.000231 (t-test), Q value = 0.1
Table S3. Gene #40: 'DEL PEAK 18(14Q32.31) MUTATION STATUS' versus Clinical Feature #9: 'NUMBER.OF.LYMPH.NODES'
| nPatients | Mean (Std.Dev) | |
|---|---|---|
| ALL | 57 | 0.7 (1.3) |
| DEL PEAK 18(14Q32.31) MUTATED | 8 | 0.0 (0.0) |
| DEL PEAK 18(14Q32.31) WILD-TYPE | 49 | 0.8 (1.4) |
Figure S3. Get High-res Image Gene #40: 'DEL PEAK 18(14Q32.31) MUTATION STATUS' versus Clinical Feature #9: 'NUMBER.OF.LYMPH.NODES'
P value = 0.000125 (logrank test), Q value = 0.057
Table S4. Gene #52: 'DEL PEAK 30(XQ21.33) MUTATION STATUS' versus Clinical Feature #1: 'Time to Death'
| nPatients | nDeath | Duration Range (Median), Month | |
|---|---|---|---|
| ALL | 66 | 10 | 0.1 - 177.0 (6.4) |
| DEL PEAK 30(XQ21.33) MUTATED | 15 | 7 | 0.1 - 95.1 (7.9) |
| DEL PEAK 30(XQ21.33) WILD-TYPE | 51 | 3 | 0.1 - 177.0 (6.0) |
Figure S4. Get High-res Image Gene #52: 'DEL PEAK 30(XQ21.33) MUTATION STATUS' versus Clinical Feature #1: 'Time to Death'
-
Copy number data file = transformed.cor.cli.txt
-
Clinical data file = CESC-TP.clin.merged.picked.txt
-
Number of patients = 68
-
Number of significantly focal cnvs = 52
-
Number of selected clinical features = 9
-
Exclude genes that fewer than K tumors have mutations, K = 3
For survival clinical features, the Kaplan-Meier survival curves of tumors with and without gene mutations were plotted and the statistical significance P values were estimated by logrank test (Bland and Altman 2004) using the 'survdiff' function in R
For continuous numerical clinical features, two-tailed Student's t test with unequal variance (Lehmann and Romano 2005) was applied to compare the clinical values between tumors with and without gene mutations using 't.test' function in R
For binary or multi-class clinical features (nominal or ordinal), two-tailed Fisher's exact tests (Fisher 1922) were used to estimate the P values using the 'fisher.test' function in R
For multiple hypothesis correction, Q value is the False Discovery Rate (FDR) analogue of the P value (Benjamini and Hochberg 1995), defined as the minimum FDR at which the test may be called significant. We used the 'Benjamini and Hochberg' method of 'p.adjust' function in R to convert P values into Q values.
In addition to the links below, the full results of the analysis summarized in this report can also be downloaded programmatically using firehose_get, or interactively from either the Broad GDAC website or TCGA Data Coordination Center Portal.