This pipeline computes the correlation between cancer subtypes identified by different molecular patterns and selected clinical features.
Testing the association between subtypes identified by 8 different clustering approaches and 9 clinical features across 74 patients, 6 significant findings detected with P value < 0.05 and Q value < 0.25.
-
3 subtypes identified in current cancer cohort by 'Copy Number Ratio CNMF subtypes'. These subtypes do not correlate to any clinical features.
-
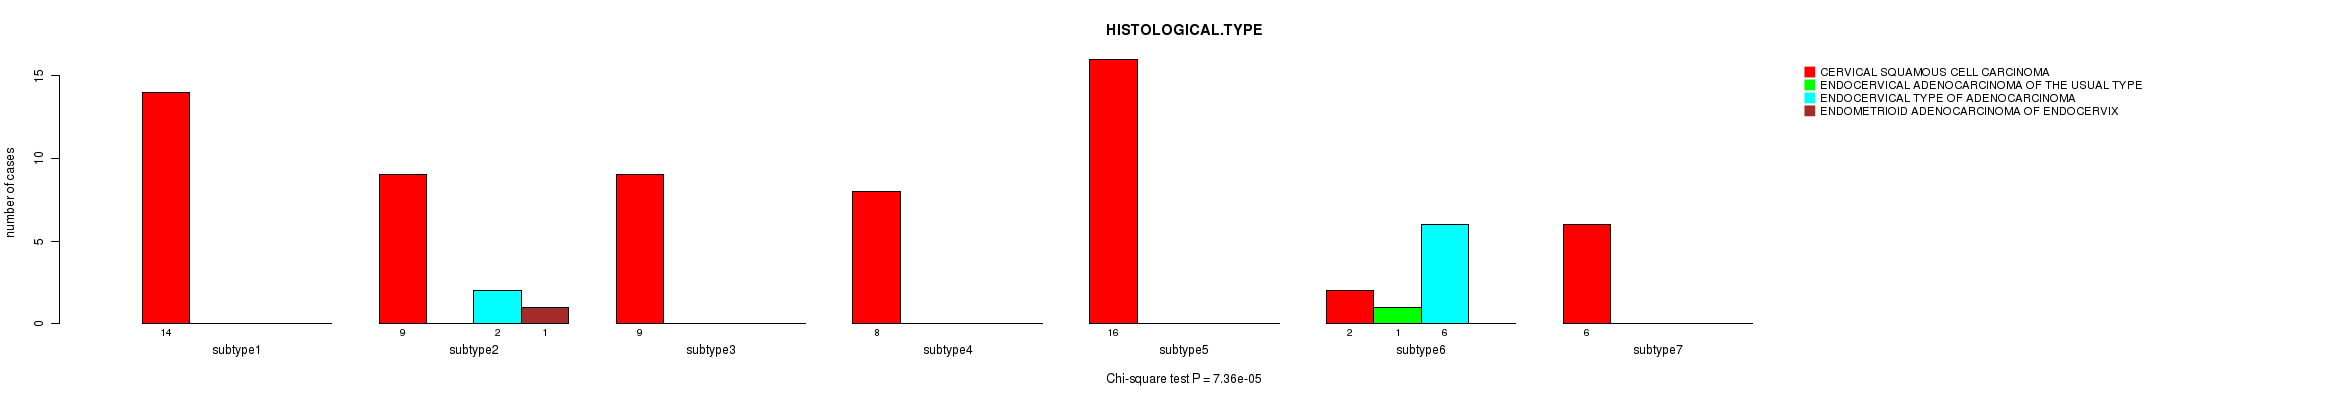
7 subtypes identified in current cancer cohort by 'METHLYATION CNMF'. These subtypes correlate to 'HISTOLOGICAL.TYPE'.
-
CNMF clustering analysis on sequencing-based mRNA expression data identified 5 subtypes that do not correlate to any clinical features.
-
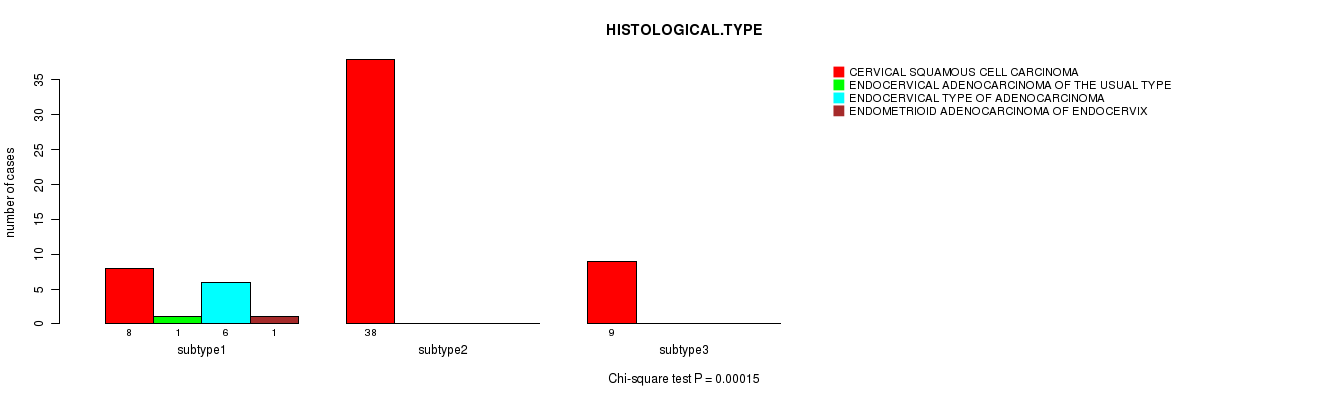
Consensus hierarchical clustering analysis on sequencing-based mRNA expression data identified 3 subtypes that correlate to 'HISTOLOGICAL.TYPE'.
-
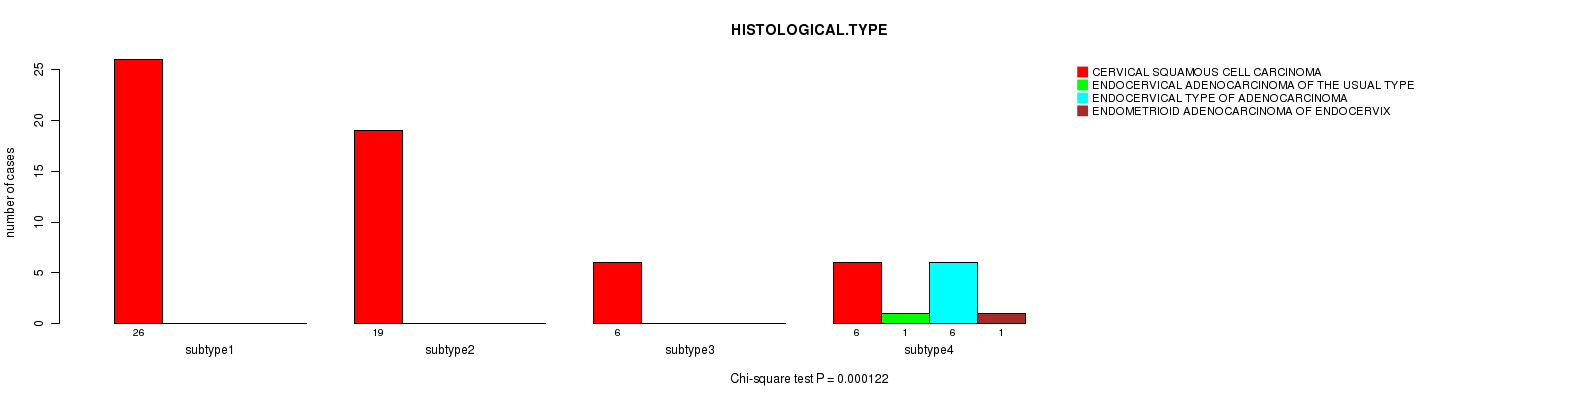
4 subtypes identified in current cancer cohort by 'MIRSEQ CNMF'. These subtypes correlate to 'HISTOLOGICAL.TYPE'.
-
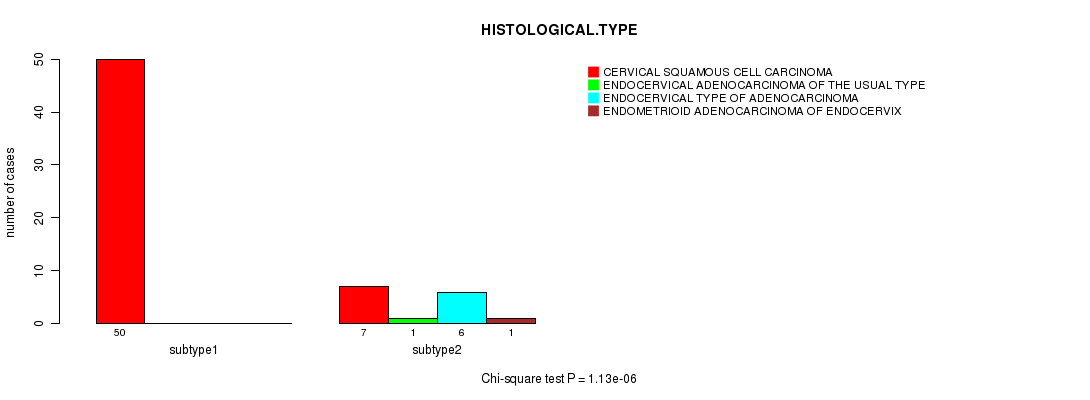
2 subtypes identified in current cancer cohort by 'MIRSEQ CHIERARCHICAL'. These subtypes correlate to 'HISTOLOGICAL.TYPE'.
-
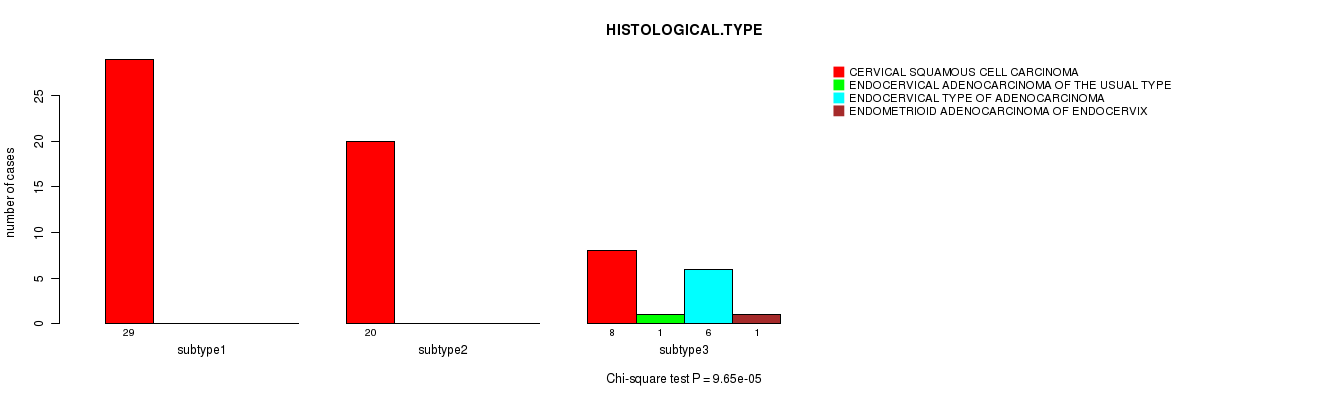
3 subtypes identified in current cancer cohort by 'MIRseq Mature CNMF subtypes'. These subtypes correlate to 'HISTOLOGICAL.TYPE'.
-
3 subtypes identified in current cancer cohort by 'MIRseq Mature cHierClus subtypes'. These subtypes correlate to 'HISTOLOGICAL.TYPE'.
Table 1. Get Full Table Overview of the association between subtypes identified by 8 different clustering approaches and 9 clinical features. Shown in the table are P values (Q values). Thresholded by P value < 0.05 and Q value < 0.25, 6 significant findings detected.
|
Clinical Features |
Statistical Tests |
Copy Number Ratio CNMF subtypes |
METHLYATION CNMF |
RNAseq CNMF subtypes |
RNAseq cHierClus subtypes |
MIRSEQ CNMF |
MIRSEQ CHIERARCHICAL |
MIRseq Mature CNMF subtypes |
MIRseq Mature cHierClus subtypes |
| Time to Death | logrank test |
0.147 (1.00) |
0.566 (1.00) |
0.166 (1.00) |
0.694 (1.00) |
0.61 (1.00) |
0.861 (1.00) |
0.74 (1.00) |
0.942 (1.00) |
| AGE | ANOVA |
0.0617 (1.00) |
0.0778 (1.00) |
0.521 (1.00) |
0.701 (1.00) |
0.108 (1.00) |
0.864 (1.00) |
0.177 (1.00) |
0.297 (1.00) |
| PATHOLOGY T STAGE | Fisher's exact test |
0.414 (1.00) |
0.688 (1.00) |
0.578 (1.00) |
0.352 (1.00) |
0.651 (1.00) |
0.537 (1.00) |
0.65 (1.00) |
0.939 (1.00) |
| PATHOLOGY N STAGE | Fisher's exact test |
0.62 (1.00) |
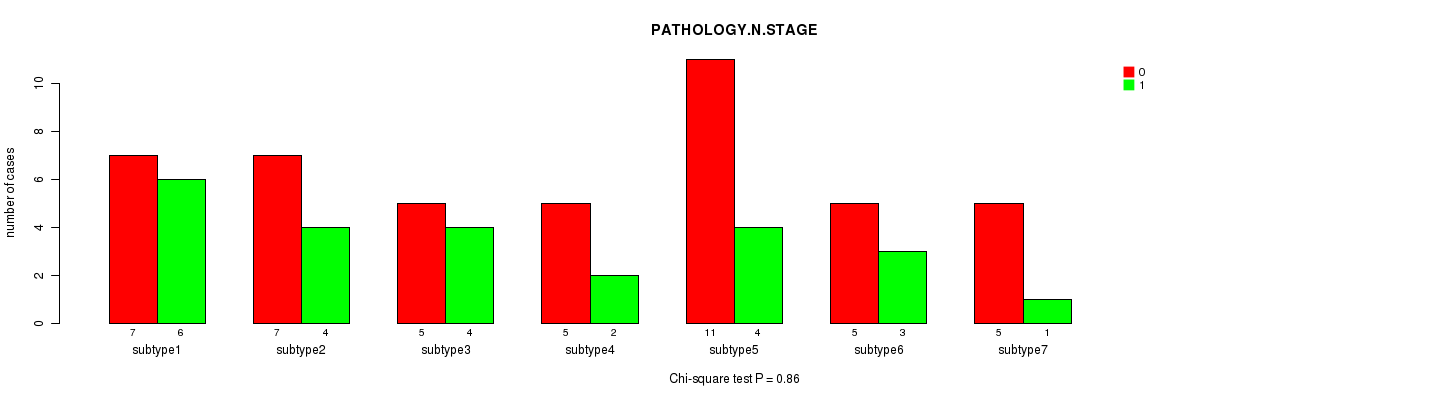
0.86 (1.00) |
0.695 (1.00) |
0.728 (1.00) |
0.604 (1.00) |
0.532 (1.00) |
1 (1.00) |
0.507 (1.00) |
| PATHOLOGY M STAGE | Chi-square test |
0.384 (1.00) |
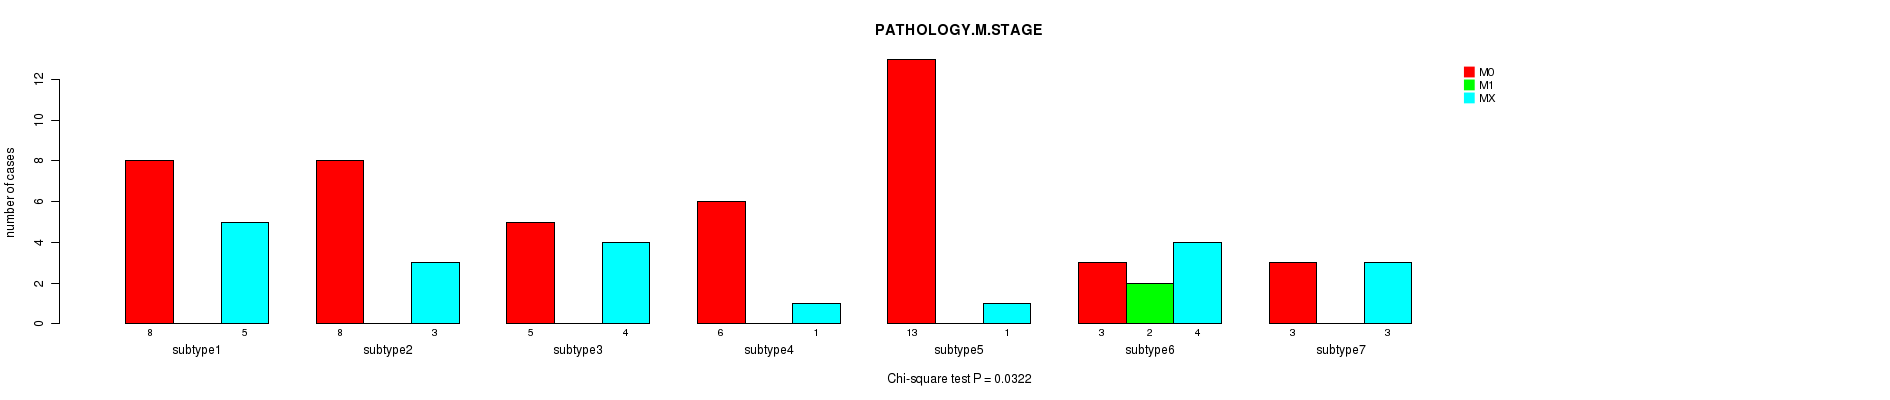
0.0322 (1.00) |
0.758 (1.00) |
0.0834 (1.00) |
0.179 (1.00) |
0.0283 (1.00) |
0.113 (1.00) |
0.178 (1.00) |
| HISTOLOGICAL TYPE | Chi-square test |
0.257 (1.00) |
7.36e-05 (0.00523) |
0.0364 (1.00) |
0.00015 (0.0101) |
0.000122 (0.00827) |
1.13e-06 (8.15e-05) |
9.65e-05 (0.00675) |
9.65e-05 (0.00675) |
| RADIATIONS RADIATION REGIMENINDICATION | Fisher's exact test |
0.55 (1.00) |
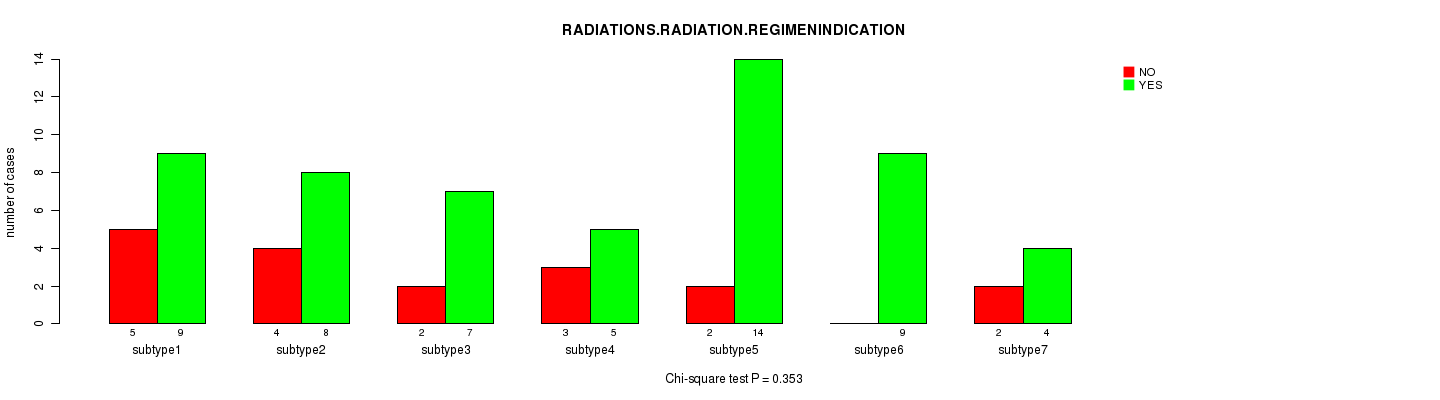
0.353 (1.00) |
0.0223 (1.00) |
0.711 (1.00) |
0.253 (1.00) |
1 (1.00) |
0.133 (1.00) |
1 (1.00) |
| NUMBERPACKYEARSSMOKED | ANOVA |
0.421 (1.00) |
0.96 (1.00) |
0.872 (1.00) |
0.714 (1.00) |
0.838 (1.00) |
0.707 (1.00) |
0.728 (1.00) |
0.654 (1.00) |
| NUMBER OF LYMPH NODES | ANOVA |
0.494 (1.00) |
0.787 (1.00) |
0.645 (1.00) |
0.705 (1.00) |
0.546 (1.00) |
0.369 (1.00) |
0.77 (1.00) |
0.321 (1.00) |
Table S1. Description of clustering approach #1: 'Copy Number Ratio CNMF subtypes'
| Cluster Labels | 1 | 2 | 3 |
|---|---|---|---|
| Number of samples | 24 | 16 | 28 |
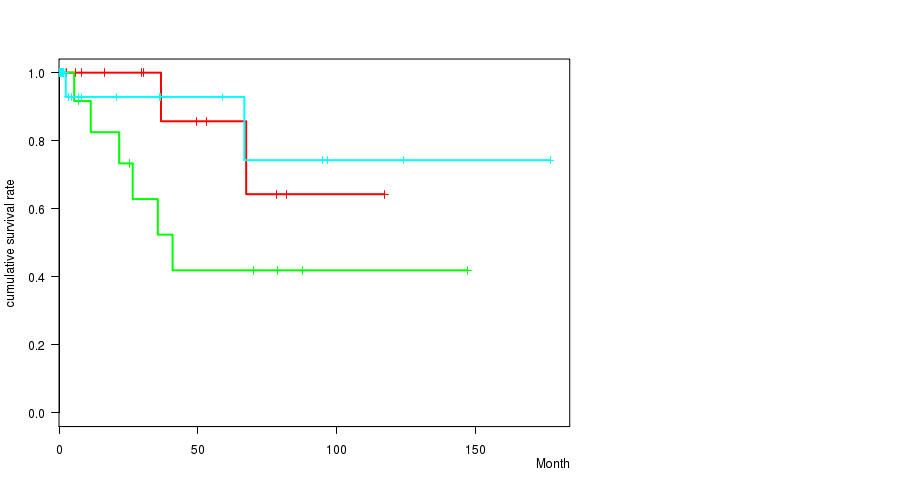
P value = 0.147 (logrank test), Q value = 1
Table S2. Clustering Approach #1: 'Copy Number Ratio CNMF subtypes' versus Clinical Feature #1: 'Time to Death'
| nPatients | nDeath | Duration Range (Median), Month | |
|---|---|---|---|
| ALL | 66 | 10 | 0.1 - 177.0 (6.4) |
| subtype1 | 22 | 2 | 0.3 - 117.4 (7.0) |
| subtype2 | 16 | 6 | 0.1 - 147.3 (23.5) |
| subtype3 | 28 | 2 | 0.1 - 177.0 (2.3) |
Figure S1. Get High-res Image Clustering Approach #1: 'Copy Number Ratio CNMF subtypes' versus Clinical Feature #1: 'Time to Death'
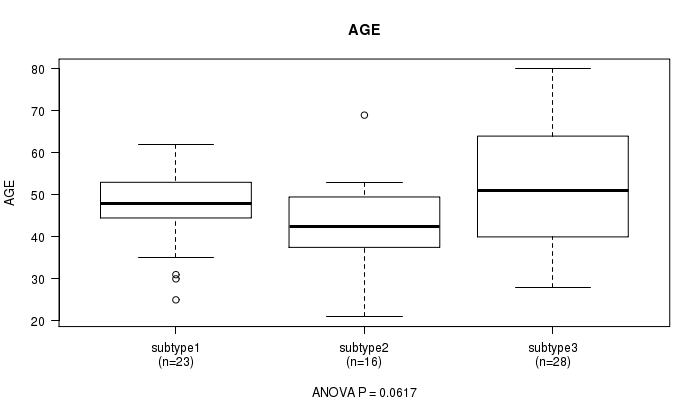
P value = 0.0617 (ANOVA), Q value = 1
Table S3. Clustering Approach #1: 'Copy Number Ratio CNMF subtypes' versus Clinical Feature #2: 'AGE'
| nPatients | Mean (Std.Dev) | |
|---|---|---|
| ALL | 67 | 48.2 (13.1) |
| subtype1 | 23 | 47.3 (9.9) |
| subtype2 | 16 | 42.6 (11.3) |
| subtype3 | 28 | 52.1 (15.3) |
Figure S2. Get High-res Image Clustering Approach #1: 'Copy Number Ratio CNMF subtypes' versus Clinical Feature #2: 'AGE'
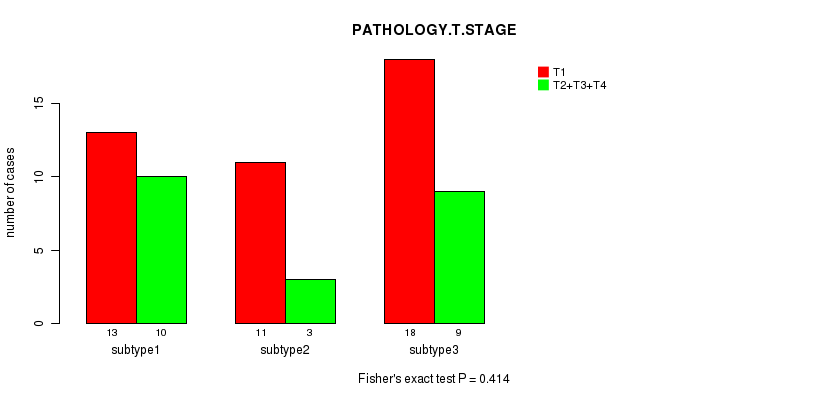
P value = 0.414 (Fisher's exact test), Q value = 1
Table S4. Clustering Approach #1: 'Copy Number Ratio CNMF subtypes' versus Clinical Feature #3: 'PATHOLOGY.T.STAGE'
| nPatients | T1 | T2+T3+T4 |
|---|---|---|
| ALL | 42 | 22 |
| subtype1 | 13 | 10 |
| subtype2 | 11 | 3 |
| subtype3 | 18 | 9 |
Figure S3. Get High-res Image Clustering Approach #1: 'Copy Number Ratio CNMF subtypes' versus Clinical Feature #3: 'PATHOLOGY.T.STAGE'
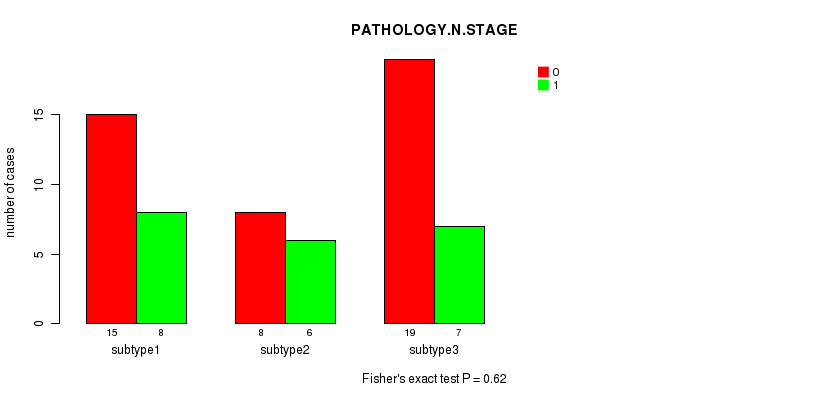
P value = 0.62 (Fisher's exact test), Q value = 1
Table S5. Clustering Approach #1: 'Copy Number Ratio CNMF subtypes' versus Clinical Feature #4: 'PATHOLOGY.N.STAGE'
| nPatients | 0 | 1 |
|---|---|---|
| ALL | 42 | 21 |
| subtype1 | 15 | 8 |
| subtype2 | 8 | 6 |
| subtype3 | 19 | 7 |
Figure S4. Get High-res Image Clustering Approach #1: 'Copy Number Ratio CNMF subtypes' versus Clinical Feature #4: 'PATHOLOGY.N.STAGE'
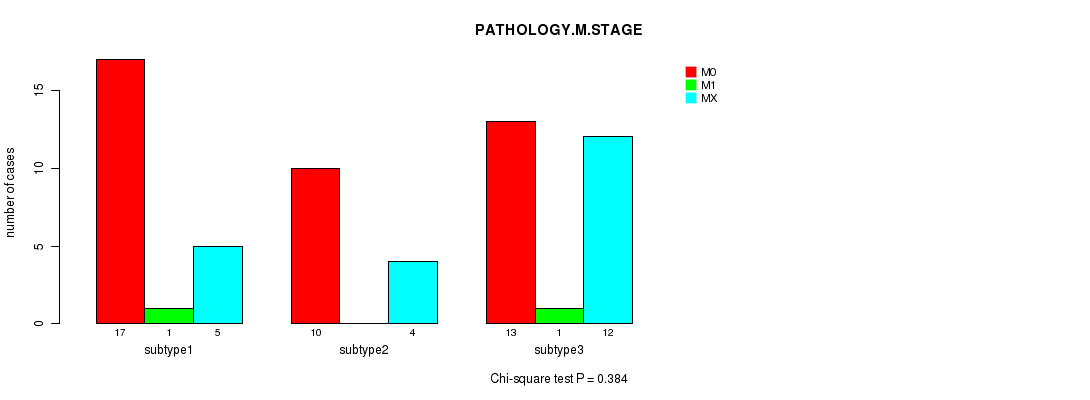
P value = 0.384 (Chi-square test), Q value = 1
Table S6. Clustering Approach #1: 'Copy Number Ratio CNMF subtypes' versus Clinical Feature #5: 'PATHOLOGY.M.STAGE'
| nPatients | M0 | M1 | MX |
|---|---|---|---|
| ALL | 40 | 2 | 21 |
| subtype1 | 17 | 1 | 5 |
| subtype2 | 10 | 0 | 4 |
| subtype3 | 13 | 1 | 12 |
Figure S5. Get High-res Image Clustering Approach #1: 'Copy Number Ratio CNMF subtypes' versus Clinical Feature #5: 'PATHOLOGY.M.STAGE'
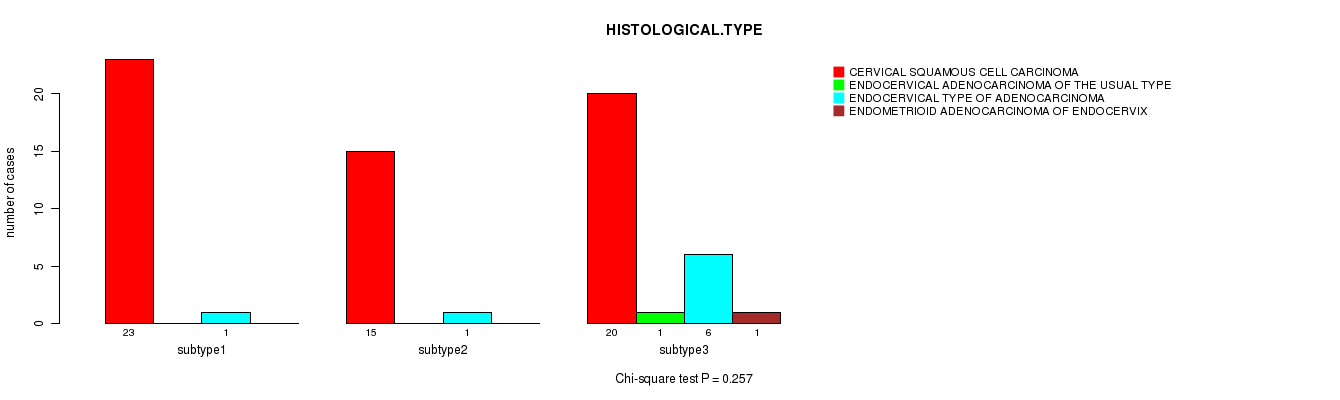
P value = 0.257 (Chi-square test), Q value = 1
Table S7. Clustering Approach #1: 'Copy Number Ratio CNMF subtypes' versus Clinical Feature #6: 'HISTOLOGICAL.TYPE'
| nPatients | CERVICAL SQUAMOUS CELL CARCINOMA | ENDOCERVICAL ADENOCARCINOMA OF THE USUAL TYPE | ENDOCERVICAL TYPE OF ADENOCARCINOMA | ENDOMETRIOID ADENOCARCINOMA OF ENDOCERVIX |
|---|---|---|---|---|
| ALL | 58 | 1 | 8 | 1 |
| subtype1 | 23 | 0 | 1 | 0 |
| subtype2 | 15 | 0 | 1 | 0 |
| subtype3 | 20 | 1 | 6 | 1 |
Figure S6. Get High-res Image Clustering Approach #1: 'Copy Number Ratio CNMF subtypes' versus Clinical Feature #6: 'HISTOLOGICAL.TYPE'
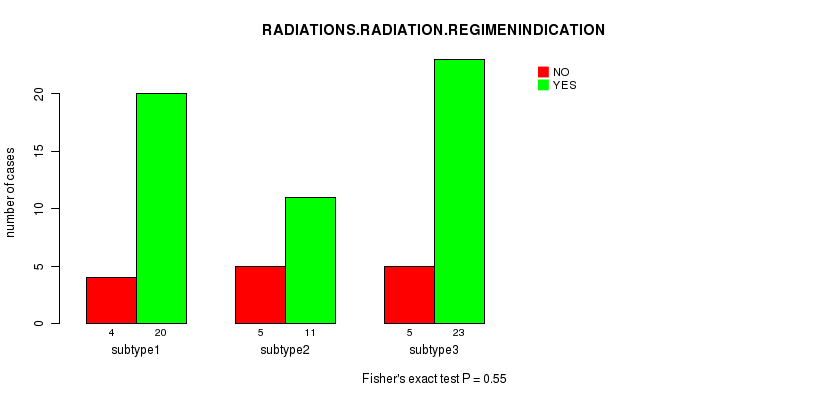
P value = 0.55 (Fisher's exact test), Q value = 1
Table S8. Clustering Approach #1: 'Copy Number Ratio CNMF subtypes' versus Clinical Feature #7: 'RADIATIONS.RADIATION.REGIMENINDICATION'
| nPatients | NO | YES |
|---|---|---|
| ALL | 14 | 54 |
| subtype1 | 4 | 20 |
| subtype2 | 5 | 11 |
| subtype3 | 5 | 23 |
Figure S7. Get High-res Image Clustering Approach #1: 'Copy Number Ratio CNMF subtypes' versus Clinical Feature #7: 'RADIATIONS.RADIATION.REGIMENINDICATION'
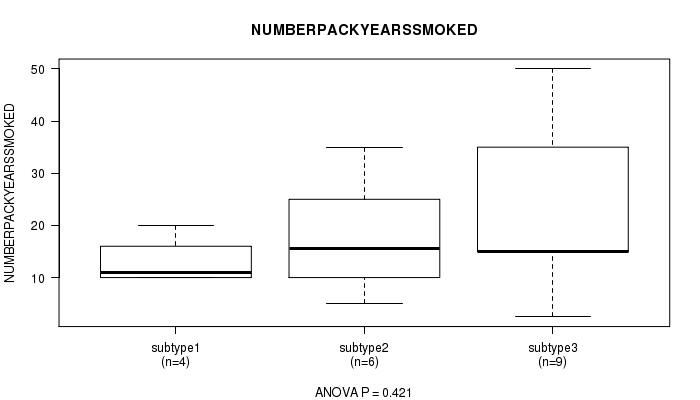
P value = 0.421 (ANOVA), Q value = 1
Table S9. Clustering Approach #1: 'Copy Number Ratio CNMF subtypes' versus Clinical Feature #8: 'NUMBERPACKYEARSSMOKED'
| nPatients | Mean (Std.Dev) | |
|---|---|---|
| ALL | 19 | 19.2 (12.8) |
| subtype1 | 4 | 13.0 (4.8) |
| subtype2 | 6 | 17.7 (11.2) |
| subtype3 | 9 | 23.1 (15.6) |
Figure S8. Get High-res Image Clustering Approach #1: 'Copy Number Ratio CNMF subtypes' versus Clinical Feature #8: 'NUMBERPACKYEARSSMOKED'
P value = 0.494 (ANOVA), Q value = 1
Table S10. Clustering Approach #1: 'Copy Number Ratio CNMF subtypes' versus Clinical Feature #9: 'NUMBER.OF.LYMPH.NODES'
| nPatients | Mean (Std.Dev) | |
|---|---|---|
| ALL | 57 | 0.7 (1.3) |
| subtype1 | 20 | 0.8 (1.3) |
| subtype2 | 14 | 0.9 (1.4) |
| subtype3 | 23 | 0.4 (1.3) |
Figure S9. Get High-res Image Clustering Approach #1: 'Copy Number Ratio CNMF subtypes' versus Clinical Feature #9: 'NUMBER.OF.LYMPH.NODES'
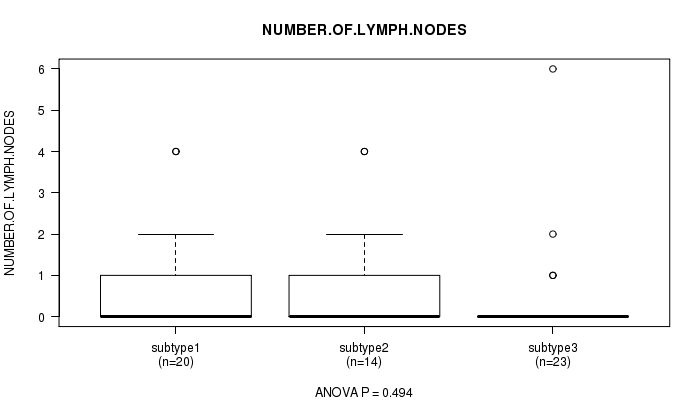
Table S11. Description of clustering approach #2: 'METHLYATION CNMF'
| Cluster Labels | 1 | 2 | 3 | 4 | 5 | 6 | 7 |
|---|---|---|---|---|---|---|---|
| Number of samples | 14 | 12 | 9 | 8 | 16 | 9 | 6 |
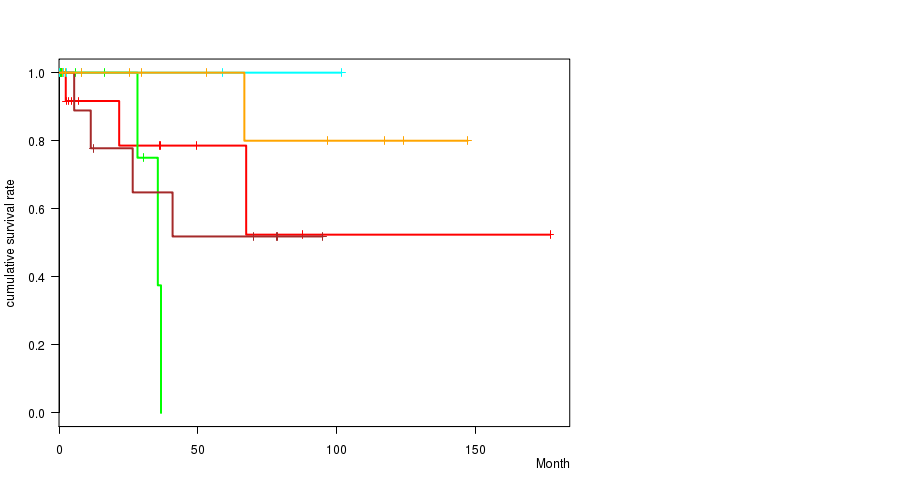
P value = 0.566 (logrank test), Q value = 1
Table S12. Clustering Approach #2: 'METHLYATION CNMF' versus Clinical Feature #1: 'Time to Death'
| nPatients | nDeath | Duration Range (Median), Month | |
|---|---|---|---|
| ALL | 72 | 13 | 0.1 - 177.0 (7.4) |
| subtype1 | 14 | 2 | 0.1 - 177.0 (14.8) |
| subtype2 | 11 | 2 | 0.3 - 124.3 (6.0) |
| subtype3 | 9 | 0 | 0.3 - 78.3 (4.3) |
| subtype4 | 8 | 2 | 0.1 - 95.1 (6.2) |
| subtype5 | 15 | 6 | 0.1 - 147.3 (26.6) |
| subtype6 | 9 | 1 | 1.1 - 96.9 (7.9) |
| subtype7 | 6 | 0 | 0.6 - 53.1 (4.8) |
Figure S10. Get High-res Image Clustering Approach #2: 'METHLYATION CNMF' versus Clinical Feature #1: 'Time to Death'
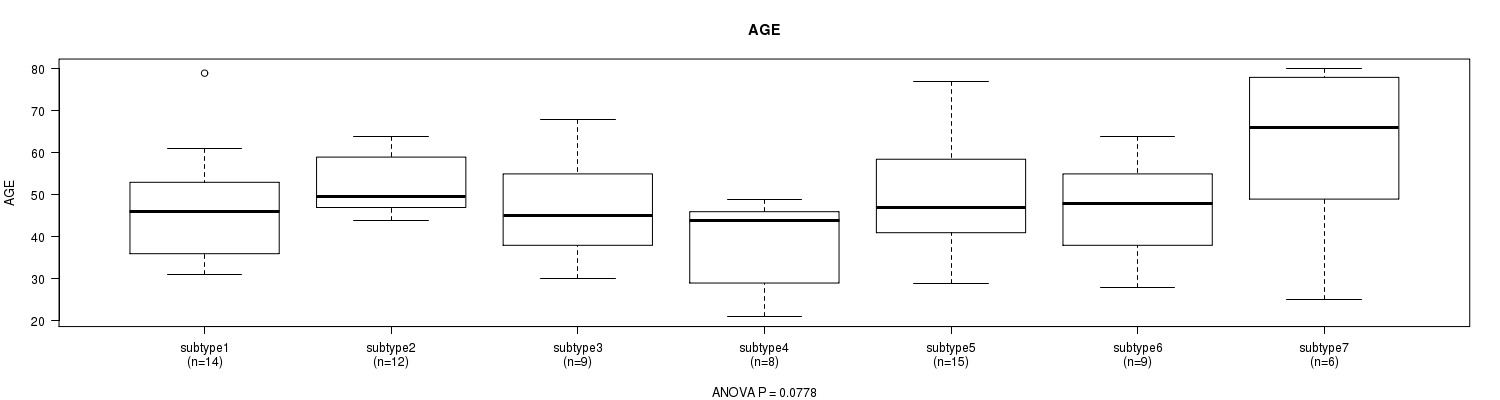
P value = 0.0778 (ANOVA), Q value = 1
Table S13. Clustering Approach #2: 'METHLYATION CNMF' versus Clinical Feature #2: 'AGE'
| nPatients | Mean (Std.Dev) | |
|---|---|---|
| ALL | 73 | 48.8 (13.4) |
| subtype1 | 14 | 47.1 (12.7) |
| subtype2 | 12 | 51.9 (6.7) |
| subtype3 | 9 | 46.3 (12.8) |
| subtype4 | 8 | 38.5 (10.6) |
| subtype5 | 15 | 50.9 (14.4) |
| subtype6 | 9 | 47.6 (12.0) |
| subtype7 | 6 | 60.7 (20.7) |
Figure S11. Get High-res Image Clustering Approach #2: 'METHLYATION CNMF' versus Clinical Feature #2: 'AGE'
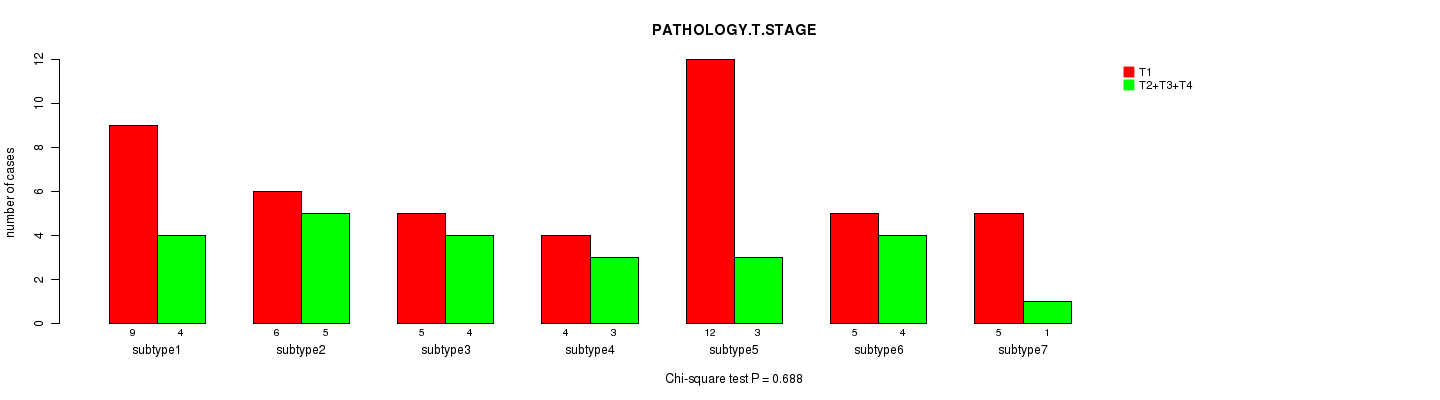
P value = 0.688 (Chi-square test), Q value = 1
Table S14. Clustering Approach #2: 'METHLYATION CNMF' versus Clinical Feature #3: 'PATHOLOGY.T.STAGE'
| nPatients | T1 | T2+T3+T4 |
|---|---|---|
| ALL | 46 | 24 |
| subtype1 | 9 | 4 |
| subtype2 | 6 | 5 |
| subtype3 | 5 | 4 |
| subtype4 | 4 | 3 |
| subtype5 | 12 | 3 |
| subtype6 | 5 | 4 |
| subtype7 | 5 | 1 |
Figure S12. Get High-res Image Clustering Approach #2: 'METHLYATION CNMF' versus Clinical Feature #3: 'PATHOLOGY.T.STAGE'
P value = 0.86 (Chi-square test), Q value = 1
Table S15. Clustering Approach #2: 'METHLYATION CNMF' versus Clinical Feature #4: 'PATHOLOGY.N.STAGE'
| nPatients | 0 | 1 |
|---|---|---|
| ALL | 45 | 24 |
| subtype1 | 7 | 6 |
| subtype2 | 7 | 4 |
| subtype3 | 5 | 4 |
| subtype4 | 5 | 2 |
| subtype5 | 11 | 4 |
| subtype6 | 5 | 3 |
| subtype7 | 5 | 1 |
Figure S13. Get High-res Image Clustering Approach #2: 'METHLYATION CNMF' versus Clinical Feature #4: 'PATHOLOGY.N.STAGE'
P value = 0.0322 (Chi-square test), Q value = 1
Table S16. Clustering Approach #2: 'METHLYATION CNMF' versus Clinical Feature #5: 'PATHOLOGY.M.STAGE'
| nPatients | M0 | M1 | MX |
|---|---|---|---|
| ALL | 46 | 2 | 21 |
| subtype1 | 8 | 0 | 5 |
| subtype2 | 8 | 0 | 3 |
| subtype3 | 5 | 0 | 4 |
| subtype4 | 6 | 0 | 1 |
| subtype5 | 13 | 0 | 1 |
| subtype6 | 3 | 2 | 4 |
| subtype7 | 3 | 0 | 3 |
Figure S14. Get High-res Image Clustering Approach #2: 'METHLYATION CNMF' versus Clinical Feature #5: 'PATHOLOGY.M.STAGE'
P value = 7.36e-05 (Chi-square test), Q value = 0.0052
Table S17. Clustering Approach #2: 'METHLYATION CNMF' versus Clinical Feature #6: 'HISTOLOGICAL.TYPE'
| nPatients | CERVICAL SQUAMOUS CELL CARCINOMA | ENDOCERVICAL ADENOCARCINOMA OF THE USUAL TYPE | ENDOCERVICAL TYPE OF ADENOCARCINOMA | ENDOMETRIOID ADENOCARCINOMA OF ENDOCERVIX |
|---|---|---|---|---|
| ALL | 64 | 1 | 8 | 1 |
| subtype1 | 14 | 0 | 0 | 0 |
| subtype2 | 9 | 0 | 2 | 1 |
| subtype3 | 9 | 0 | 0 | 0 |
| subtype4 | 8 | 0 | 0 | 0 |
| subtype5 | 16 | 0 | 0 | 0 |
| subtype6 | 2 | 1 | 6 | 0 |
| subtype7 | 6 | 0 | 0 | 0 |
Figure S15. Get High-res Image Clustering Approach #2: 'METHLYATION CNMF' versus Clinical Feature #6: 'HISTOLOGICAL.TYPE'
P value = 0.353 (Chi-square test), Q value = 1
Table S18. Clustering Approach #2: 'METHLYATION CNMF' versus Clinical Feature #7: 'RADIATIONS.RADIATION.REGIMENINDICATION'
| nPatients | NO | YES |
|---|---|---|
| ALL | 18 | 56 |
| subtype1 | 5 | 9 |
| subtype2 | 4 | 8 |
| subtype3 | 2 | 7 |
| subtype4 | 3 | 5 |
| subtype5 | 2 | 14 |
| subtype6 | 0 | 9 |
| subtype7 | 2 | 4 |
Figure S16. Get High-res Image Clustering Approach #2: 'METHLYATION CNMF' versus Clinical Feature #7: 'RADIATIONS.RADIATION.REGIMENINDICATION'
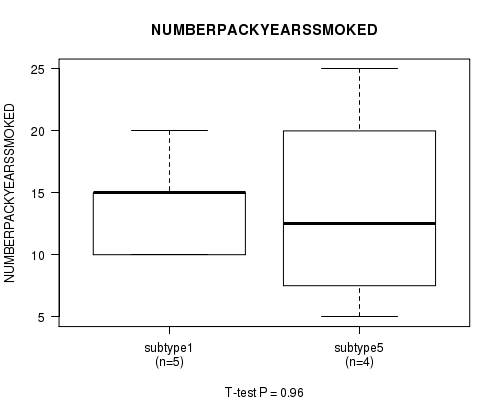
P value = 0.96 (ANOVA), Q value = 1
Table S19. Clustering Approach #2: 'METHLYATION CNMF' versus Clinical Feature #8: 'NUMBERPACKYEARSSMOKED'
| nPatients | Mean (Std.Dev) | |
|---|---|---|
| ALL | 19 | 19.2 (12.8) |
| subtype1 | 5 | 14.0 (4.2) |
| subtype2 | 2 | 23.5 (16.3) |
| subtype3 | 2 | 37.5 (17.7) |
| subtype4 | 2 | 15.5 (6.4) |
| subtype5 | 4 | 13.8 (8.5) |
| subtype6 | 2 | 21.2 (26.5) |
| subtype7 | 2 | 22.5 (17.7) |
Figure S17. Get High-res Image Clustering Approach #2: 'METHLYATION CNMF' versus Clinical Feature #8: 'NUMBERPACKYEARSSMOKED'
P value = 0.787 (ANOVA), Q value = 1
Table S20. Clustering Approach #2: 'METHLYATION CNMF' versus Clinical Feature #9: 'NUMBER.OF.LYMPH.NODES'
| nPatients | Mean (Std.Dev) | |
|---|---|---|
| ALL | 63 | 1.0 (2.5) |
| subtype1 | 9 | 0.8 (1.4) |
| subtype2 | 10 | 2.2 (5.0) |
| subtype3 | 9 | 1.1 (1.5) |
| subtype4 | 7 | 1.1 (2.3) |
| subtype5 | 14 | 0.8 (2.1) |
| subtype6 | 8 | 0.8 (1.4) |
| subtype7 | 6 | 0.2 (0.4) |
Figure S18. Get High-res Image Clustering Approach #2: 'METHLYATION CNMF' versus Clinical Feature #9: 'NUMBER.OF.LYMPH.NODES'
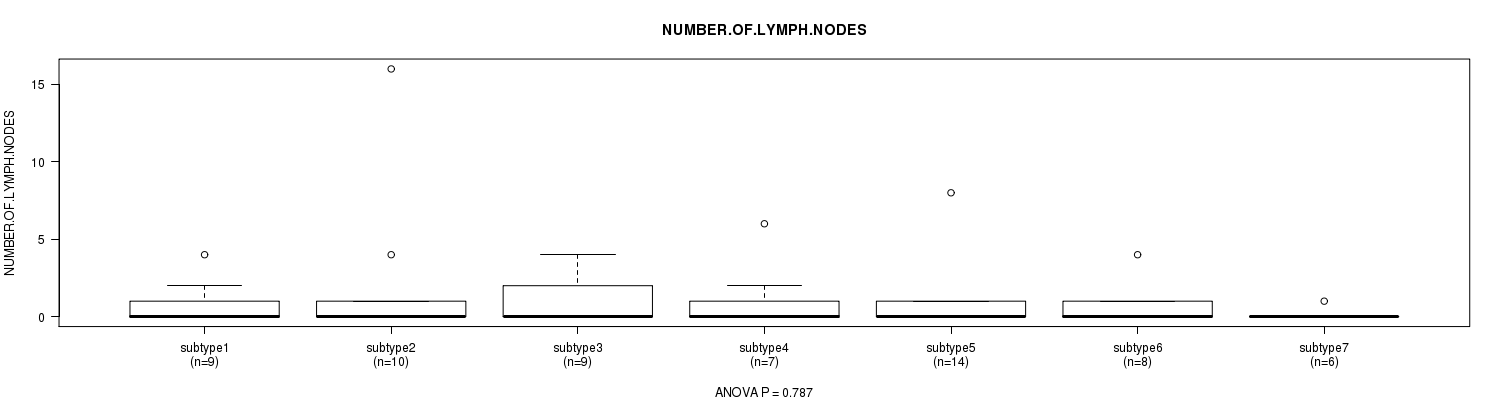
Table S21. Description of clustering approach #3: 'RNAseq CNMF subtypes'
| Cluster Labels | 1 | 2 | 3 | 4 | 5 |
|---|---|---|---|---|---|
| Number of samples | 21 | 14 | 7 | 9 | 12 |
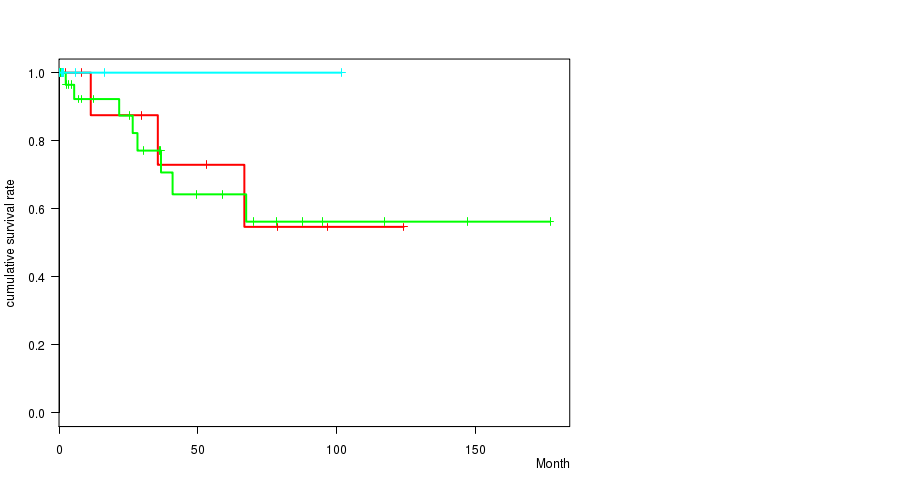
P value = 0.166 (logrank test), Q value = 1
Table S22. Clustering Approach #3: 'RNAseq CNMF subtypes' versus Clinical Feature #1: 'Time to Death'
| nPatients | nDeath | Duration Range (Median), Month | |
|---|---|---|---|
| ALL | 62 | 11 | 0.1 - 177.0 (8.0) |
| subtype1 | 21 | 3 | 0.1 - 177.0 (2.7) |
| subtype2 | 13 | 3 | 0.3 - 36.8 (1.5) |
| subtype3 | 7 | 0 | 0.1 - 101.8 (2.7) |
| subtype4 | 9 | 4 | 5.5 - 95.1 (40.9) |
| subtype5 | 12 | 1 | 1.2 - 147.3 (41.4) |
Figure S19. Get High-res Image Clustering Approach #3: 'RNAseq CNMF subtypes' versus Clinical Feature #1: 'Time to Death'
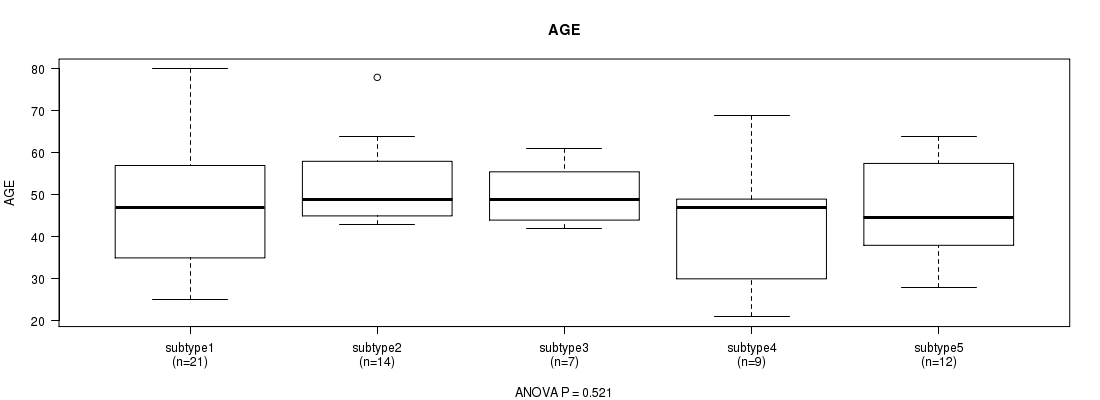
P value = 0.521 (ANOVA), Q value = 1
Table S23. Clustering Approach #3: 'RNAseq CNMF subtypes' versus Clinical Feature #2: 'AGE'
| nPatients | Mean (Std.Dev) | |
|---|---|---|
| ALL | 63 | 48.4 (13.1) |
| subtype1 | 21 | 48.9 (16.0) |
| subtype2 | 14 | 52.1 (9.8) |
| subtype3 | 7 | 50.1 (7.8) |
| subtype4 | 9 | 42.4 (14.8) |
| subtype5 | 12 | 46.8 (11.8) |
Figure S20. Get High-res Image Clustering Approach #3: 'RNAseq CNMF subtypes' versus Clinical Feature #2: 'AGE'
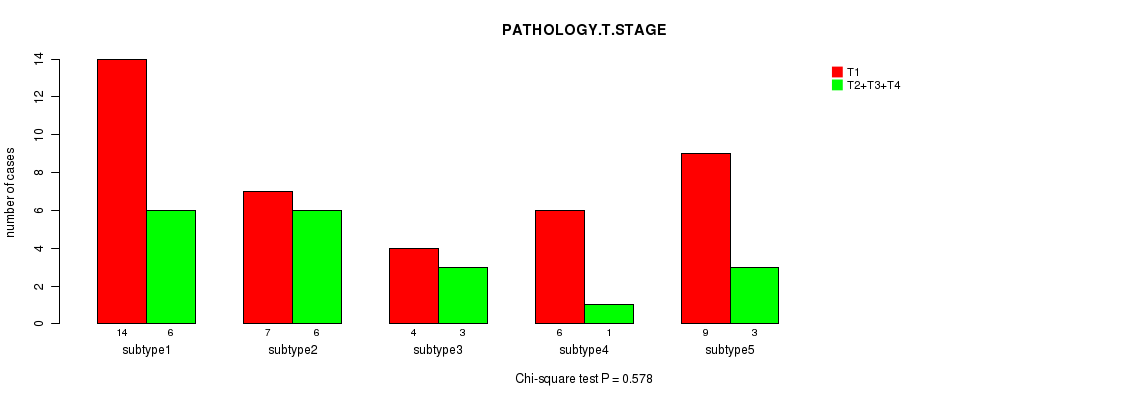
P value = 0.578 (Chi-square test), Q value = 1
Table S24. Clustering Approach #3: 'RNAseq CNMF subtypes' versus Clinical Feature #3: 'PATHOLOGY.T.STAGE'
| nPatients | T1 | T2+T3+T4 |
|---|---|---|
| ALL | 40 | 19 |
| subtype1 | 14 | 6 |
| subtype2 | 7 | 6 |
| subtype3 | 4 | 3 |
| subtype4 | 6 | 1 |
| subtype5 | 9 | 3 |
Figure S21. Get High-res Image Clustering Approach #3: 'RNAseq CNMF subtypes' versus Clinical Feature #3: 'PATHOLOGY.T.STAGE'
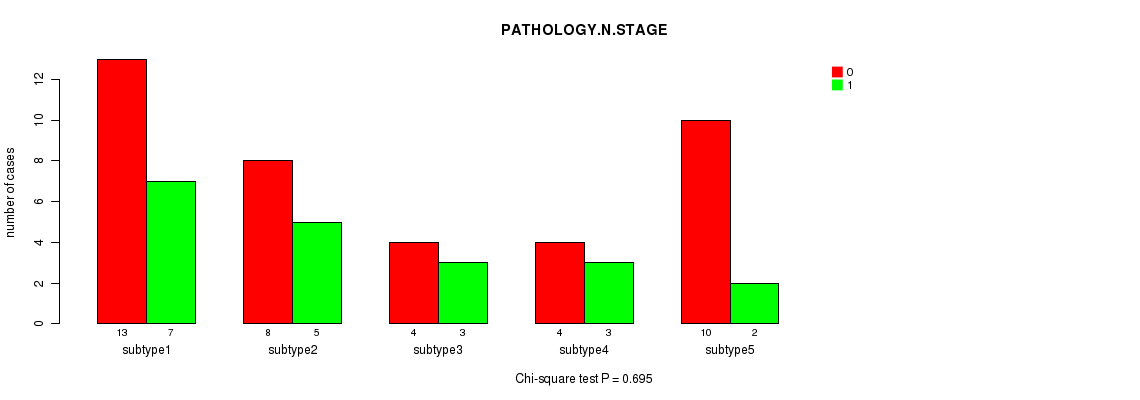
P value = 0.695 (Chi-square test), Q value = 1
Table S25. Clustering Approach #3: 'RNAseq CNMF subtypes' versus Clinical Feature #4: 'PATHOLOGY.N.STAGE'
| nPatients | 0 | 1 |
|---|---|---|
| ALL | 39 | 20 |
| subtype1 | 13 | 7 |
| subtype2 | 8 | 5 |
| subtype3 | 4 | 3 |
| subtype4 | 4 | 3 |
| subtype5 | 10 | 2 |
Figure S22. Get High-res Image Clustering Approach #3: 'RNAseq CNMF subtypes' versus Clinical Feature #4: 'PATHOLOGY.N.STAGE'
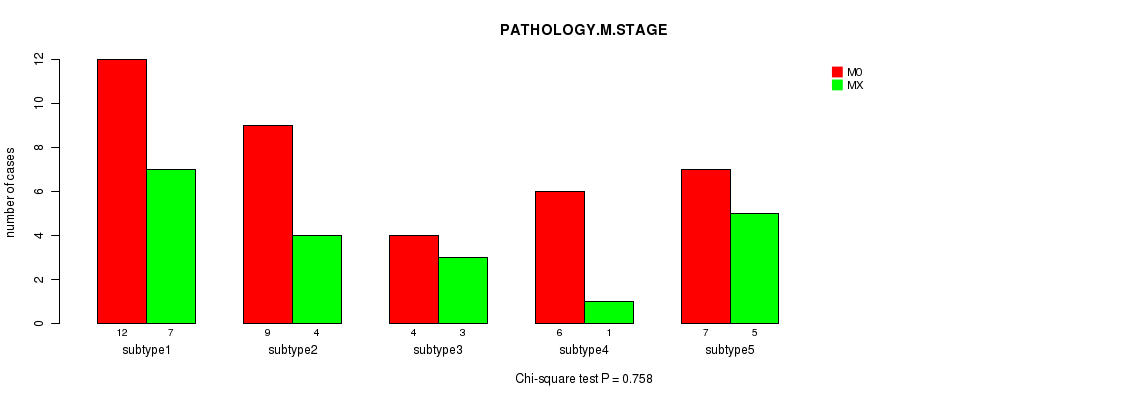
P value = 0.758 (Chi-square test), Q value = 1
Table S26. Clustering Approach #3: 'RNAseq CNMF subtypes' versus Clinical Feature #5: 'PATHOLOGY.M.STAGE'
| nPatients | M0 | MX |
|---|---|---|
| ALL | 38 | 20 |
| subtype1 | 12 | 7 |
| subtype2 | 9 | 4 |
| subtype3 | 4 | 3 |
| subtype4 | 6 | 1 |
| subtype5 | 7 | 5 |
Figure S23. Get High-res Image Clustering Approach #3: 'RNAseq CNMF subtypes' versus Clinical Feature #5: 'PATHOLOGY.M.STAGE'
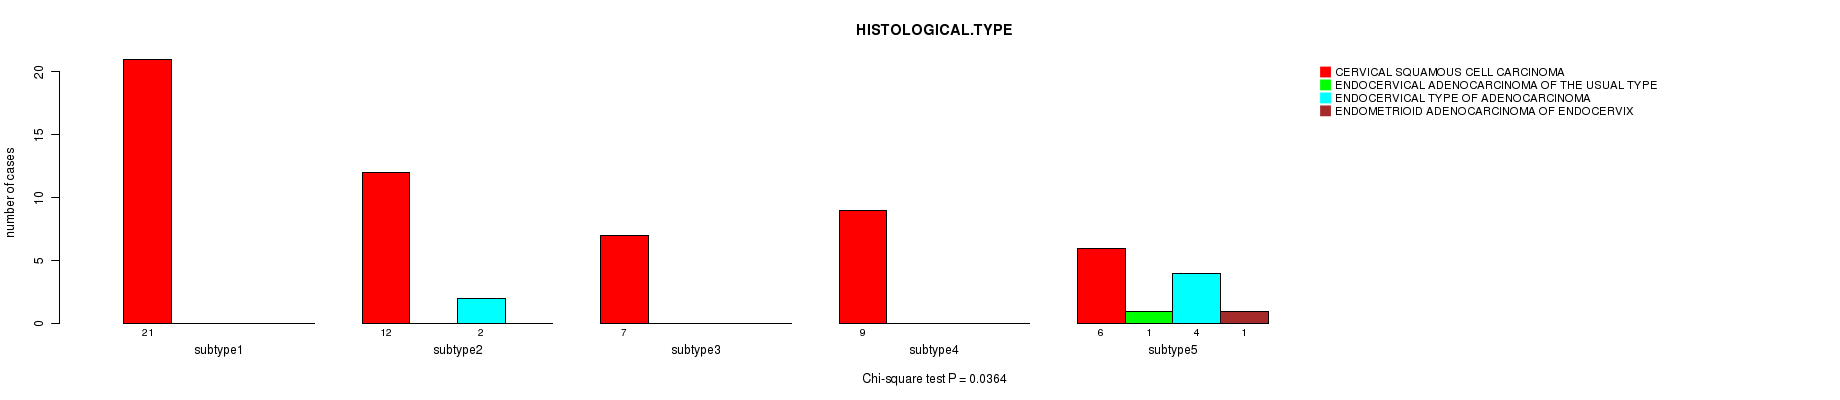
P value = 0.0364 (Chi-square test), Q value = 1
Table S27. Clustering Approach #3: 'RNAseq CNMF subtypes' versus Clinical Feature #6: 'HISTOLOGICAL.TYPE'
| nPatients | CERVICAL SQUAMOUS CELL CARCINOMA | ENDOCERVICAL ADENOCARCINOMA OF THE USUAL TYPE | ENDOCERVICAL TYPE OF ADENOCARCINOMA | ENDOMETRIOID ADENOCARCINOMA OF ENDOCERVIX |
|---|---|---|---|---|
| ALL | 55 | 1 | 6 | 1 |
| subtype1 | 21 | 0 | 0 | 0 |
| subtype2 | 12 | 0 | 2 | 0 |
| subtype3 | 7 | 0 | 0 | 0 |
| subtype4 | 9 | 0 | 0 | 0 |
| subtype5 | 6 | 1 | 4 | 1 |
Figure S24. Get High-res Image Clustering Approach #3: 'RNAseq CNMF subtypes' versus Clinical Feature #6: 'HISTOLOGICAL.TYPE'
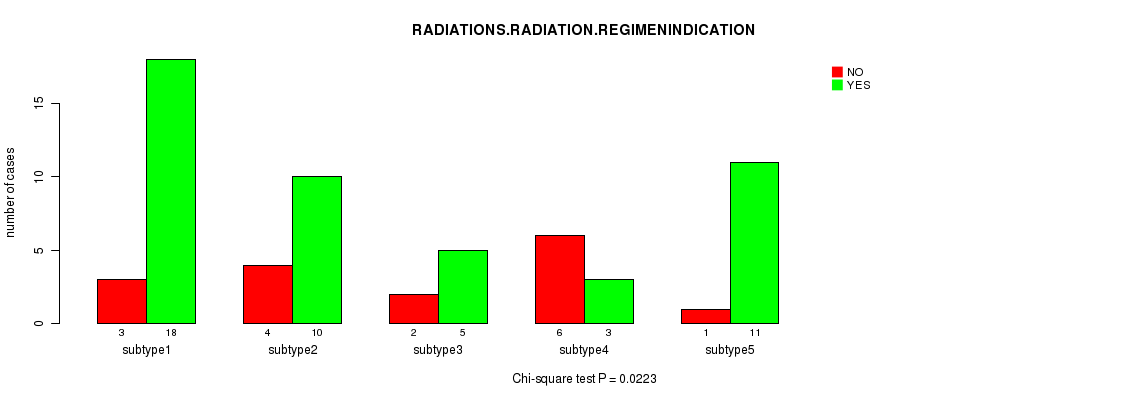
P value = 0.0223 (Chi-square test), Q value = 1
Table S28. Clustering Approach #3: 'RNAseq CNMF subtypes' versus Clinical Feature #7: 'RADIATIONS.RADIATION.REGIMENINDICATION'
| nPatients | NO | YES |
|---|---|---|
| ALL | 16 | 47 |
| subtype1 | 3 | 18 |
| subtype2 | 4 | 10 |
| subtype3 | 2 | 5 |
| subtype4 | 6 | 3 |
| subtype5 | 1 | 11 |
Figure S25. Get High-res Image Clustering Approach #3: 'RNAseq CNMF subtypes' versus Clinical Feature #7: 'RADIATIONS.RADIATION.REGIMENINDICATION'
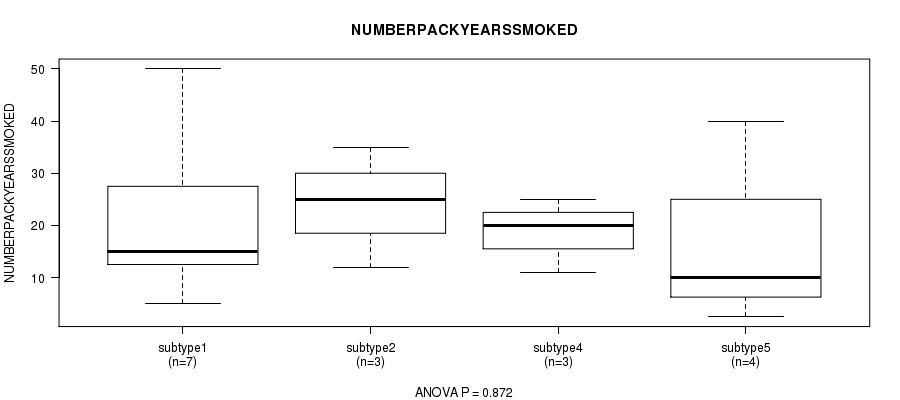
P value = 0.872 (ANOVA), Q value = 1
Table S29. Clustering Approach #3: 'RNAseq CNMF subtypes' versus Clinical Feature #8: 'NUMBERPACKYEARSSMOKED'
| nPatients | Mean (Std.Dev) | |
|---|---|---|
| ALL | 19 | 19.2 (12.8) |
| subtype1 | 7 | 21.4 (15.7) |
| subtype2 | 3 | 24.0 (11.5) |
| subtype3 | 2 | 12.5 (3.5) |
| subtype4 | 3 | 18.7 (7.1) |
| subtype5 | 4 | 15.6 (16.6) |
Figure S26. Get High-res Image Clustering Approach #3: 'RNAseq CNMF subtypes' versus Clinical Feature #8: 'NUMBERPACKYEARSSMOKED'
P value = 0.645 (ANOVA), Q value = 1
Table S30. Clustering Approach #3: 'RNAseq CNMF subtypes' versus Clinical Feature #9: 'NUMBER.OF.LYMPH.NODES'
| nPatients | Mean (Std.Dev) | |
|---|---|---|
| ALL | 56 | 1.0 (2.4) |
| subtype1 | 19 | 0.9 (1.8) |
| subtype2 | 12 | 1.9 (4.6) |
| subtype3 | 6 | 0.7 (1.0) |
| subtype4 | 7 | 0.7 (1.0) |
| subtype5 | 12 | 0.4 (1.2) |
Figure S27. Get High-res Image Clustering Approach #3: 'RNAseq CNMF subtypes' versus Clinical Feature #9: 'NUMBER.OF.LYMPH.NODES'
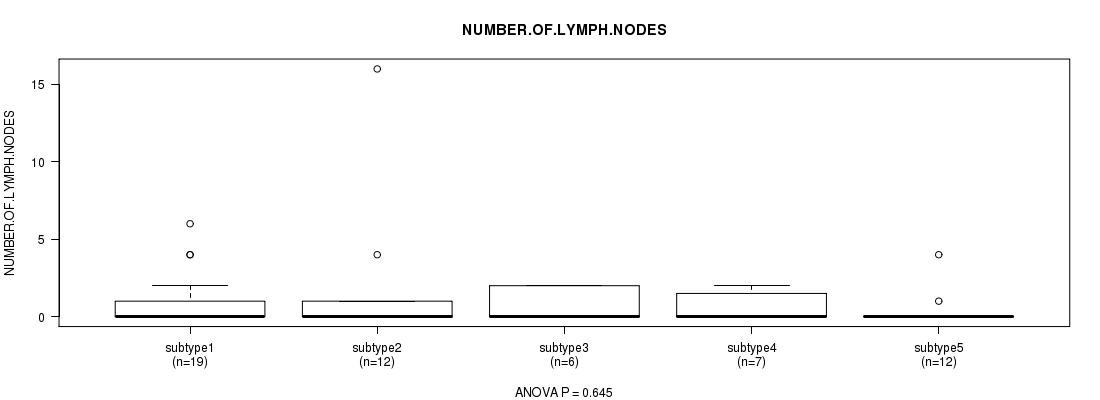
Table S31. Description of clustering approach #4: 'RNAseq cHierClus subtypes'
| Cluster Labels | 1 | 2 | 3 |
|---|---|---|---|
| Number of samples | 16 | 38 | 9 |
P value = 0.694 (logrank test), Q value = 1
Table S32. Clustering Approach #4: 'RNAseq cHierClus subtypes' versus Clinical Feature #1: 'Time to Death'
| nPatients | nDeath | Duration Range (Median), Month | |
|---|---|---|---|
| ALL | 62 | 11 | 0.1 - 177.0 (8.0) |
| subtype1 | 16 | 3 | 0.3 - 124.3 (9.7) |
| subtype2 | 38 | 8 | 0.1 - 177.0 (17.0) |
| subtype3 | 8 | 0 | 0.1 - 101.8 (1.5) |
Figure S28. Get High-res Image Clustering Approach #4: 'RNAseq cHierClus subtypes' versus Clinical Feature #1: 'Time to Death'
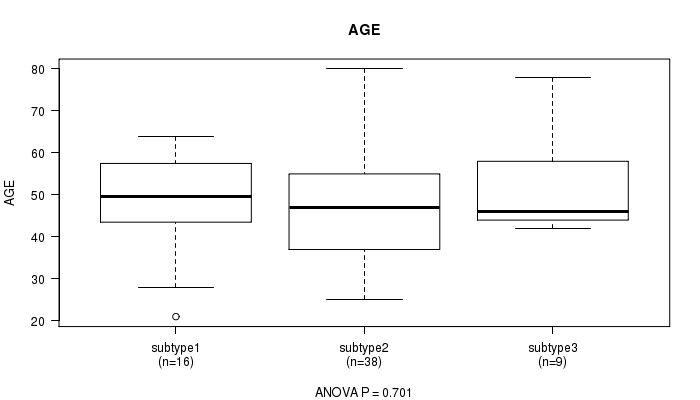
P value = 0.701 (ANOVA), Q value = 1
Table S33. Clustering Approach #4: 'RNAseq cHierClus subtypes' versus Clinical Feature #2: 'AGE'
| nPatients | Mean (Std.Dev) | |
|---|---|---|
| ALL | 63 | 48.4 (13.1) |
| subtype1 | 16 | 48.7 (12.3) |
| subtype2 | 38 | 47.6 (13.8) |
| subtype3 | 9 | 51.7 (11.8) |
Figure S29. Get High-res Image Clustering Approach #4: 'RNAseq cHierClus subtypes' versus Clinical Feature #2: 'AGE'
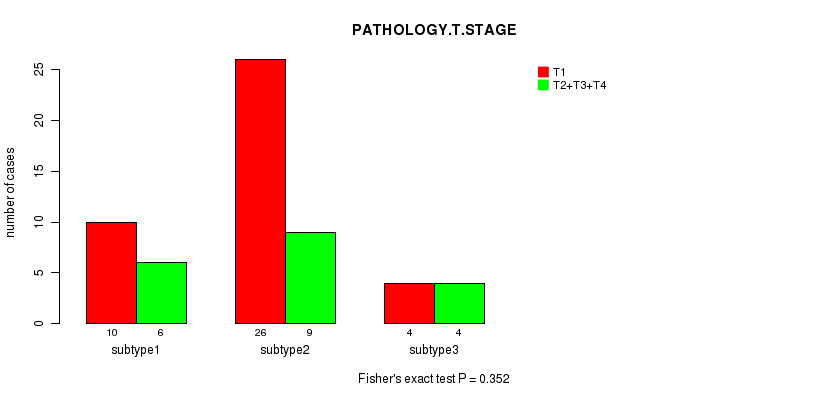
P value = 0.352 (Fisher's exact test), Q value = 1
Table S34. Clustering Approach #4: 'RNAseq cHierClus subtypes' versus Clinical Feature #3: 'PATHOLOGY.T.STAGE'
| nPatients | T1 | T2+T3+T4 |
|---|---|---|
| ALL | 40 | 19 |
| subtype1 | 10 | 6 |
| subtype2 | 26 | 9 |
| subtype3 | 4 | 4 |
Figure S30. Get High-res Image Clustering Approach #4: 'RNAseq cHierClus subtypes' versus Clinical Feature #3: 'PATHOLOGY.T.STAGE'
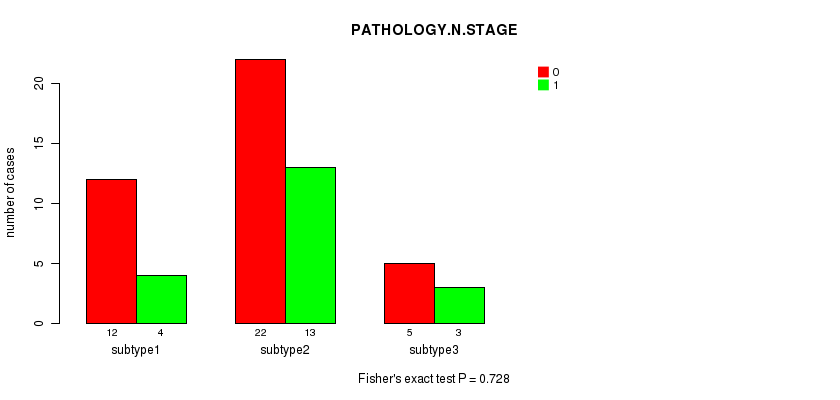
P value = 0.728 (Fisher's exact test), Q value = 1
Table S35. Clustering Approach #4: 'RNAseq cHierClus subtypes' versus Clinical Feature #4: 'PATHOLOGY.N.STAGE'
| nPatients | 0 | 1 |
|---|---|---|
| ALL | 39 | 20 |
| subtype1 | 12 | 4 |
| subtype2 | 22 | 13 |
| subtype3 | 5 | 3 |
Figure S31. Get High-res Image Clustering Approach #4: 'RNAseq cHierClus subtypes' versus Clinical Feature #4: 'PATHOLOGY.N.STAGE'
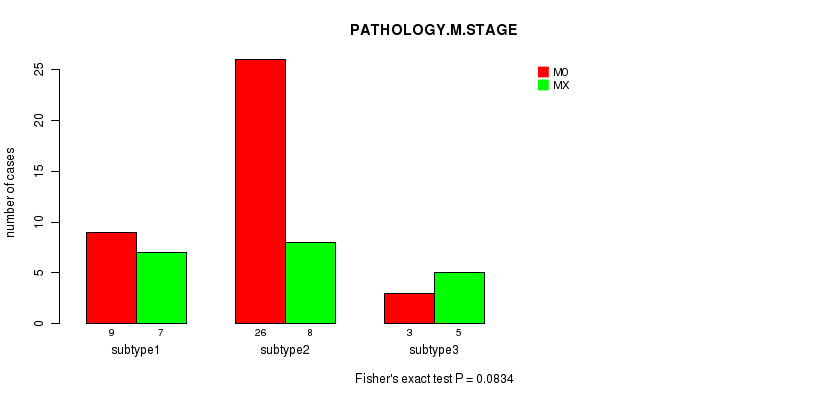
P value = 0.0834 (Fisher's exact test), Q value = 1
Table S36. Clustering Approach #4: 'RNAseq cHierClus subtypes' versus Clinical Feature #5: 'PATHOLOGY.M.STAGE'
| nPatients | M0 | MX |
|---|---|---|
| ALL | 38 | 20 |
| subtype1 | 9 | 7 |
| subtype2 | 26 | 8 |
| subtype3 | 3 | 5 |
Figure S32. Get High-res Image Clustering Approach #4: 'RNAseq cHierClus subtypes' versus Clinical Feature #5: 'PATHOLOGY.M.STAGE'
P value = 0.00015 (Chi-square test), Q value = 0.01
Table S37. Clustering Approach #4: 'RNAseq cHierClus subtypes' versus Clinical Feature #6: 'HISTOLOGICAL.TYPE'
| nPatients | CERVICAL SQUAMOUS CELL CARCINOMA | ENDOCERVICAL ADENOCARCINOMA OF THE USUAL TYPE | ENDOCERVICAL TYPE OF ADENOCARCINOMA | ENDOMETRIOID ADENOCARCINOMA OF ENDOCERVIX |
|---|---|---|---|---|
| ALL | 55 | 1 | 6 | 1 |
| subtype1 | 8 | 1 | 6 | 1 |
| subtype2 | 38 | 0 | 0 | 0 |
| subtype3 | 9 | 0 | 0 | 0 |
Figure S33. Get High-res Image Clustering Approach #4: 'RNAseq cHierClus subtypes' versus Clinical Feature #6: 'HISTOLOGICAL.TYPE'
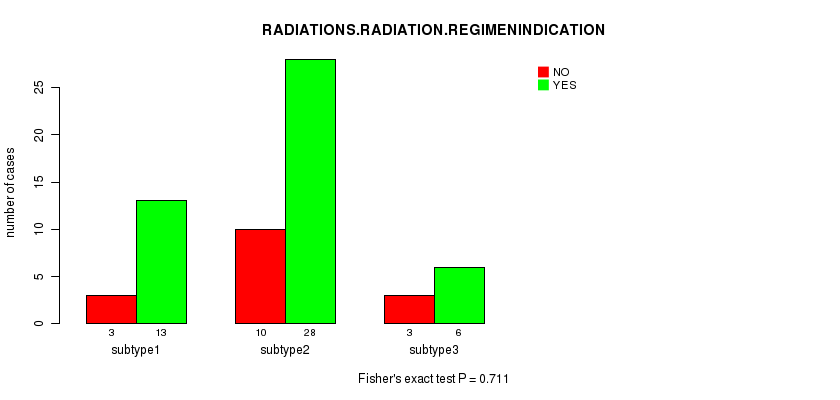
P value = 0.711 (Fisher's exact test), Q value = 1
Table S38. Clustering Approach #4: 'RNAseq cHierClus subtypes' versus Clinical Feature #7: 'RADIATIONS.RADIATION.REGIMENINDICATION'
| nPatients | NO | YES |
|---|---|---|
| ALL | 16 | 47 |
| subtype1 | 3 | 13 |
| subtype2 | 10 | 28 |
| subtype3 | 3 | 6 |
Figure S34. Get High-res Image Clustering Approach #4: 'RNAseq cHierClus subtypes' versus Clinical Feature #7: 'RADIATIONS.RADIATION.REGIMENINDICATION'
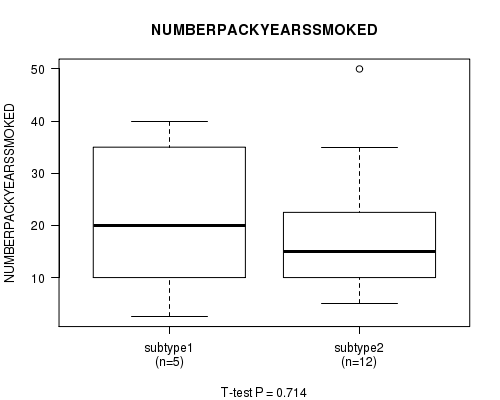
P value = 0.714 (ANOVA), Q value = 1
Table S39. Clustering Approach #4: 'RNAseq cHierClus subtypes' versus Clinical Feature #8: 'NUMBERPACKYEARSSMOKED'
| nPatients | Mean (Std.Dev) | |
|---|---|---|
| ALL | 19 | 19.2 (12.8) |
| subtype1 | 5 | 21.5 (16.0) |
| subtype2 | 12 | 18.4 (12.8) |
| subtype3 | 2 | 18.5 (9.2) |
Figure S35. Get High-res Image Clustering Approach #4: 'RNAseq cHierClus subtypes' versus Clinical Feature #8: 'NUMBERPACKYEARSSMOKED'
P value = 0.705 (ANOVA), Q value = 1
Table S40. Clustering Approach #4: 'RNAseq cHierClus subtypes' versus Clinical Feature #9: 'NUMBER.OF.LYMPH.NODES'
| nPatients | Mean (Std.Dev) | |
|---|---|---|
| ALL | 56 | 1.0 (2.4) |
| subtype1 | 15 | 0.5 (1.1) |
| subtype2 | 34 | 1.2 (3.0) |
| subtype3 | 7 | 1.0 (1.5) |
Figure S36. Get High-res Image Clustering Approach #4: 'RNAseq cHierClus subtypes' versus Clinical Feature #9: 'NUMBER.OF.LYMPH.NODES'
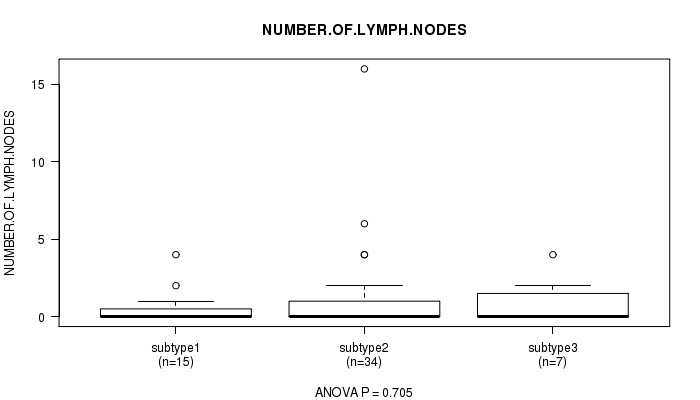
Table S41. Description of clustering approach #5: 'MIRSEQ CNMF'
| Cluster Labels | 1 | 2 | 3 | 4 |
|---|---|---|---|---|
| Number of samples | 26 | 19 | 6 | 14 |
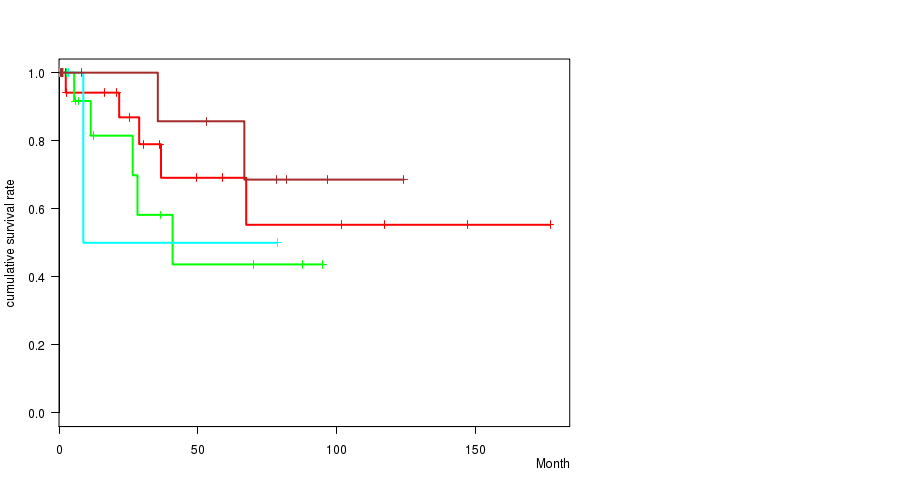
P value = 0.61 (logrank test), Q value = 1
Table S42. Clustering Approach #5: 'MIRSEQ CNMF' versus Clinical Feature #1: 'Time to Death'
| nPatients | nDeath | Duration Range (Median), Month | |
|---|---|---|---|
| ALL | 63 | 13 | 0.1 - 177.0 (11.4) |
| subtype1 | 25 | 5 | 0.3 - 177.0 (21.7) |
| subtype2 | 18 | 5 | 0.1 - 95.1 (9.2) |
| subtype3 | 6 | 1 | 0.1 - 78.7 (2.5) |
| subtype4 | 14 | 2 | 0.7 - 124.3 (21.8) |
Figure S37. Get High-res Image Clustering Approach #5: 'MIRSEQ CNMF' versus Clinical Feature #1: 'Time to Death'
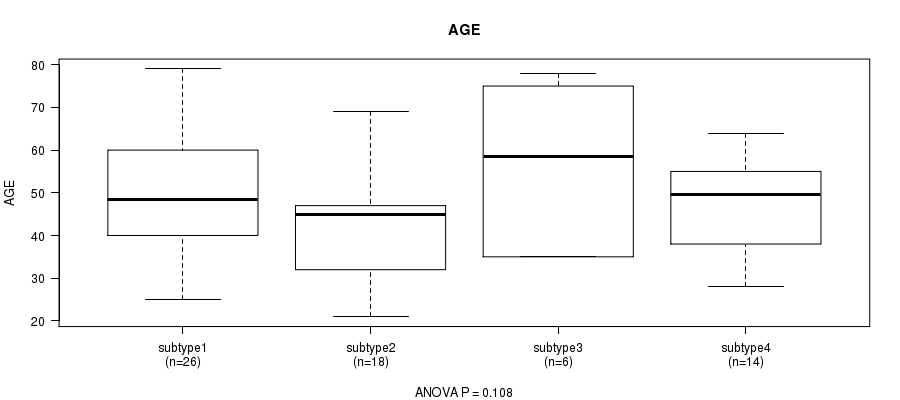
P value = 0.108 (ANOVA), Q value = 1
Table S43. Clustering Approach #5: 'MIRSEQ CNMF' versus Clinical Feature #2: 'AGE'
| nPatients | Mean (Std.Dev) | |
|---|---|---|
| ALL | 64 | 48.2 (13.2) |
| subtype1 | 26 | 50.2 (12.7) |
| subtype2 | 18 | 42.9 (11.6) |
| subtype3 | 6 | 56.7 (19.6) |
| subtype4 | 14 | 47.8 (11.4) |
Figure S38. Get High-res Image Clustering Approach #5: 'MIRSEQ CNMF' versus Clinical Feature #2: 'AGE'
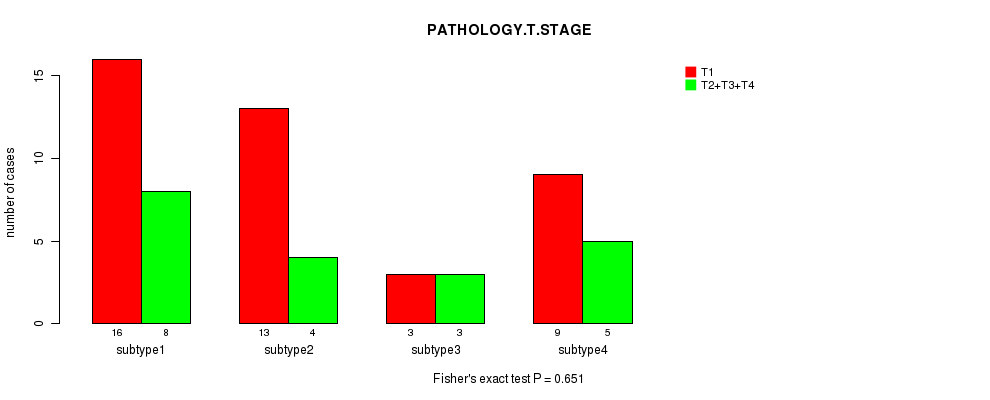
P value = 0.651 (Fisher's exact test), Q value = 1
Table S44. Clustering Approach #5: 'MIRSEQ CNMF' versus Clinical Feature #3: 'PATHOLOGY.T.STAGE'
| nPatients | T1 | T2+T3+T4 |
|---|---|---|
| ALL | 41 | 20 |
| subtype1 | 16 | 8 |
| subtype2 | 13 | 4 |
| subtype3 | 3 | 3 |
| subtype4 | 9 | 5 |
Figure S39. Get High-res Image Clustering Approach #5: 'MIRSEQ CNMF' versus Clinical Feature #3: 'PATHOLOGY.T.STAGE'
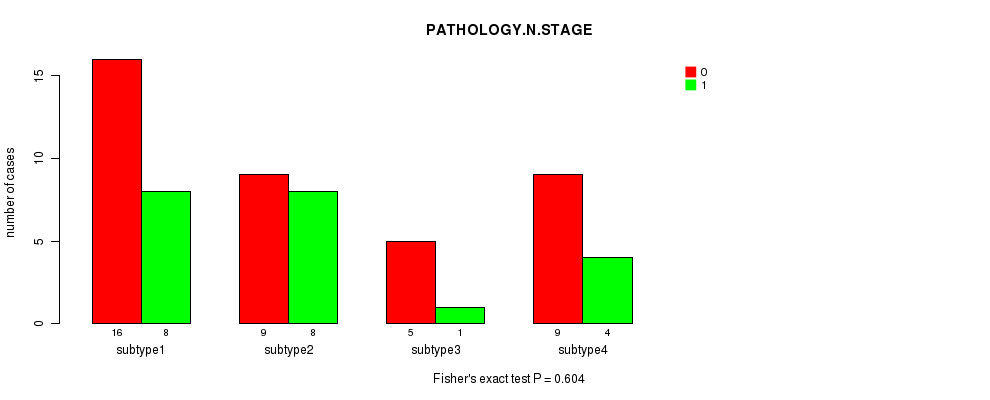
P value = 0.604 (Fisher's exact test), Q value = 1
Table S45. Clustering Approach #5: 'MIRSEQ CNMF' versus Clinical Feature #4: 'PATHOLOGY.N.STAGE'
| nPatients | 0 | 1 |
|---|---|---|
| ALL | 39 | 21 |
| subtype1 | 16 | 8 |
| subtype2 | 9 | 8 |
| subtype3 | 5 | 1 |
| subtype4 | 9 | 4 |
Figure S40. Get High-res Image Clustering Approach #5: 'MIRSEQ CNMF' versus Clinical Feature #4: 'PATHOLOGY.N.STAGE'
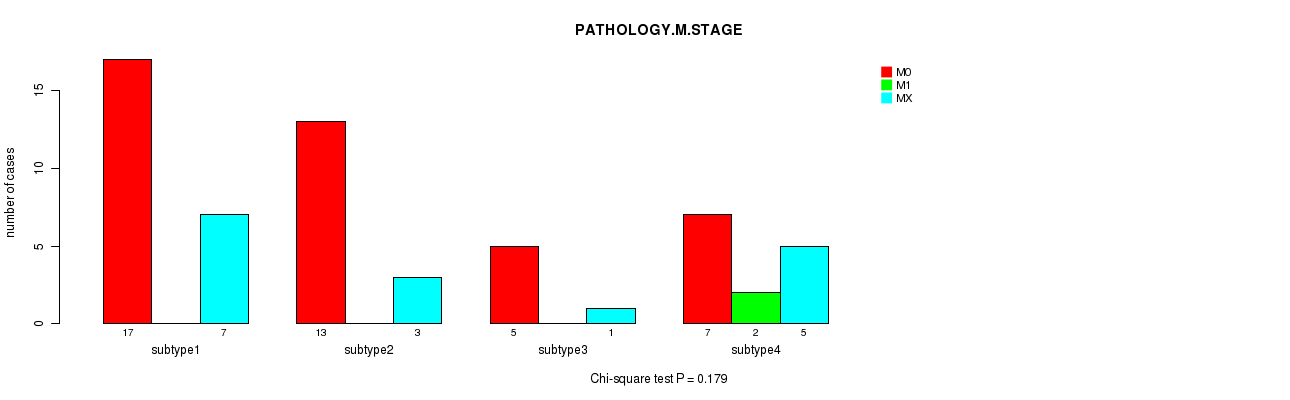
P value = 0.179 (Chi-square test), Q value = 1
Table S46. Clustering Approach #5: 'MIRSEQ CNMF' versus Clinical Feature #5: 'PATHOLOGY.M.STAGE'
| nPatients | M0 | M1 | MX |
|---|---|---|---|
| ALL | 42 | 2 | 16 |
| subtype1 | 17 | 0 | 7 |
| subtype2 | 13 | 0 | 3 |
| subtype3 | 5 | 0 | 1 |
| subtype4 | 7 | 2 | 5 |
Figure S41. Get High-res Image Clustering Approach #5: 'MIRSEQ CNMF' versus Clinical Feature #5: 'PATHOLOGY.M.STAGE'
P value = 0.000122 (Chi-square test), Q value = 0.0083
Table S47. Clustering Approach #5: 'MIRSEQ CNMF' versus Clinical Feature #6: 'HISTOLOGICAL.TYPE'
| nPatients | CERVICAL SQUAMOUS CELL CARCINOMA | ENDOCERVICAL ADENOCARCINOMA OF THE USUAL TYPE | ENDOCERVICAL TYPE OF ADENOCARCINOMA | ENDOMETRIOID ADENOCARCINOMA OF ENDOCERVIX |
|---|---|---|---|---|
| ALL | 57 | 1 | 6 | 1 |
| subtype1 | 26 | 0 | 0 | 0 |
| subtype2 | 19 | 0 | 0 | 0 |
| subtype3 | 6 | 0 | 0 | 0 |
| subtype4 | 6 | 1 | 6 | 1 |
Figure S42. Get High-res Image Clustering Approach #5: 'MIRSEQ CNMF' versus Clinical Feature #6: 'HISTOLOGICAL.TYPE'
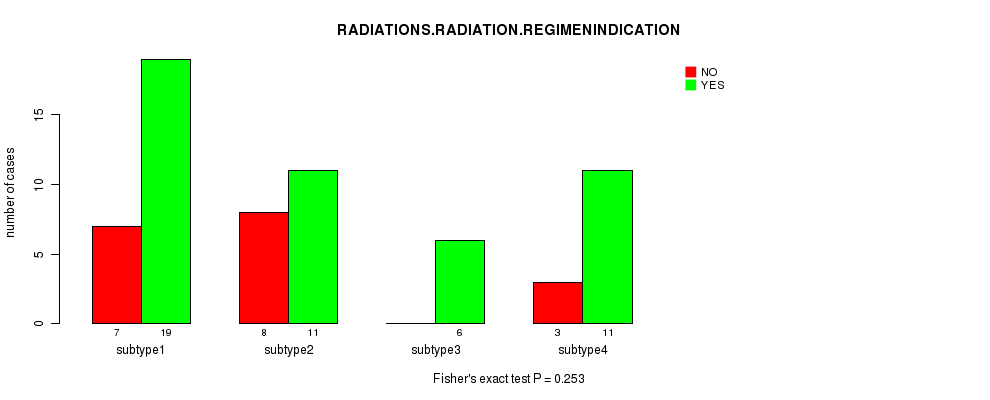
P value = 0.253 (Fisher's exact test), Q value = 1
Table S48. Clustering Approach #5: 'MIRSEQ CNMF' versus Clinical Feature #7: 'RADIATIONS.RADIATION.REGIMENINDICATION'
| nPatients | NO | YES |
|---|---|---|
| ALL | 18 | 47 |
| subtype1 | 7 | 19 |
| subtype2 | 8 | 11 |
| subtype3 | 0 | 6 |
| subtype4 | 3 | 11 |
Figure S43. Get High-res Image Clustering Approach #5: 'MIRSEQ CNMF' versus Clinical Feature #7: 'RADIATIONS.RADIATION.REGIMENINDICATION'
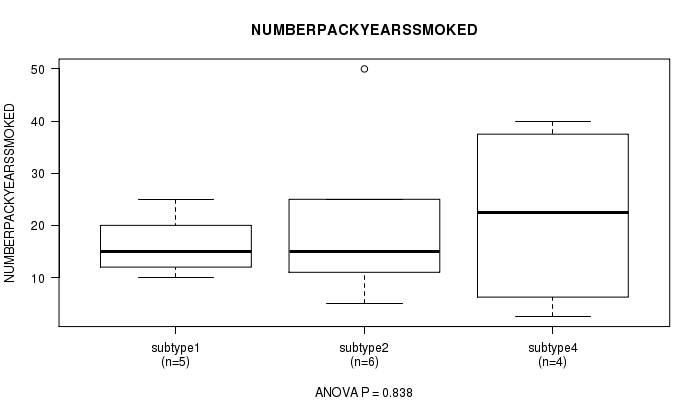
P value = 0.838 (ANOVA), Q value = 1
Table S49. Clustering Approach #5: 'MIRSEQ CNMF' versus Clinical Feature #8: 'NUMBERPACKYEARSSMOKED'
| nPatients | Mean (Std.Dev) | |
|---|---|---|
| ALL | 17 | 18.9 (12.8) |
| subtype1 | 5 | 16.4 (6.1) |
| subtype2 | 6 | 20.2 (16.0) |
| subtype3 | 2 | 15.0 (7.1) |
| subtype4 | 4 | 21.9 (18.4) |
Figure S44. Get High-res Image Clustering Approach #5: 'MIRSEQ CNMF' versus Clinical Feature #8: 'NUMBERPACKYEARSSMOKED'
P value = 0.546 (ANOVA), Q value = 1
Table S50. Clustering Approach #5: 'MIRSEQ CNMF' versus Clinical Feature #9: 'NUMBER.OF.LYMPH.NODES'
| nPatients | Mean (Std.Dev) | |
|---|---|---|
| ALL | 55 | 1.0 (2.5) |
| subtype1 | 23 | 0.9 (2.0) |
| subtype2 | 15 | 1.7 (4.0) |
| subtype3 | 5 | 0.0 (0.0) |
| subtype4 | 12 | 0.6 (1.2) |
Figure S45. Get High-res Image Clustering Approach #5: 'MIRSEQ CNMF' versus Clinical Feature #9: 'NUMBER.OF.LYMPH.NODES'
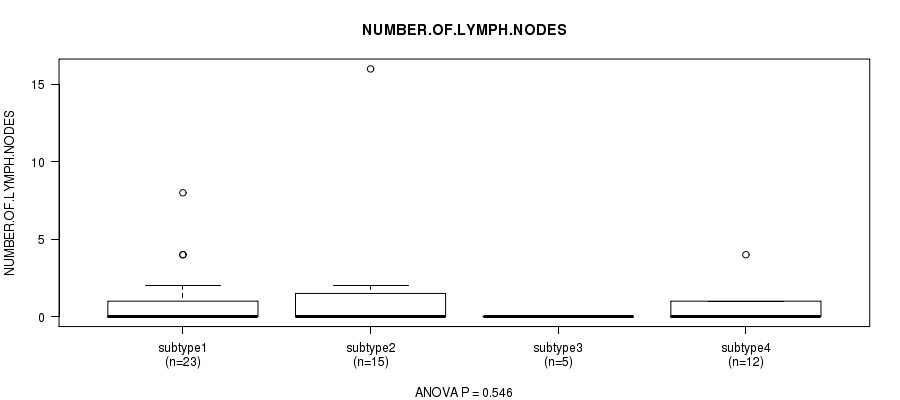
Table S51. Description of clustering approach #6: 'MIRSEQ CHIERARCHICAL'
| Cluster Labels | 1 | 2 |
|---|---|---|
| Number of samples | 50 | 15 |
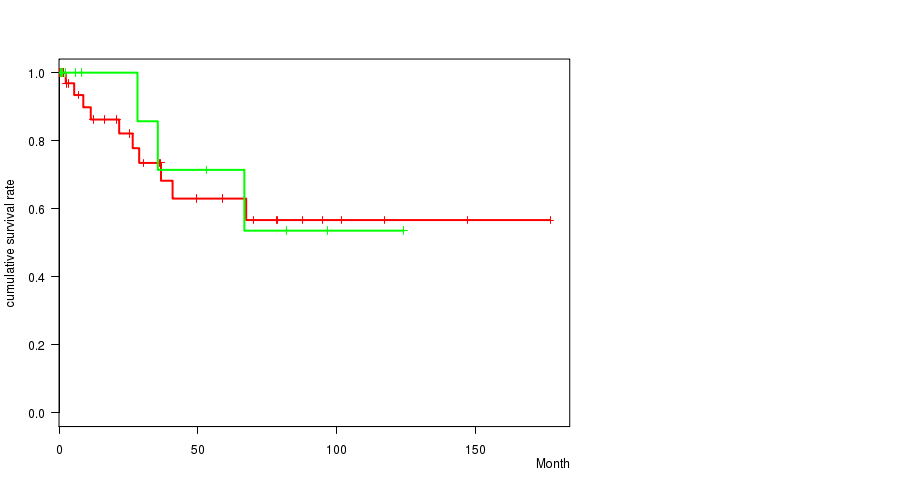
P value = 0.861 (logrank test), Q value = 1
Table S52. Clustering Approach #6: 'MIRSEQ CHIERARCHICAL' versus Clinical Feature #1: 'Time to Death'
| nPatients | nDeath | Duration Range (Median), Month | |
|---|---|---|---|
| ALL | 63 | 13 | 0.1 - 177.0 (11.4) |
| subtype1 | 48 | 10 | 0.1 - 177.0 (11.9) |
| subtype2 | 15 | 3 | 0.7 - 124.3 (7.9) |
Figure S46. Get High-res Image Clustering Approach #6: 'MIRSEQ CHIERARCHICAL' versus Clinical Feature #1: 'Time to Death'
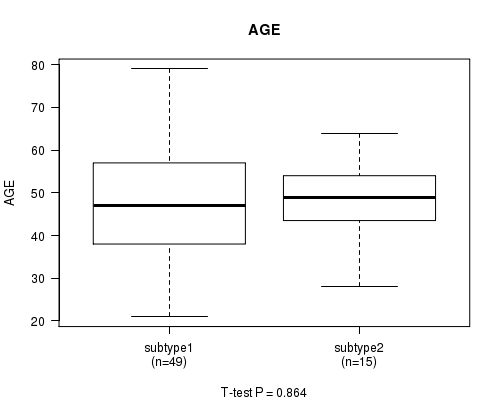
P value = 0.864 (t-test), Q value = 1
Table S53. Clustering Approach #6: 'MIRSEQ CHIERARCHICAL' versus Clinical Feature #2: 'AGE'
| nPatients | Mean (Std.Dev) | |
|---|---|---|
| ALL | 64 | 48.2 (13.2) |
| subtype1 | 49 | 48.1 (14.1) |
| subtype2 | 15 | 48.7 (9.9) |
Figure S47. Get High-res Image Clustering Approach #6: 'MIRSEQ CHIERARCHICAL' versus Clinical Feature #2: 'AGE'
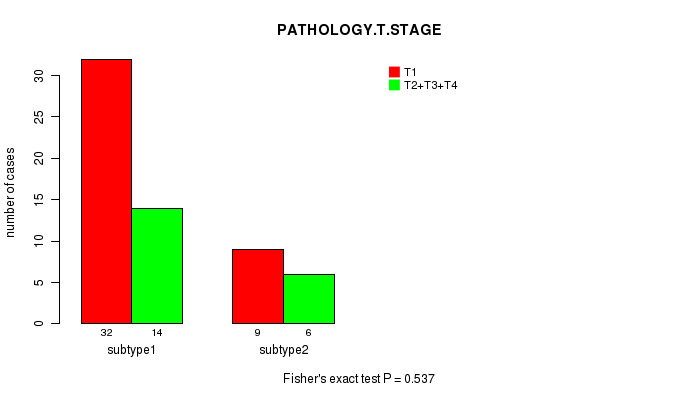
P value = 0.537 (Fisher's exact test), Q value = 1
Table S54. Clustering Approach #6: 'MIRSEQ CHIERARCHICAL' versus Clinical Feature #3: 'PATHOLOGY.T.STAGE'
| nPatients | T1 | T2+T3+T4 |
|---|---|---|
| ALL | 41 | 20 |
| subtype1 | 32 | 14 |
| subtype2 | 9 | 6 |
Figure S48. Get High-res Image Clustering Approach #6: 'MIRSEQ CHIERARCHICAL' versus Clinical Feature #3: 'PATHOLOGY.T.STAGE'
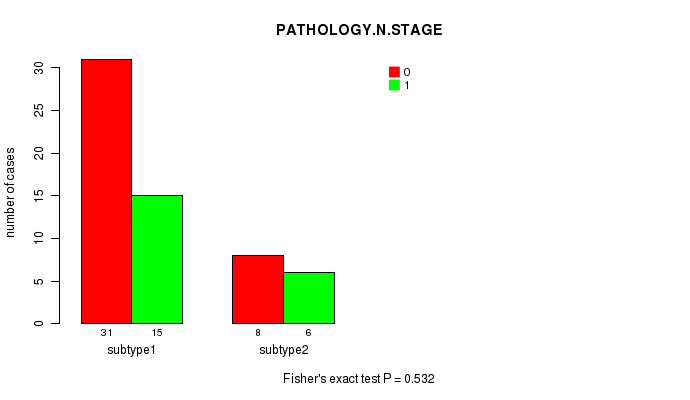
P value = 0.532 (Fisher's exact test), Q value = 1
Table S55. Clustering Approach #6: 'MIRSEQ CHIERARCHICAL' versus Clinical Feature #4: 'PATHOLOGY.N.STAGE'
| nPatients | 0 | 1 |
|---|---|---|
| ALL | 39 | 21 |
| subtype1 | 31 | 15 |
| subtype2 | 8 | 6 |
Figure S49. Get High-res Image Clustering Approach #6: 'MIRSEQ CHIERARCHICAL' versus Clinical Feature #4: 'PATHOLOGY.N.STAGE'
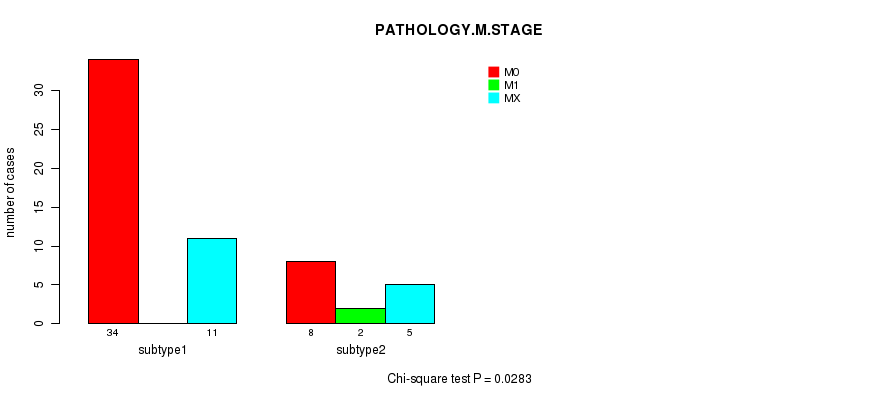
P value = 0.0283 (Chi-square test), Q value = 1
Table S56. Clustering Approach #6: 'MIRSEQ CHIERARCHICAL' versus Clinical Feature #5: 'PATHOLOGY.M.STAGE'
| nPatients | M0 | M1 | MX |
|---|---|---|---|
| ALL | 42 | 2 | 16 |
| subtype1 | 34 | 0 | 11 |
| subtype2 | 8 | 2 | 5 |
Figure S50. Get High-res Image Clustering Approach #6: 'MIRSEQ CHIERARCHICAL' versus Clinical Feature #5: 'PATHOLOGY.M.STAGE'
P value = 1.13e-06 (Chi-square test), Q value = 8.1e-05
Table S57. Clustering Approach #6: 'MIRSEQ CHIERARCHICAL' versus Clinical Feature #6: 'HISTOLOGICAL.TYPE'
| nPatients | CERVICAL SQUAMOUS CELL CARCINOMA | ENDOCERVICAL ADENOCARCINOMA OF THE USUAL TYPE | ENDOCERVICAL TYPE OF ADENOCARCINOMA | ENDOMETRIOID ADENOCARCINOMA OF ENDOCERVIX |
|---|---|---|---|---|
| ALL | 57 | 1 | 6 | 1 |
| subtype1 | 50 | 0 | 0 | 0 |
| subtype2 | 7 | 1 | 6 | 1 |
Figure S51. Get High-res Image Clustering Approach #6: 'MIRSEQ CHIERARCHICAL' versus Clinical Feature #6: 'HISTOLOGICAL.TYPE'
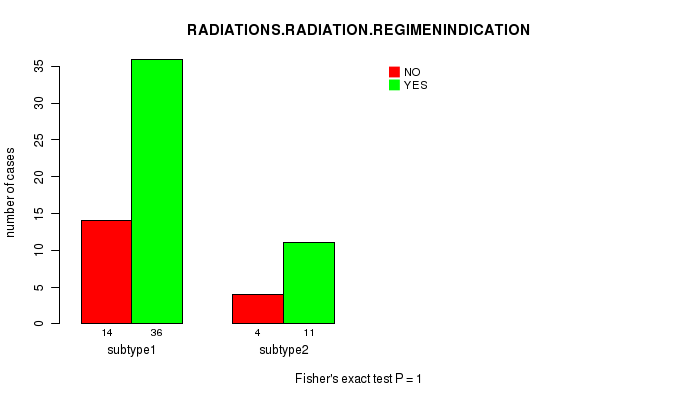
P value = 1 (Fisher's exact test), Q value = 1
Table S58. Clustering Approach #6: 'MIRSEQ CHIERARCHICAL' versus Clinical Feature #7: 'RADIATIONS.RADIATION.REGIMENINDICATION'
| nPatients | NO | YES |
|---|---|---|
| ALL | 18 | 47 |
| subtype1 | 14 | 36 |
| subtype2 | 4 | 11 |
Figure S52. Get High-res Image Clustering Approach #6: 'MIRSEQ CHIERARCHICAL' versus Clinical Feature #7: 'RADIATIONS.RADIATION.REGIMENINDICATION'
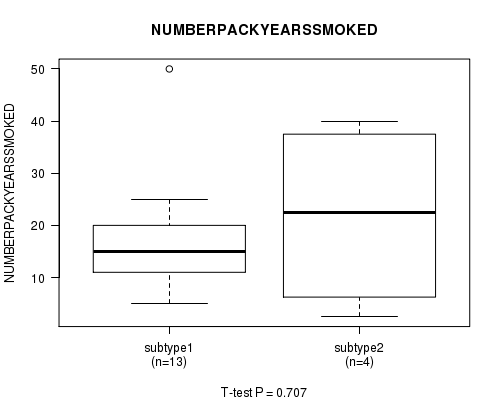
P value = 0.707 (t-test), Q value = 1
Table S59. Clustering Approach #6: 'MIRSEQ CHIERARCHICAL' versus Clinical Feature #8: 'NUMBERPACKYEARSSMOKED'
| nPatients | Mean (Std.Dev) | |
|---|---|---|
| ALL | 17 | 18.9 (12.8) |
| subtype1 | 13 | 17.9 (11.3) |
| subtype2 | 4 | 21.9 (18.4) |
Figure S53. Get High-res Image Clustering Approach #6: 'MIRSEQ CHIERARCHICAL' versus Clinical Feature #8: 'NUMBERPACKYEARSSMOKED'
P value = 0.369 (t-test), Q value = 1
Table S60. Clustering Approach #6: 'MIRSEQ CHIERARCHICAL' versus Clinical Feature #9: 'NUMBER.OF.LYMPH.NODES'
| nPatients | Mean (Std.Dev) | |
|---|---|---|
| ALL | 55 | 1.0 (2.5) |
| subtype1 | 42 | 0.7 (1.5) |
| subtype2 | 13 | 1.8 (4.4) |
Figure S54. Get High-res Image Clustering Approach #6: 'MIRSEQ CHIERARCHICAL' versus Clinical Feature #9: 'NUMBER.OF.LYMPH.NODES'
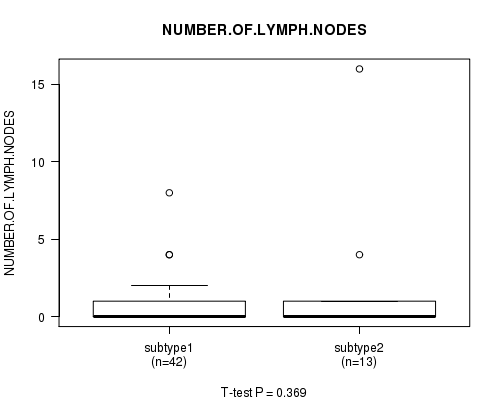
Table S61. Description of clustering approach #7: 'MIRseq Mature CNMF subtypes'
| Cluster Labels | 1 | 2 | 3 |
|---|---|---|---|
| Number of samples | 27 | 22 | 16 |
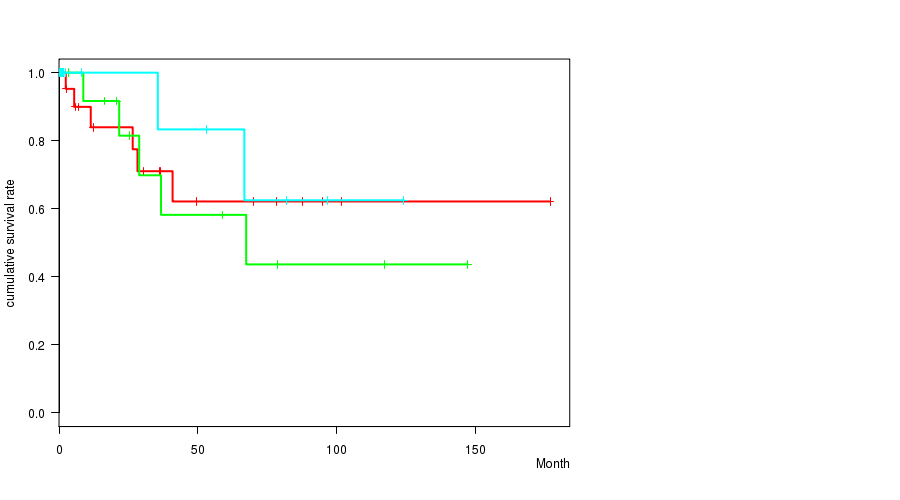
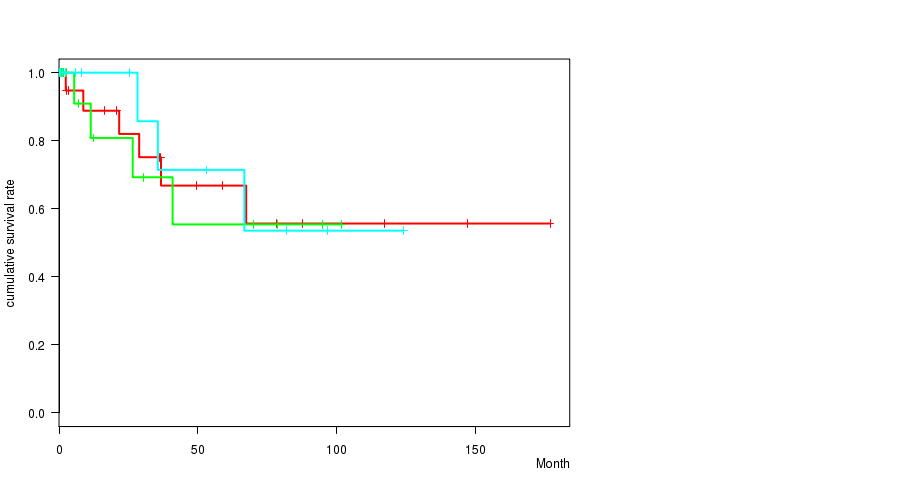
P value = 0.74 (logrank test), Q value = 1
Table S62. Clustering Approach #7: 'MIRseq Mature CNMF subtypes' versus Clinical Feature #1: 'Time to Death'
| nPatients | nDeath | Duration Range (Median), Month | |
|---|---|---|---|
| ALL | 63 | 13 | 0.1 - 177.0 (11.4) |
| subtype1 | 26 | 6 | 0.1 - 177.0 (19.5) |
| subtype2 | 21 | 5 | 0.6 - 147.3 (16.4) |
| subtype3 | 16 | 2 | 0.1 - 124.3 (2.0) |
Figure S55. Get High-res Image Clustering Approach #7: 'MIRseq Mature CNMF subtypes' versus Clinical Feature #1: 'Time to Death'
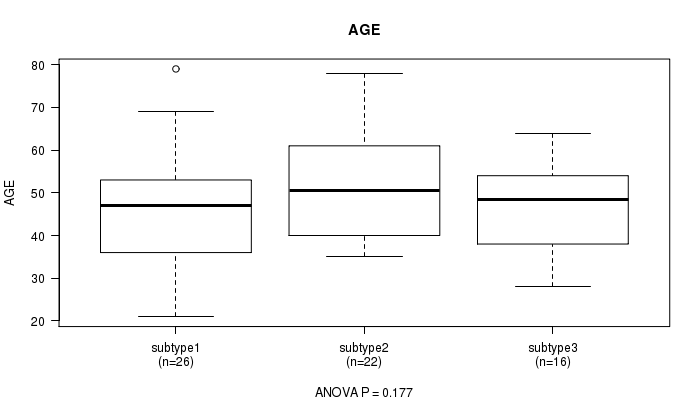
P value = 0.177 (ANOVA), Q value = 1
Table S63. Clustering Approach #7: 'MIRseq Mature CNMF subtypes' versus Clinical Feature #2: 'AGE'
| nPatients | Mean (Std.Dev) | |
|---|---|---|
| ALL | 64 | 48.2 (13.2) |
| subtype1 | 26 | 45.7 (13.4) |
| subtype2 | 22 | 52.5 (13.8) |
| subtype3 | 16 | 46.6 (11.3) |
Figure S56. Get High-res Image Clustering Approach #7: 'MIRseq Mature CNMF subtypes' versus Clinical Feature #2: 'AGE'
P value = 0.65 (Fisher's exact test), Q value = 1
Table S64. Clustering Approach #7: 'MIRseq Mature CNMF subtypes' versus Clinical Feature #3: 'PATHOLOGY.T.STAGE'
| nPatients | T1 | T2+T3+T4 |
|---|---|---|
| ALL | 41 | 20 |
| subtype1 | 18 | 6 |
| subtype2 | 13 | 8 |
| subtype3 | 10 | 6 |
Figure S57. Get High-res Image Clustering Approach #7: 'MIRseq Mature CNMF subtypes' versus Clinical Feature #3: 'PATHOLOGY.T.STAGE'
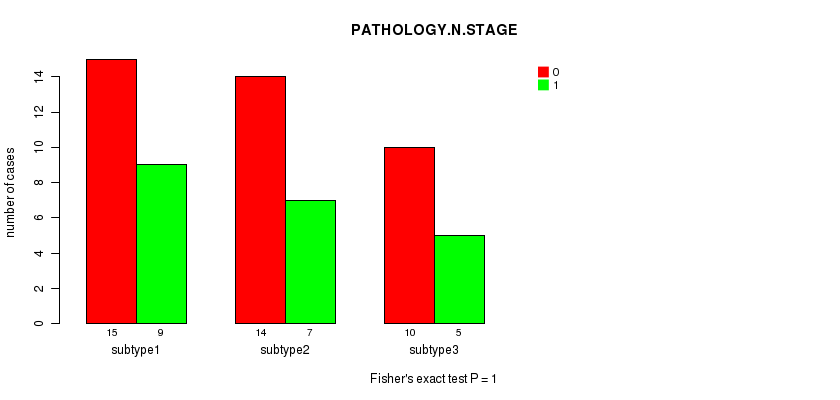
P value = 1 (Fisher's exact test), Q value = 1
Table S65. Clustering Approach #7: 'MIRseq Mature CNMF subtypes' versus Clinical Feature #4: 'PATHOLOGY.N.STAGE'
| nPatients | 0 | 1 |
|---|---|---|
| ALL | 39 | 21 |
| subtype1 | 15 | 9 |
| subtype2 | 14 | 7 |
| subtype3 | 10 | 5 |
Figure S58. Get High-res Image Clustering Approach #7: 'MIRseq Mature CNMF subtypes' versus Clinical Feature #4: 'PATHOLOGY.N.STAGE'
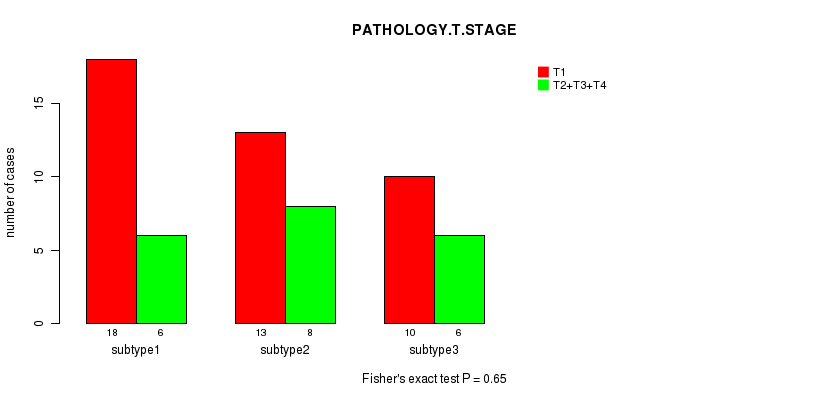
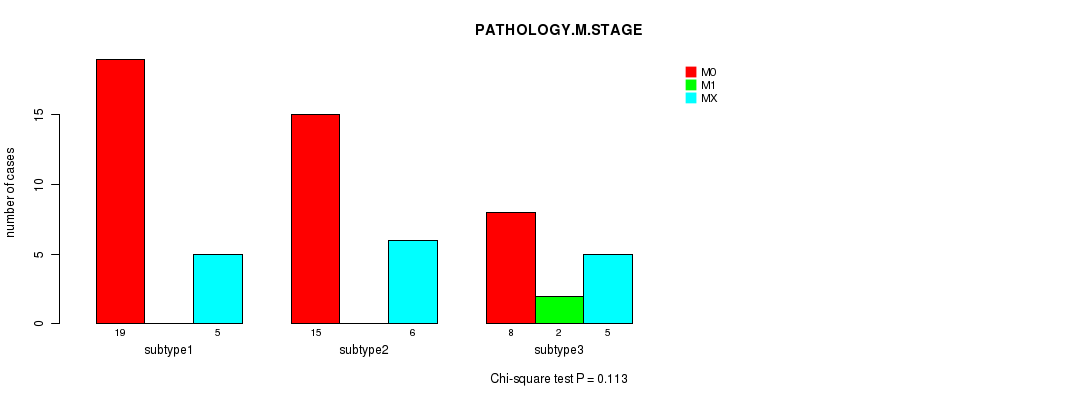
P value = 0.113 (Chi-square test), Q value = 1
Table S66. Clustering Approach #7: 'MIRseq Mature CNMF subtypes' versus Clinical Feature #5: 'PATHOLOGY.M.STAGE'
| nPatients | M0 | M1 | MX |
|---|---|---|---|
| ALL | 42 | 2 | 16 |
| subtype1 | 19 | 0 | 5 |
| subtype2 | 15 | 0 | 6 |
| subtype3 | 8 | 2 | 5 |
Figure S59. Get High-res Image Clustering Approach #7: 'MIRseq Mature CNMF subtypes' versus Clinical Feature #5: 'PATHOLOGY.M.STAGE'
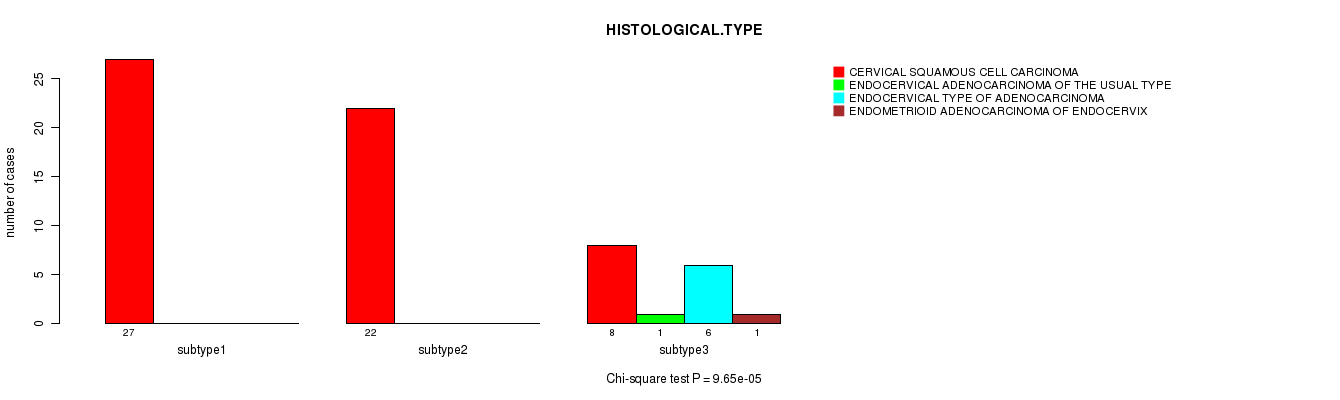
P value = 9.65e-05 (Chi-square test), Q value = 0.0068
Table S67. Clustering Approach #7: 'MIRseq Mature CNMF subtypes' versus Clinical Feature #6: 'HISTOLOGICAL.TYPE'
| nPatients | CERVICAL SQUAMOUS CELL CARCINOMA | ENDOCERVICAL ADENOCARCINOMA OF THE USUAL TYPE | ENDOCERVICAL TYPE OF ADENOCARCINOMA | ENDOMETRIOID ADENOCARCINOMA OF ENDOCERVIX |
|---|---|---|---|---|
| ALL | 57 | 1 | 6 | 1 |
| subtype1 | 27 | 0 | 0 | 0 |
| subtype2 | 22 | 0 | 0 | 0 |
| subtype3 | 8 | 1 | 6 | 1 |
Figure S60. Get High-res Image Clustering Approach #7: 'MIRseq Mature CNMF subtypes' versus Clinical Feature #6: 'HISTOLOGICAL.TYPE'
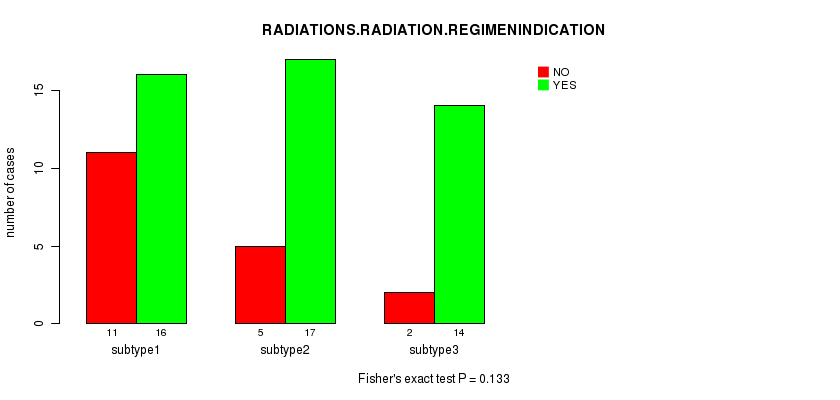
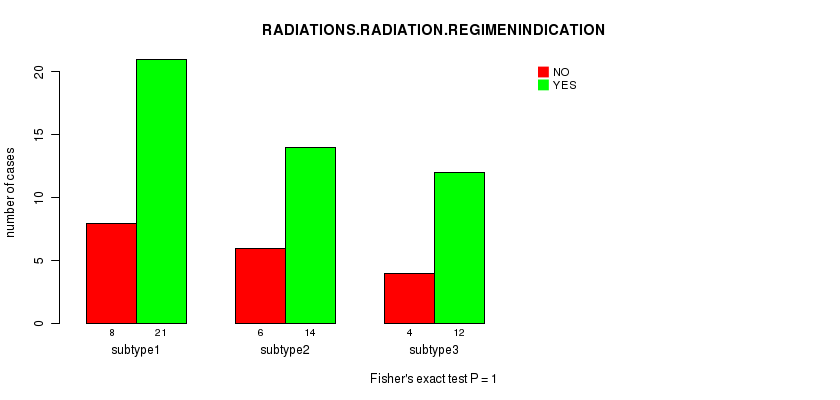
P value = 0.133 (Fisher's exact test), Q value = 1
Table S68. Clustering Approach #7: 'MIRseq Mature CNMF subtypes' versus Clinical Feature #7: 'RADIATIONS.RADIATION.REGIMENINDICATION'
| nPatients | NO | YES |
|---|---|---|
| ALL | 18 | 47 |
| subtype1 | 11 | 16 |
| subtype2 | 5 | 17 |
| subtype3 | 2 | 14 |
Figure S61. Get High-res Image Clustering Approach #7: 'MIRseq Mature CNMF subtypes' versus Clinical Feature #7: 'RADIATIONS.RADIATION.REGIMENINDICATION'
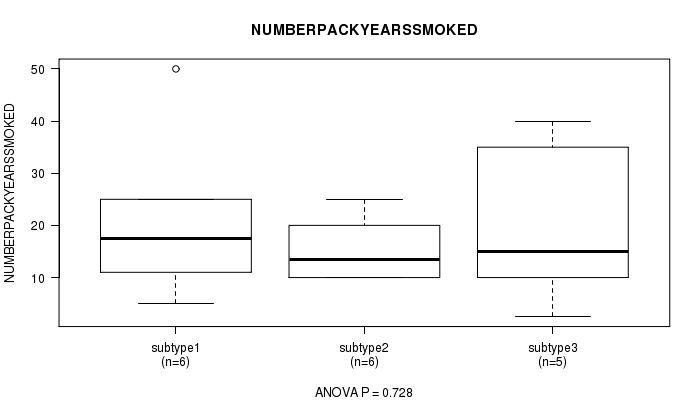
P value = 0.728 (ANOVA), Q value = 1
Table S69. Clustering Approach #7: 'MIRseq Mature CNMF subtypes' versus Clinical Feature #8: 'NUMBERPACKYEARSSMOKED'
| nPatients | Mean (Std.Dev) | |
|---|---|---|
| ALL | 17 | 18.9 (12.8) |
| subtype1 | 6 | 21.0 (15.8) |
| subtype2 | 6 | 15.3 (6.1) |
| subtype3 | 5 | 20.5 (16.2) |
Figure S62. Get High-res Image Clustering Approach #7: 'MIRseq Mature CNMF subtypes' versus Clinical Feature #8: 'NUMBERPACKYEARSSMOKED'
P value = 0.77 (ANOVA), Q value = 1
Table S70. Clustering Approach #7: 'MIRseq Mature CNMF subtypes' versus Clinical Feature #9: 'NUMBER.OF.LYMPH.NODES'
| nPatients | Mean (Std.Dev) | |
|---|---|---|
| ALL | 55 | 1.0 (2.5) |
| subtype1 | 22 | 1.2 (3.4) |
| subtype2 | 20 | 1.0 (2.1) |
| subtype3 | 13 | 0.5 (1.1) |
Figure S63. Get High-res Image Clustering Approach #7: 'MIRseq Mature CNMF subtypes' versus Clinical Feature #9: 'NUMBER.OF.LYMPH.NODES'
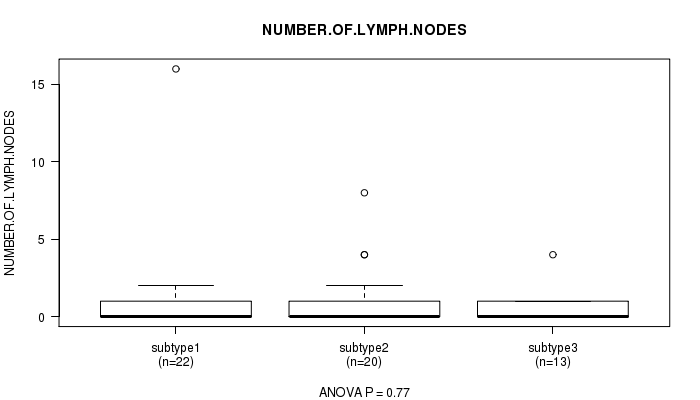
Table S71. Description of clustering approach #8: 'MIRseq Mature cHierClus subtypes'
| Cluster Labels | 1 | 2 | 3 |
|---|---|---|---|
| Number of samples | 29 | 20 | 16 |
P value = 0.942 (logrank test), Q value = 1
Table S72. Clustering Approach #8: 'MIRseq Mature cHierClus subtypes' versus Clinical Feature #1: 'Time to Death'
| nPatients | nDeath | Duration Range (Median), Month | |
|---|---|---|---|
| ALL | 63 | 13 | 0.1 - 177.0 (11.4) |
| subtype1 | 28 | 6 | 0.3 - 177.0 (18.6) |
| subtype2 | 19 | 4 | 0.1 - 101.8 (6.9) |
| subtype3 | 16 | 3 | 0.1 - 124.3 (16.7) |
Figure S64. Get High-res Image Clustering Approach #8: 'MIRseq Mature cHierClus subtypes' versus Clinical Feature #1: 'Time to Death'
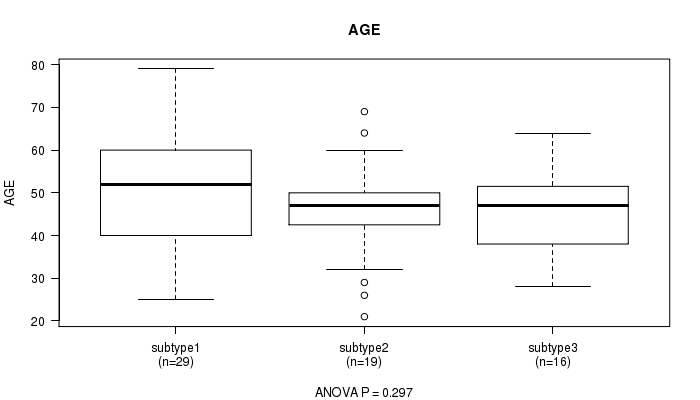
P value = 0.297 (ANOVA), Q value = 1
Table S73. Clustering Approach #8: 'MIRseq Mature cHierClus subtypes' versus Clinical Feature #2: 'AGE'
| nPatients | Mean (Std.Dev) | |
|---|---|---|
| ALL | 64 | 48.2 (13.2) |
| subtype1 | 29 | 51.1 (15.2) |
| subtype2 | 19 | 45.6 (12.3) |
| subtype3 | 16 | 46.2 (9.5) |
Figure S65. Get High-res Image Clustering Approach #8: 'MIRseq Mature cHierClus subtypes' versus Clinical Feature #2: 'AGE'
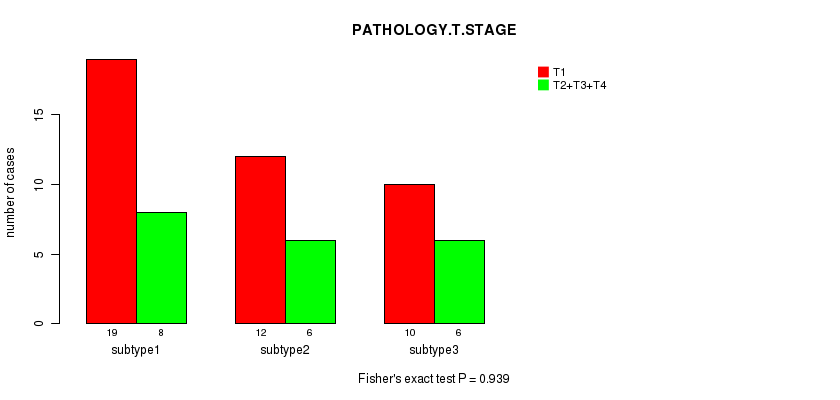
P value = 0.939 (Fisher's exact test), Q value = 1
Table S74. Clustering Approach #8: 'MIRseq Mature cHierClus subtypes' versus Clinical Feature #3: 'PATHOLOGY.T.STAGE'
| nPatients | T1 | T2+T3+T4 |
|---|---|---|
| ALL | 41 | 20 |
| subtype1 | 19 | 8 |
| subtype2 | 12 | 6 |
| subtype3 | 10 | 6 |
Figure S66. Get High-res Image Clustering Approach #8: 'MIRseq Mature cHierClus subtypes' versus Clinical Feature #3: 'PATHOLOGY.T.STAGE'
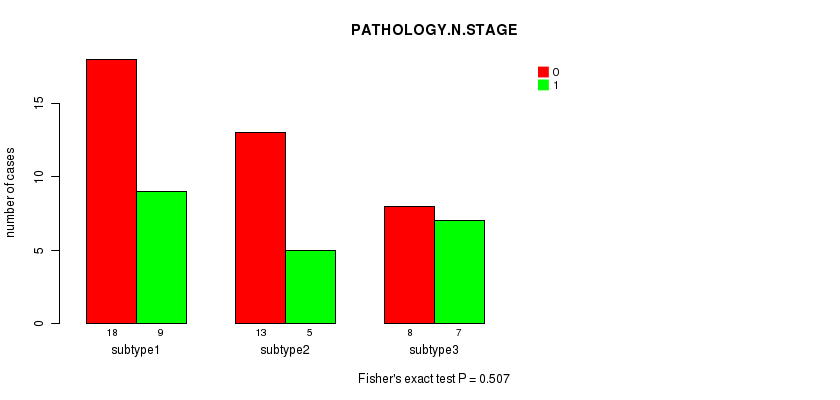
P value = 0.507 (Fisher's exact test), Q value = 1
Table S75. Clustering Approach #8: 'MIRseq Mature cHierClus subtypes' versus Clinical Feature #4: 'PATHOLOGY.N.STAGE'
| nPatients | 0 | 1 |
|---|---|---|
| ALL | 39 | 21 |
| subtype1 | 18 | 9 |
| subtype2 | 13 | 5 |
| subtype3 | 8 | 7 |
Figure S67. Get High-res Image Clustering Approach #8: 'MIRseq Mature cHierClus subtypes' versus Clinical Feature #4: 'PATHOLOGY.N.STAGE'
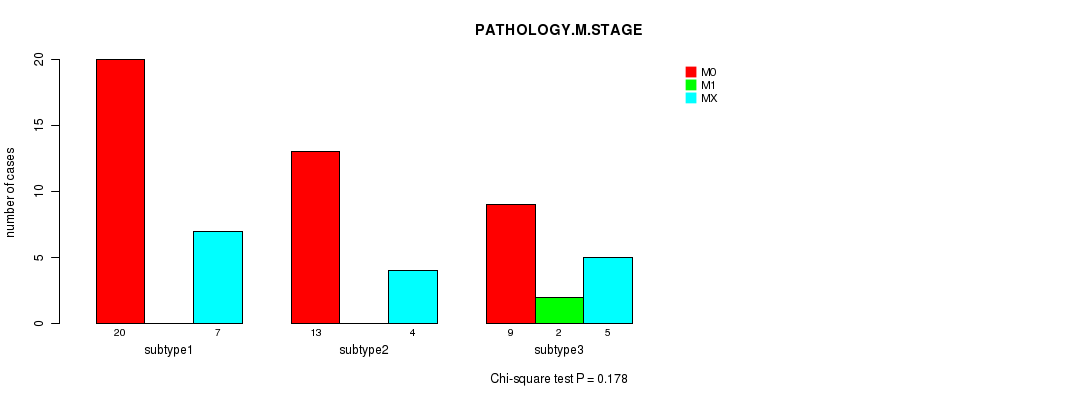
P value = 0.178 (Chi-square test), Q value = 1
Table S76. Clustering Approach #8: 'MIRseq Mature cHierClus subtypes' versus Clinical Feature #5: 'PATHOLOGY.M.STAGE'
| nPatients | M0 | M1 | MX |
|---|---|---|---|
| ALL | 42 | 2 | 16 |
| subtype1 | 20 | 0 | 7 |
| subtype2 | 13 | 0 | 4 |
| subtype3 | 9 | 2 | 5 |
Figure S68. Get High-res Image Clustering Approach #8: 'MIRseq Mature cHierClus subtypes' versus Clinical Feature #5: 'PATHOLOGY.M.STAGE'
P value = 9.65e-05 (Chi-square test), Q value = 0.0068
Table S77. Clustering Approach #8: 'MIRseq Mature cHierClus subtypes' versus Clinical Feature #6: 'HISTOLOGICAL.TYPE'
| nPatients | CERVICAL SQUAMOUS CELL CARCINOMA | ENDOCERVICAL ADENOCARCINOMA OF THE USUAL TYPE | ENDOCERVICAL TYPE OF ADENOCARCINOMA | ENDOMETRIOID ADENOCARCINOMA OF ENDOCERVIX |
|---|---|---|---|---|
| ALL | 57 | 1 | 6 | 1 |
| subtype1 | 29 | 0 | 0 | 0 |
| subtype2 | 20 | 0 | 0 | 0 |
| subtype3 | 8 | 1 | 6 | 1 |
Figure S69. Get High-res Image Clustering Approach #8: 'MIRseq Mature cHierClus subtypes' versus Clinical Feature #6: 'HISTOLOGICAL.TYPE'
P value = 1 (Fisher's exact test), Q value = 1
Table S78. Clustering Approach #8: 'MIRseq Mature cHierClus subtypes' versus Clinical Feature #7: 'RADIATIONS.RADIATION.REGIMENINDICATION'
| nPatients | NO | YES |
|---|---|---|
| ALL | 18 | 47 |
| subtype1 | 8 | 21 |
| subtype2 | 6 | 14 |
| subtype3 | 4 | 12 |
Figure S70. Get High-res Image Clustering Approach #8: 'MIRseq Mature cHierClus subtypes' versus Clinical Feature #7: 'RADIATIONS.RADIATION.REGIMENINDICATION'
P value = 0.654 (ANOVA), Q value = 1
Table S79. Clustering Approach #8: 'MIRseq Mature cHierClus subtypes' versus Clinical Feature #8: 'NUMBERPACKYEARSSMOKED'
| nPatients | Mean (Std.Dev) | |
|---|---|---|
| ALL | 17 | 18.9 (12.8) |
| subtype1 | 7 | 15.3 (5.5) |
| subtype2 | 6 | 21.0 (15.8) |
| subtype3 | 4 | 21.9 (18.4) |
Figure S71. Get High-res Image Clustering Approach #8: 'MIRseq Mature cHierClus subtypes' versus Clinical Feature #8: 'NUMBERPACKYEARSSMOKED'

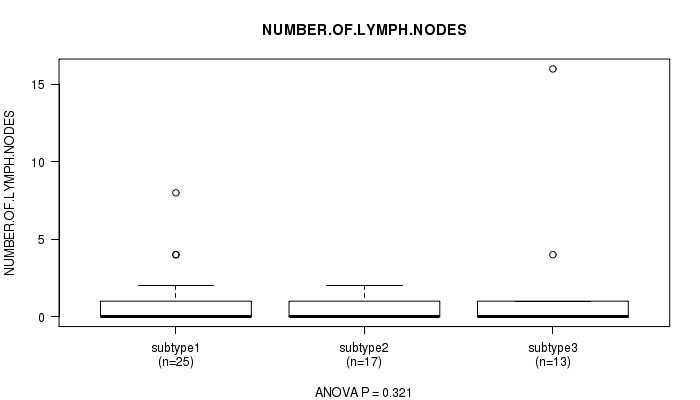
P value = 0.321 (ANOVA), Q value = 1
Table S80. Clustering Approach #8: 'MIRseq Mature cHierClus subtypes' versus Clinical Feature #9: 'NUMBER.OF.LYMPH.NODES'
| nPatients | Mean (Std.Dev) | |
|---|---|---|
| ALL | 55 | 1.0 (2.5) |
| subtype1 | 25 | 0.8 (1.9) |
| subtype2 | 17 | 0.5 (0.8) |
| subtype3 | 13 | 1.8 (4.4) |
Figure S72. Get High-res Image Clustering Approach #8: 'MIRseq Mature cHierClus subtypes' versus Clinical Feature #9: 'NUMBER.OF.LYMPH.NODES'
-
Cluster data file = CESC-TP.mergedcluster.txt
-
Clinical data file = CESC-TP.clin.merged.picked.txt
-
Number of patients = 74
-
Number of clustering approaches = 8
-
Number of selected clinical features = 9
-
Exclude small clusters that include fewer than K patients, K = 3
consensus non-negative matrix factorization clustering approach (Brunet et al. 2004)
Resampling-based clustering method (Monti et al. 2003)
For survival clinical features, the Kaplan-Meier survival curves of tumors with and without gene mutations were plotted and the statistical significance P values were estimated by logrank test (Bland and Altman 2004) using the 'survdiff' function in R
For continuous numerical clinical features, one-way analysis of variance (Howell 2002) was applied to compare the clinical values between tumor subtypes using 'anova' function in R
For binary clinical features, two-tailed Fisher's exact tests (Fisher 1922) were used to estimate the P values using the 'fisher.test' function in R
For multi-class clinical features (nominal or ordinal), Chi-square tests (Greenwood and Nikulin 1996) were used to estimate the P values using the 'chisq.test' function in R
For continuous numerical clinical features, two-tailed Student's t test with unequal variance (Lehmann and Romano 2005) was applied to compare the clinical values between two tumor subtypes using 't.test' function in R
For multiple hypothesis correction, Q value is the False Discovery Rate (FDR) analogue of the P value (Benjamini and Hochberg 1995), defined as the minimum FDR at which the test may be called significant. We used the 'Benjamini and Hochberg' method of 'p.adjust' function in R to convert P values into Q values.
In addition to the links below, the full results of the analysis summarized in this report can also be downloaded programmatically using firehose_get, or interactively from either the Broad GDAC website or TCGA Data Coordination Center Portal.