This pipeline uses various statistical tests to identify mRNAs whose expression levels correlated to selected clinical features.
Testing the association between 18202 genes and 9 clinical features across 63 samples, statistically thresholded by Q value < 0.05, 2 clinical features related to at least one genes.
-
1 gene correlated to 'AGE'.
-
CMA1|1215
-
274 genes correlated to 'HISTOLOGICAL.TYPE'.
-
PDZD3|79849 , TP63|8626 , CALML3|810 , LOC642587|642587 , CDHR2|54825 , ...
-
No genes correlated to 'Time to Death', 'PATHOLOGY.T.STAGE', 'PATHOLOGY.N.STAGE', 'PATHOLOGY.M.STAGE', 'RADIATIONS.RADIATION.REGIMENINDICATION', 'NUMBERPACKYEARSSMOKED', and 'NUMBER.OF.LYMPH.NODES'.
Complete statistical result table is provided in Supplement Table 1
Table 1. Get Full Table This table shows the clinical features, statistical methods used, and the number of genes that are significantly associated with each clinical feature at Q value < 0.05.
| Clinical feature | Statistical test | Significant genes | Associated with | Associated with | ||
|---|---|---|---|---|---|---|
| Time to Death | Cox regression test | N=0 | ||||
| AGE | Spearman correlation test | N=1 | older | N=0 | younger | N=1 |
| PATHOLOGY T STAGE | Spearman correlation test | N=0 | ||||
| PATHOLOGY N STAGE | t test | N=0 | ||||
| PATHOLOGY M STAGE | t test | N=0 | ||||
| HISTOLOGICAL TYPE | ANOVA test | N=274 | ||||
| RADIATIONS RADIATION REGIMENINDICATION | t test | N=0 | ||||
| NUMBERPACKYEARSSMOKED | Spearman correlation test | N=0 | ||||
| NUMBER OF LYMPH NODES | Spearman correlation test | N=0 |
Table S1. Basic characteristics of clinical feature: 'Time to Death'
| Time to Death | Duration (Months) | 0.1-177 (median=8) |
| censored | N = 51 | |
| death | N = 11 | |
| Significant markers | N = 0 |
Table S2. Basic characteristics of clinical feature: 'AGE'
| AGE | Mean (SD) | 48.43 (13) |
| Significant markers | N = 1 | |
| pos. correlated | 0 | |
| neg. correlated | 1 |
Table S3. Get Full Table List of one gene significantly correlated to 'AGE' by Spearman correlation test
| SpearmanCorr | corrP | Q | |
|---|---|---|---|
| CMA1|1215 | -0.7551 | 9.133e-07 | 0.0166 |
Figure S1. Get High-res Image As an example, this figure shows the association of CMA1|1215 to 'AGE'. P value = 9.13e-07 with Spearman correlation analysis. The straight line presents the best linear regression.
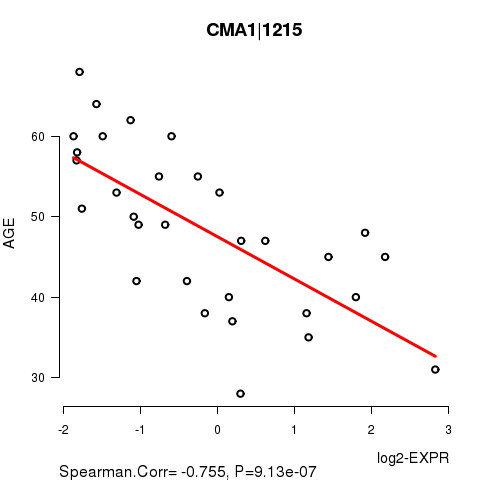
Table S4. Basic characteristics of clinical feature: 'PATHOLOGY.T.STAGE'
| PATHOLOGY.T.STAGE | Mean (SD) | 1.37 (0.61) |
| N | ||
| 1 | 40 | |
| 2 | 17 | |
| 3 | 1 | |
| 4 | 1 | |
| Significant markers | N = 0 |
Table S5. Basic characteristics of clinical feature: 'PATHOLOGY.N.STAGE'
| PATHOLOGY.N.STAGE | Labels | N |
| class0 | 39 | |
| class1 | 20 | |
| Significant markers | N = 0 |
Table S6. Basic characteristics of clinical feature: 'PATHOLOGY.M.STAGE'
| PATHOLOGY.M.STAGE | Labels | N |
| M0 | 38 | |
| MX | 20 | |
| Significant markers | N = 0 |
Table S7. Basic characteristics of clinical feature: 'HISTOLOGICAL.TYPE'
| HISTOLOGICAL.TYPE | Labels | N |
| CERVICAL SQUAMOUS CELL CARCINOMA | 55 | |
| ENDOCERVICAL ADENOCARCINOMA OF THE USUAL TYPE | 1 | |
| ENDOCERVICAL TYPE OF ADENOCARCINOMA | 6 | |
| ENDOMETRIOID ADENOCARCINOMA OF ENDOCERVIX | 1 | |
| Significant markers | N = 274 |
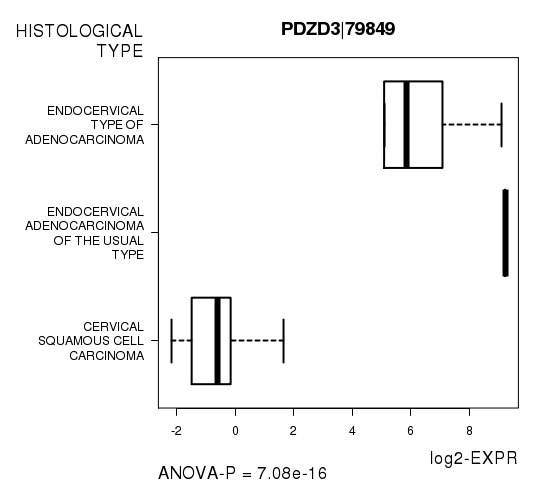
Table S8. Get Full Table List of top 10 genes differentially expressed by 'HISTOLOGICAL.TYPE'
| ANOVA_P | Q | |
|---|---|---|
| PDZD3|79849 | 7.082e-16 | 1.29e-11 |
| TP63|8626 | 1.497e-15 | 2.72e-11 |
| CALML3|810 | 3.213e-15 | 5.84e-11 |
| LOC642587|642587 | 8.428e-15 | 1.53e-10 |
| CDHR2|54825 | 1.818e-14 | 3.3e-10 |
| MYO7B|4648 | 2.924e-14 | 5.31e-10 |
| PKP1|5317 | 8.695e-14 | 1.58e-09 |
| DPP4|1803 | 6.778e-13 | 1.23e-08 |
| CLDN2|9075 | 9.185e-13 | 1.67e-08 |
| HNF1A|6927 | 1.024e-12 | 1.86e-08 |
Figure S2. Get High-res Image As an example, this figure shows the association of PDZD3|79849 to 'HISTOLOGICAL.TYPE'. P value = 7.08e-16 with ANOVA analysis.
No gene related to 'RADIATIONS.RADIATION.REGIMENINDICATION'.
Table S9. Basic characteristics of clinical feature: 'RADIATIONS.RADIATION.REGIMENINDICATION'
| RADIATIONS.RADIATION.REGIMENINDICATION | Labels | N |
| NO | 16 | |
| YES | 47 | |
| Significant markers | N = 0 |
Table S10. Basic characteristics of clinical feature: 'NUMBERPACKYEARSSMOKED'
| NUMBERPACKYEARSSMOKED | Mean (SD) | 19.24 (13) |
| Significant markers | N = 0 |
-
Expresson data file = CESC-TP.uncv2.mRNAseq_RSEM_normalized_log2.txt
-
Clinical data file = CESC-TP.clin.merged.picked.txt
-
Number of patients = 63
-
Number of genes = 18202
-
Number of clinical features = 9
For survival clinical features, Wald's test in univariate Cox regression analysis with proportional hazards model (Andersen and Gill 1982) was used to estimate the P values using the 'coxph' function in R. Kaplan-Meier survival curves were plot using the four quartile subgroups of patients based on expression levels
For continuous numerical clinical features, Spearman's rank correlation coefficients (Spearman 1904) and two-tailed P values were estimated using 'cor.test' function in R
For two-class clinical features, two-tailed Student's t test with unequal variance (Lehmann and Romano 2005) was applied to compare the log2-expression levels between the two clinical classes using 't.test' function in R
For multi-class clinical features (ordinal or nominal), one-way analysis of variance (Howell 2002) was applied to compare the log2-expression levels between different clinical classes using 'anova' function in R
For multiple hypothesis correction, Q value is the False Discovery Rate (FDR) analogue of the P value (Benjamini and Hochberg 1995), defined as the minimum FDR at which the test may be called significant. We used the 'Benjamini and Hochberg' method of 'p.adjust' function in R to convert P values into Q values.
In addition to the links below, the full results of the analysis summarized in this report can also be downloaded programmatically using firehose_get, or interactively from either the Broad GDAC website or TCGA Data Coordination Center Portal.