This report serves to describe the mutational landscape and properties of a given individual set, as well as rank genes and genesets according to mutational significance. MutSig v1.5 was used to generate the results found in this report.
-
Working with individual set: CESC-TP
-
Number of patients in set: 39
The input for this pipeline is a set of individuals with the following files associated for each:
-
An annotated .maf file describing the mutations called for the respective individual, and their properties.
-
A .wig file that contains information about the coverage of the sample.
-
MAF used for this analysis:CESC-TP.final_analysis_set.maf
-
Significantly mutated genes (q ≤ 0.1): 5
-
Mutations seen in COSMIC: 38
-
Significantly mutated genes in COSMIC territory: 2
-
Genes with clustered mutations (≤ 3 aa apart): 76
-
Significantly mutated genesets: 0
-
Significantly mutated genesets: (excluding sig. mutated genes):0
-
Read 39 MAFs of type "Broad"
-
Total number of mutations in input MAFs: 10020
-
After removing 5 mutations outside chr1-24: 10015
-
After removing 781 noncoding mutations: 9234
-
Number of mutations before filtering: 9234
-
After removing 153 mutations outside gene set: 9081
-
After removing 21 mutations outside category set: 9060
Table 1. Get Full Table Table representing breakdown of mutations by type.
| type | count |
|---|---|
| Frame_Shift_Del | 117 |
| Frame_Shift_Ins | 68 |
| In_Frame_Del | 58 |
| In_Frame_Ins | 18 |
| Missense_Mutation | 5653 |
| Nonsense_Mutation | 474 |
| Nonstop_Mutation | 11 |
| Silent | 2551 |
| Splice_Site | 97 |
| Translation_Start_Site | 13 |
| Total | 9060 |
Table 2. Get Full Table A breakdown of mutation rates per category discovered for this individual set.
| category | n | N | rate | rate_per_mb | relative_rate | exp_ns_s_ratio |
|---|---|---|---|---|---|---|
| Tp*C->(T/G) | 3540 | 150569812 | 0.000024 | 24 | 4.1 | 3 |
| (A/C/G)p*C->(T/G) | 1145 | 425623126 | 2.7e-06 | 2.7 | 0.47 | 2.7 |
| C->A | 351 | 576192938 | 6.1e-07 | 0.61 | 0.11 | 4.4 |
| A->mut | 630 | 556925266 | 1.1e-06 | 1.1 | 0.2 | 3.9 |
| indel+null | 824 | 1133118204 | 7.3e-07 | 0.73 | 0.13 | NaN |
| double_null | 19 | 1133118204 | 1.7e-08 | 0.017 | 0.0029 | NaN |
| Total | 6509 | 1133118204 | 5.7e-06 | 5.7 | 1 | 3.5 |
The x axis represents the samples. The y axis represents the exons, one row per exon, and they are sorted by average coverage across samples. For exons with exactly the same average coverage, they are sorted next by the %GC of the exon. (The secondary sort is especially useful for the zero-coverage exons at the bottom).
Figure 1.
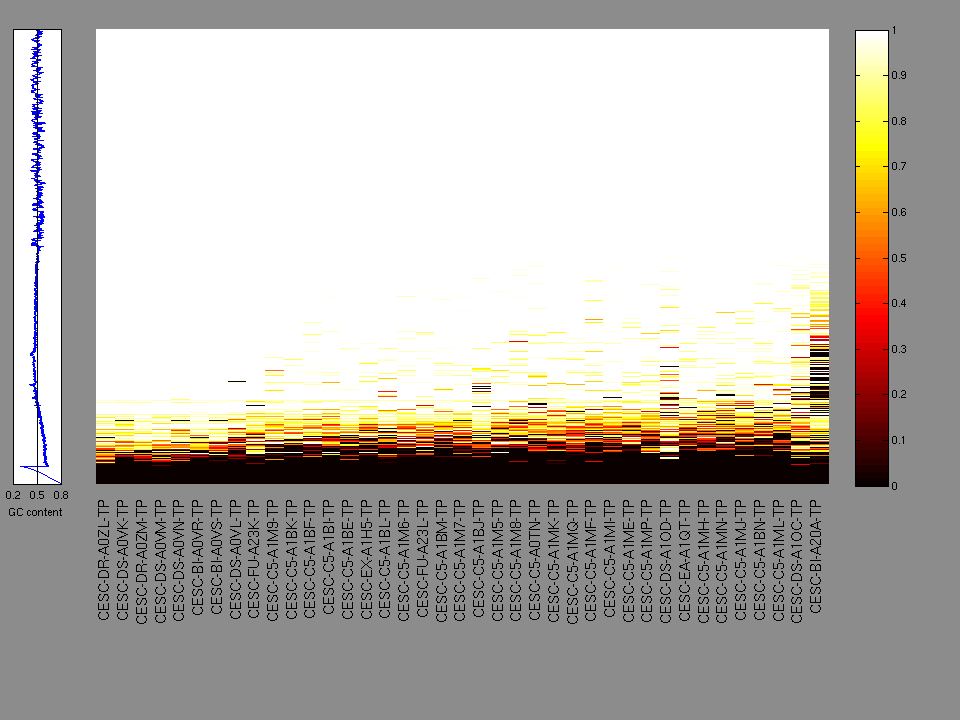
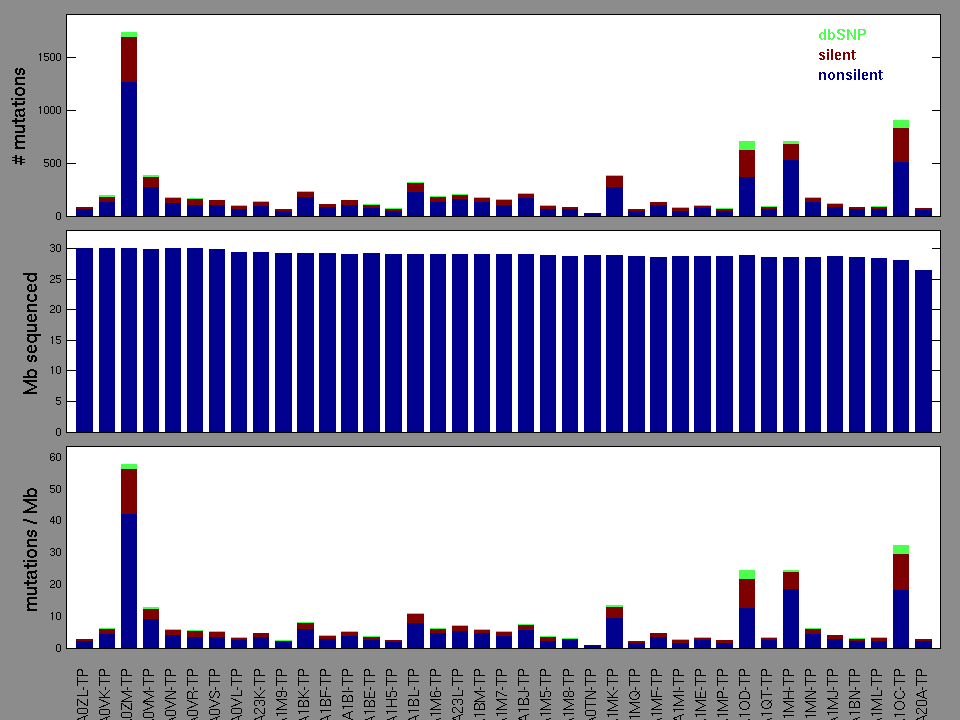
Figure 2. Patients counts and rates file used to generate this plot: CESC-TP.patients.counts_and_rates.txt
The mutation spectrum is depicted in the lego plots below in which the 96 possible mutation types are subdivided into six large blocks, color-coded to reflect the base substitution type. Each large block is further subdivided into the 16 possible pairs of 5' and 3' neighbors, as listed in the 4x4 trinucleotide context legend. The height of each block corresponds to the mutation frequency for that kind of mutation (counts of mutations normalized by the base coverage in a given bin). The shape of the spectrum is a signature for dominant mutational mechanisms in different tumor types.
Figure 3. Get High-res Image SNV Mutation rate lego plot for entire set. Each bin is normalized by base coverage for that bin. Colors represent the six SNV types on the upper right. The three-base context for each mutation is labeled in the 4x4 legend on the lower right. The fractional breakdown of SNV counts is shown in the pie chart on the upper left. If this figure is blank, not enough information was provided in the MAF to generate it.
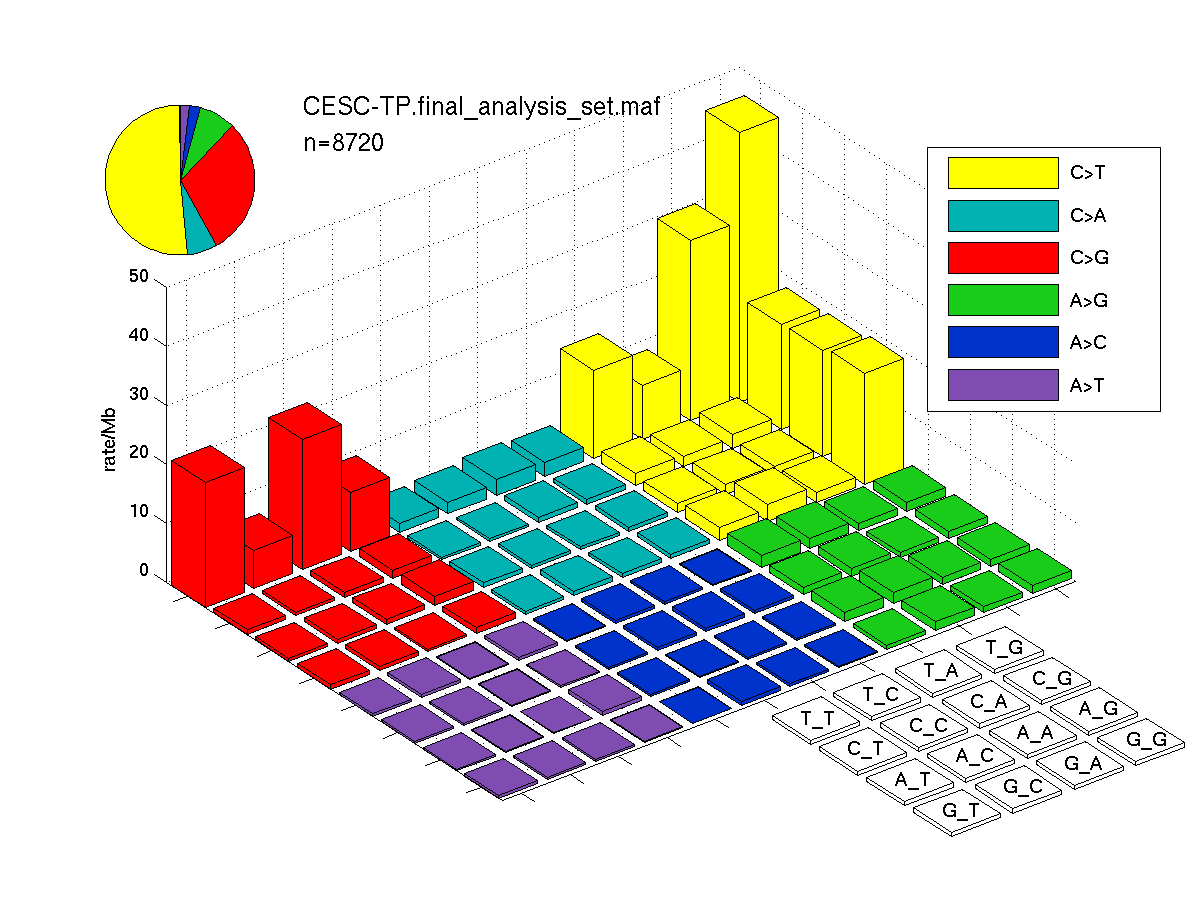
Figure 4. Get High-res Image SNV Mutation rate lego plots for 4 slices of mutation allele fraction (0<=AF<0.1, 0.1<=AF<0.25, 0.25<=AF<0.5, & 0.5<=AF) . The color code and three-base context legends are the same as the previous figure. If this figure is blank, not enough information was provided in the MAF to generate it.
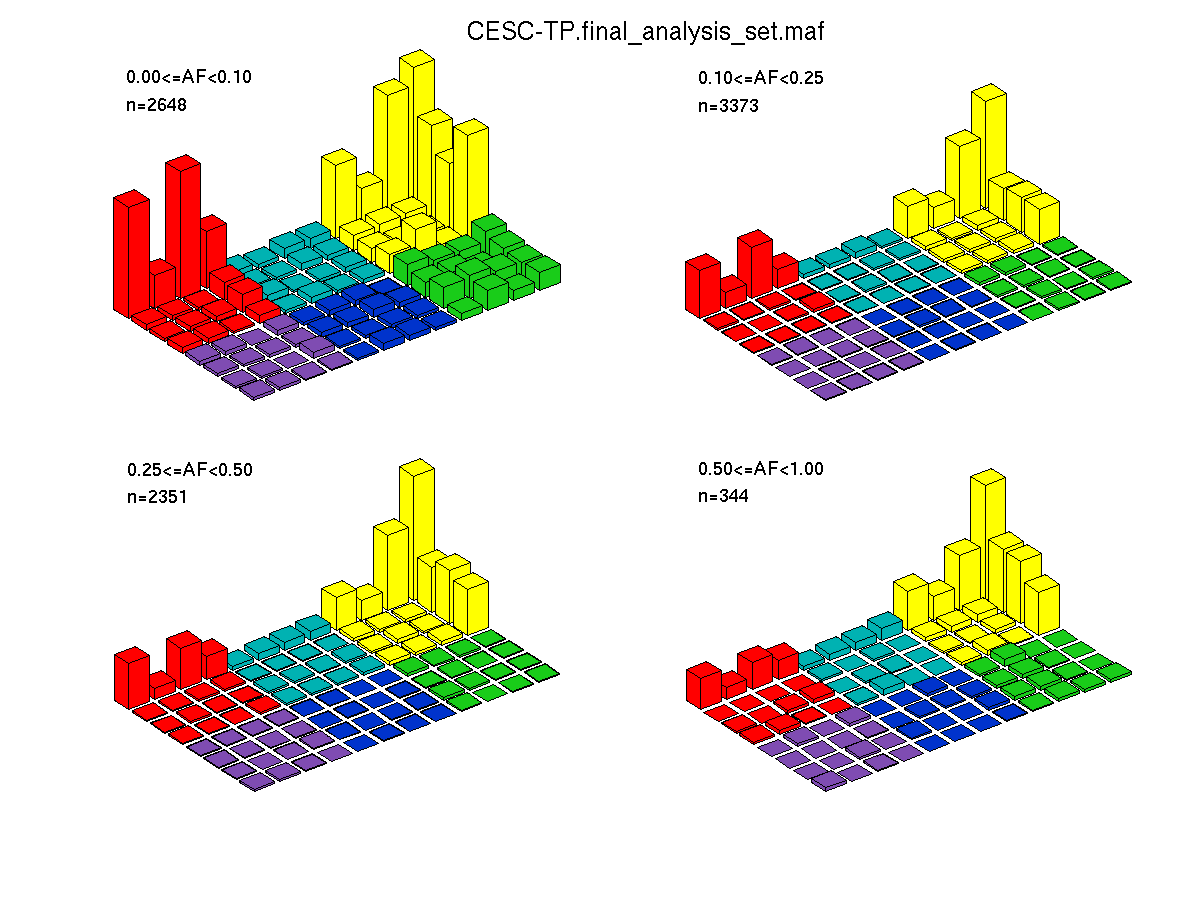
Figure 5. Get High-res Image The matrix in the center of the figure represents individual mutations in patient samples, color-coded by type of mutation, for the significantly mutated genes. The rate of synonymous and non-synonymous mutations is displayed at the top of the matrix. The barplot on the left of the matrix shows the number of mutations in each gene. The percentages represent the fraction of tumors with at least one mutation in the specified gene. The barplot to the right of the matrix displays the q-values for the most significantly mutated genes. The purple boxplots below the matrix (only displayed if required columns are present in the provided MAF) represent the distributions of allelic fractions observed in each sample. The plot at the bottom represents the base substitution distribution of individual samples, using the same categories that were used to calculate significance.
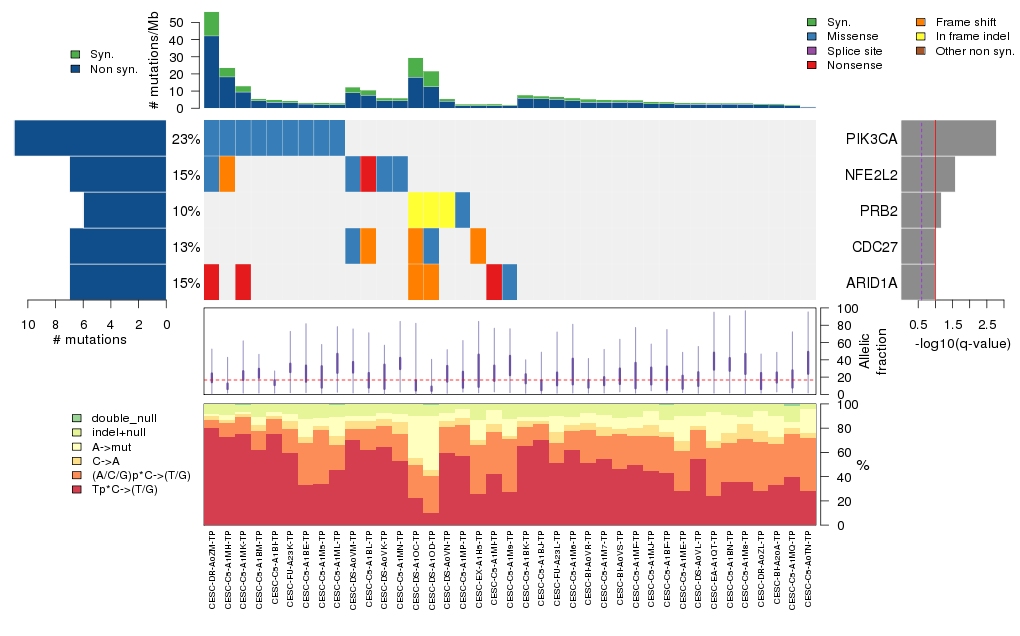
Column Descriptions:
-
N = number of sequenced bases in this gene across the individual set
-
n = number of (nonsilent) mutations in this gene across the individual set
-
npat = number of patients (individuals) with at least one nonsilent mutation
-
nsite = number of unique sites having a non-silent mutation
-
nsil = number of silent mutations in this gene across the individual set
-
n1 = number of nonsilent mutations of type: Tp*C->(T/G)
-
n2 = number of nonsilent mutations of type: (A/C/G)p*C->(T/G)
-
n3 = number of nonsilent mutations of type: C->A
-
n4 = number of nonsilent mutations of type: A->mut
-
n5 = number of nonsilent mutations of type: indel+null
-
n6 = number of nonsilent mutations of type: double_null
-
p_ns_s = p-value for the observed nonsilent/silent ratio being elevated in this gene
-
p = p-value (overall)
-
q = q-value, False Discovery Rate (Benjamini-Hochberg procedure)
Table 3. Get Full Table A Ranked List of Significantly Mutated Genes. Number of significant genes found: 5. Number of genes displayed: 35. Click on a gene name to display its stick figure depicting the distribution of mutations and mutation types across the chosen gene (this feature may not be available for all significant genes).
| rank | gene | description | N | n | npat | nsite | nsil | n1 | n2 | n3 | n4 | n5 | n6 | p_ns_s | p | q |
|---|---|---|---|---|---|---|---|---|---|---|---|---|---|---|---|---|
| 1 | PIK3CA | phosphoinositide-3-kinase, catalytic, alpha polypeptide | 126650 | 11 | 9 | 4 | 0 | 10 | 0 | 0 | 1 | 0 | 0 | 0.12 | 3.6e-08 | 0.00065 |
| 2 | NFE2L2 | nuclear factor (erythroid-derived 2)-like 2 | 69545 | 7 | 6 | 6 | 0 | 4 | 0 | 0 | 1 | 2 | 0 | 0.34 | 2.8e-06 | 0.025 |
| 3 | PRB2 | proline-rich protein BstNI subfamily 2 | 49240 | 6 | 4 | 5 | 0 | 0 | 0 | 0 | 1 | 5 | 0 | 0.52 | 0.000011 | 0.066 |
| 4 | CDC27 | cell division cycle 27 homolog (S. cerevisiae) | 97176 | 7 | 5 | 4 | 0 | 0 | 0 | 1 | 3 | 3 | 0 | 0.37 | 0.000024 | 0.095 |
| 5 | ARID1A | AT rich interactive domain 1A (SWI-like) | 226053 | 7 | 6 | 6 | 0 | 1 | 1 | 0 | 0 | 3 | 2 | 0.29 | 0.000026 | 0.095 |
| 6 | PTH2 | parathyroid hormone 2 | 8040 | 2 | 2 | 2 | 0 | 1 | 0 | 1 | 0 | 0 | 0 | 0.38 | 0.000051 | 0.15 |
| 7 | POU4F1 | POU class 4 homeobox 1 | 22119 | 3 | 3 | 2 | 0 | 1 | 0 | 0 | 0 | 2 | 0 | 0.66 | 0.000072 | 0.18 |
| 8 | SSX7 | synovial sarcoma, X breakpoint 7 | 23049 | 5 | 3 | 4 | 0 | 0 | 2 | 1 | 2 | 0 | 0 | 0.34 | 0.000081 | 0.18 |
| 9 | PTEN | phosphatase and tensin homolog (mutated in multiple advanced cancers 1) | 45935 | 3 | 3 | 3 | 0 | 0 | 0 | 0 | 0 | 3 | 0 | 0.59 | 0.000088 | 0.18 |
| 10 | AQP2 | aquaporin 2 (collecting duct) | 29453 | 3 | 3 | 3 | 0 | 1 | 1 | 0 | 1 | 0 | 0 | 0.33 | 0.000098 | 0.18 |
| 11 | LYZL1 | lysozyme-like 1 | 22057 | 3 | 3 | 3 | 0 | 1 | 1 | 0 | 0 | 1 | 0 | 0.36 | 0.00014 | 0.2 |
| 12 | TMCC1 | transmembrane and coiled-coil domain family 1 | 77000 | 4 | 4 | 3 | 0 | 0 | 0 | 1 | 0 | 3 | 0 | 0.82 | 0.00014 | 0.2 |
| 13 | PLAC4 | placenta-specific 4 | 7160 | 2 | 2 | 2 | 0 | 0 | 0 | 0 | 0 | 1 | 1 | 1 | 0.00014 | 0.2 |
| 14 | OR5H6 | olfactory receptor, family 5, subfamily H, member 6 | 38003 | 3 | 3 | 3 | 0 | 1 | 0 | 0 | 1 | 1 | 0 | 0.39 | 0.00017 | 0.22 |
| 15 | ZNF43 | zinc finger protein 43 | 95053 | 4 | 4 | 4 | 0 | 1 | 0 | 1 | 1 | 1 | 0 | 0.58 | 0.0002 | 0.23 |
| 16 | ERP27 | endoplasmic reticulum protein 27 kDa | 32955 | 3 | 3 | 3 | 0 | 0 | 2 | 0 | 1 | 0 | 0 | 0.46 | 0.0002 | 0.23 |
| 17 | TMEM51 | transmembrane protein 51 | 29872 | 3 | 3 | 3 | 0 | 1 | 1 | 0 | 1 | 0 | 0 | 0.4 | 0.00032 | 0.32 |
| 18 | PRG4 | proteoglycan 4 | 166081 | 15 | 5 | 12 | 0 | 2 | 1 | 1 | 1 | 10 | 0 | 0.32 | 0.0004 | 0.32 |
| 19 | TPTE | transmembrane phosphatase with tensin homology | 67719 | 3 | 3 | 3 | 0 | 1 | 0 | 0 | 1 | 1 | 0 | 0.62 | 0.0004 | 0.32 |
| 20 | IQCG | IQ motif containing G | 53508 | 3 | 3 | 3 | 0 | 2 | 0 | 0 | 0 | 1 | 0 | 0.46 | 0.00041 | 0.32 |
| 21 | FCRL1 | Fc receptor-like 1 | 53853 | 3 | 3 | 3 | 0 | 1 | 0 | 0 | 2 | 0 | 0 | 0.45 | 0.00042 | 0.32 |
| 22 | TMCO2 | transmembrane and coiled-coil domains 2 | 21723 | 2 | 2 | 2 | 0 | 1 | 0 | 0 | 0 | 1 | 0 | 0.79 | 0.00042 | 0.32 |
| 23 | DNAJB1 | DnaJ (Hsp40) homolog, subfamily B, member 1 | 39158 | 5 | 3 | 5 | 0 | 3 | 0 | 1 | 0 | 1 | 0 | 0.21 | 0.00043 | 0.32 |
| 24 | DENND2C | DENN/MADD domain containing 2C | 104208 | 4 | 4 | 4 | 1 | 3 | 1 | 0 | 0 | 0 | 0 | 0.73 | 0.00043 | 0.32 |
| 25 | ARHGAP6 | Rho GTPase activating protein 6 | 97775 | 4 | 4 | 4 | 1 | 2 | 0 | 2 | 0 | 0 | 0 | 0.69 | 0.00045 | 0.32 |
| 26 | NFYB | nuclear transcription factor Y, beta | 25367 | 2 | 2 | 1 | 0 | 0 | 0 | 0 | 0 | 2 | 0 | 0.55 | 0.00083 | 0.57 |
| 27 | MMEL1 | membrane metallo-endopeptidase-like 1 | 78452 | 4 | 4 | 4 | 0 | 2 | 2 | 0 | 0 | 0 | 0 | 0.21 | 0.00092 | 0.58 |
| 28 | KLHL1 | kelch-like 1 (Drosophila) | 86290 | 3 | 3 | 3 | 0 | 0 | 2 | 0 | 1 | 0 | 0 | 0.46 | 0.00095 | 0.58 |
| 29 | C11orf52 | chromosome 11 open reading frame 52 | 14969 | 2 | 2 | 2 | 0 | 1 | 0 | 0 | 0 | 1 | 0 | 0.51 | 0.00098 | 0.58 |
| 30 | PCSK4 | proprotein convertase subtilisin/kexin type 4 | 50811 | 3 | 3 | 3 | 0 | 1 | 1 | 1 | 0 | 0 | 0 | 0.29 | 0.001 | 0.58 |
| 31 | MAGEC1 | melanoma antigen family C, 1 | 133929 | 7 | 5 | 6 | 0 | 2 | 0 | 0 | 2 | 3 | 0 | 0.28 | 0.001 | 0.58 |
| 32 | CSAG1 | chondrosarcoma associated gene 1 | 9711 | 3 | 2 | 3 | 0 | 0 | 0 | 0 | 3 | 0 | 0 | 0.4 | 0.001 | 0.58 |
| 33 | MAPK1 | mitogen-activated protein kinase 1 | 38660 | 3 | 3 | 1 | 0 | 3 | 0 | 0 | 0 | 0 | 0 | 0.41 | 0.0011 | 0.58 |
| 34 | ZFAND5 | zinc finger, AN1-type domain 5 | 25726 | 2 | 2 | 2 | 0 | 0 | 1 | 1 | 0 | 0 | 0 | 0.74 | 0.0011 | 0.58 |
| 35 | IL28B | interleukin 28B (interferon, lambda 3) | 21576 | 2 | 2 | 2 | 0 | 0 | 1 | 0 | 1 | 0 | 0 | 0.57 | 0.0012 | 0.58 |
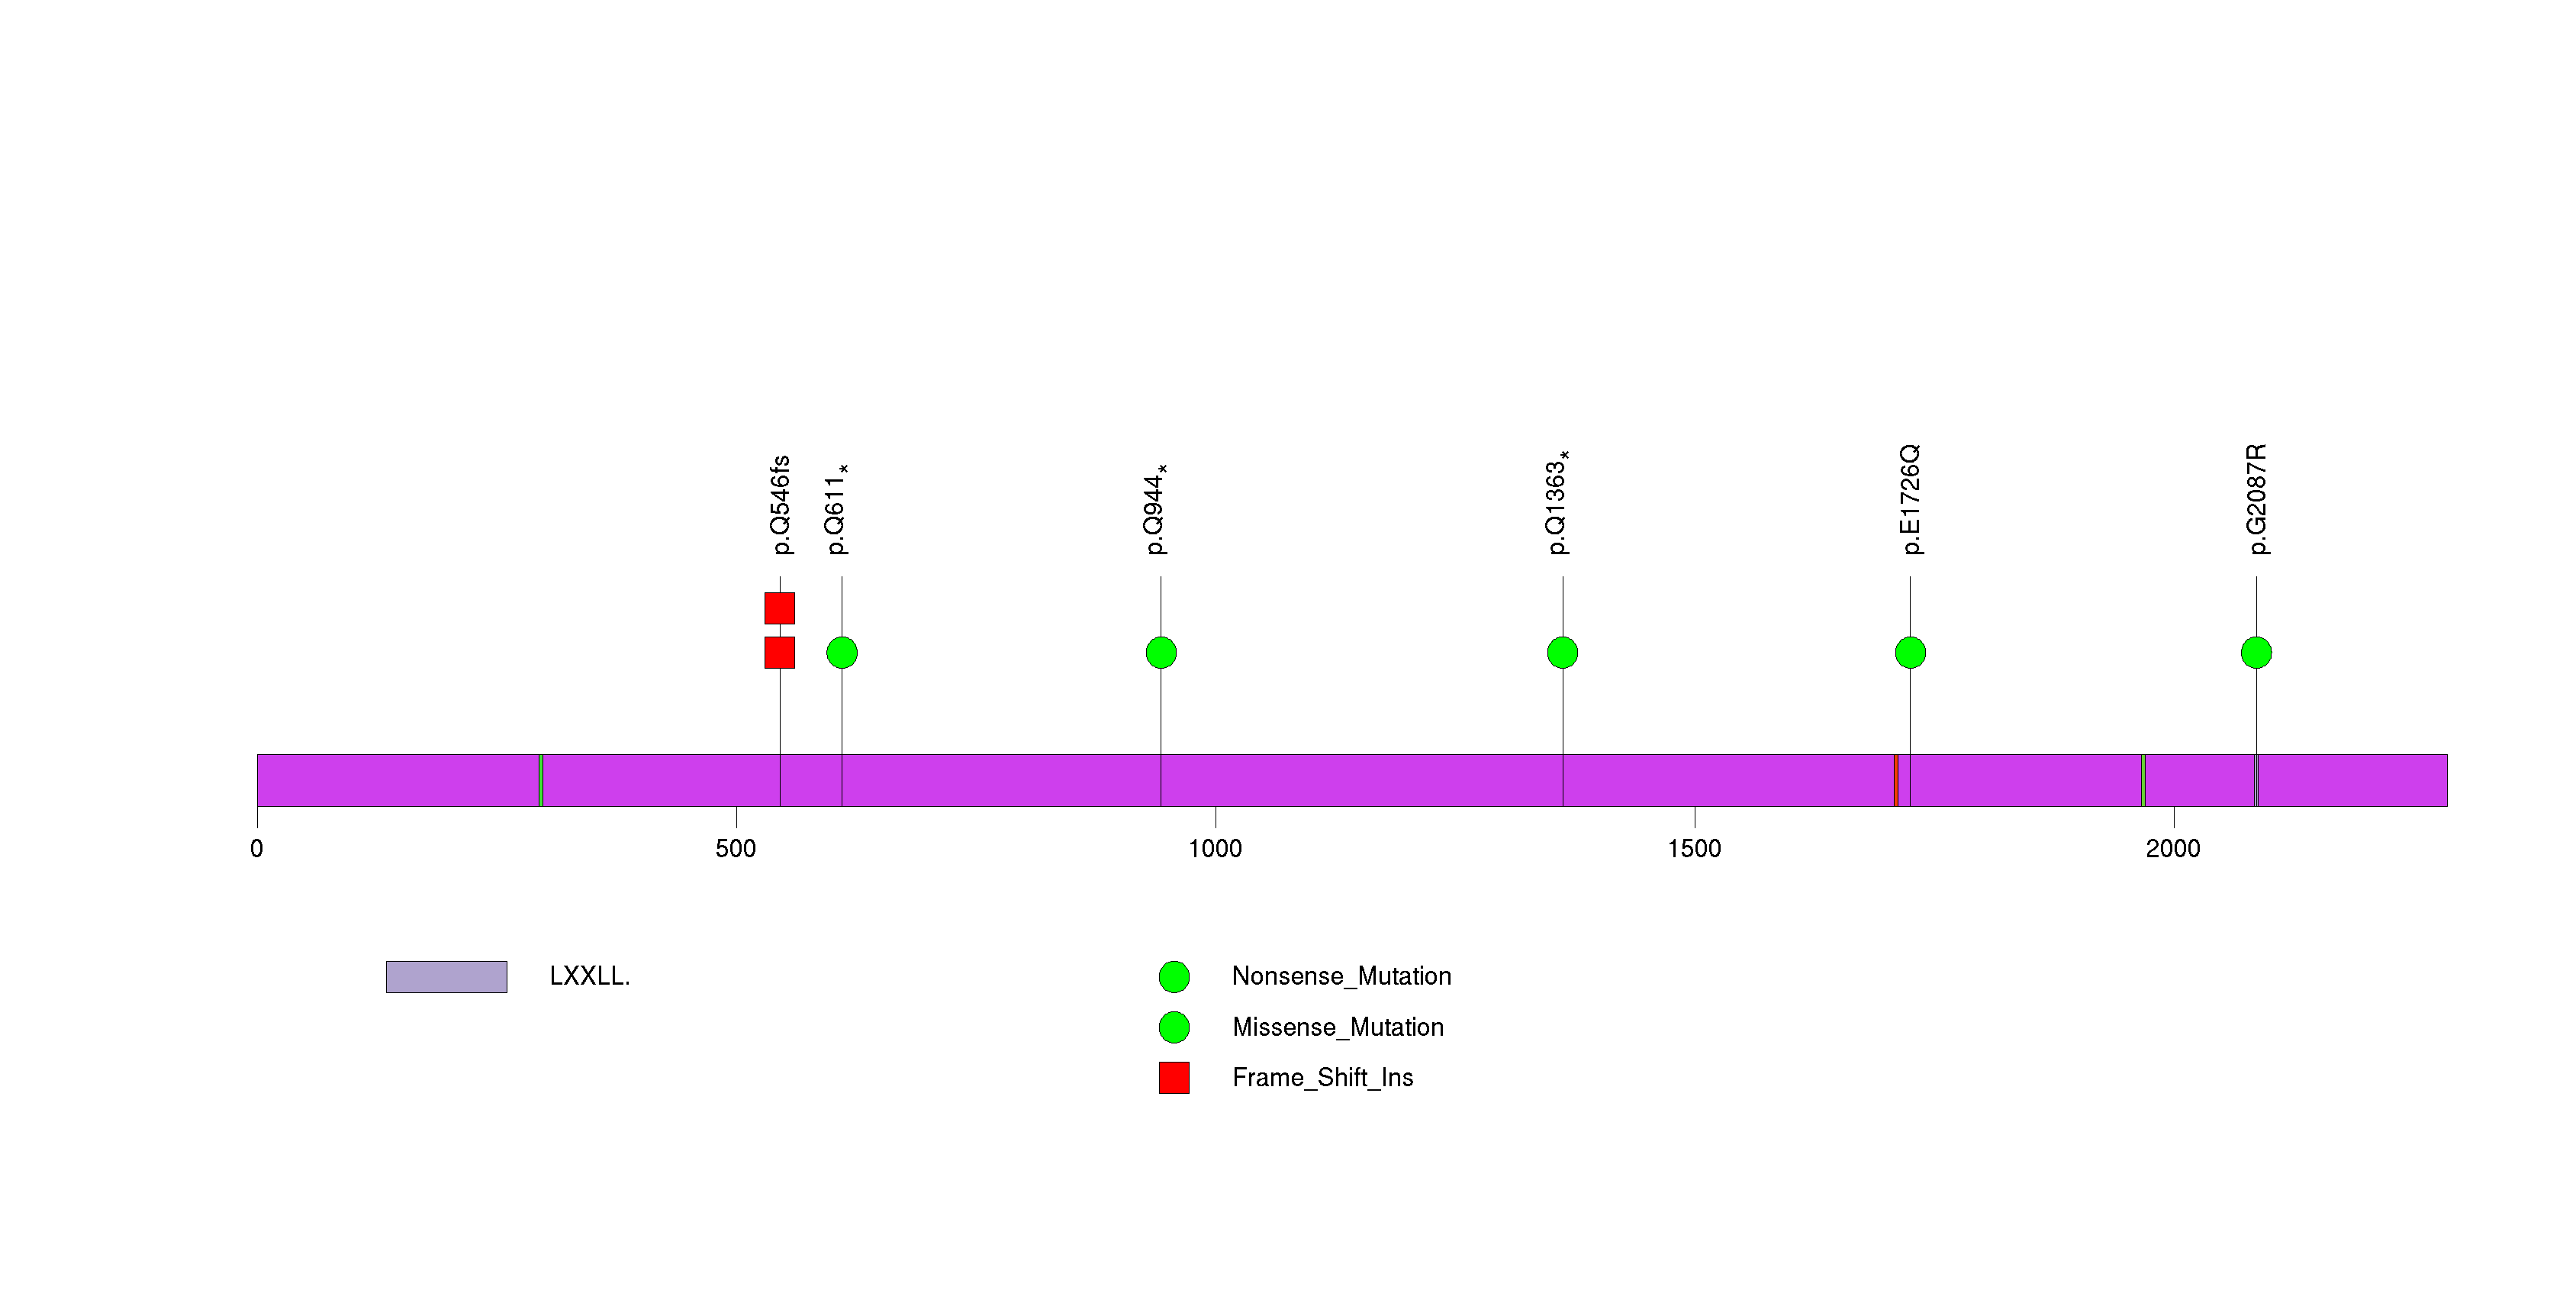
Figure S1. This figure depicts the distribution of mutations and mutation types across the PIK3CA significant gene.
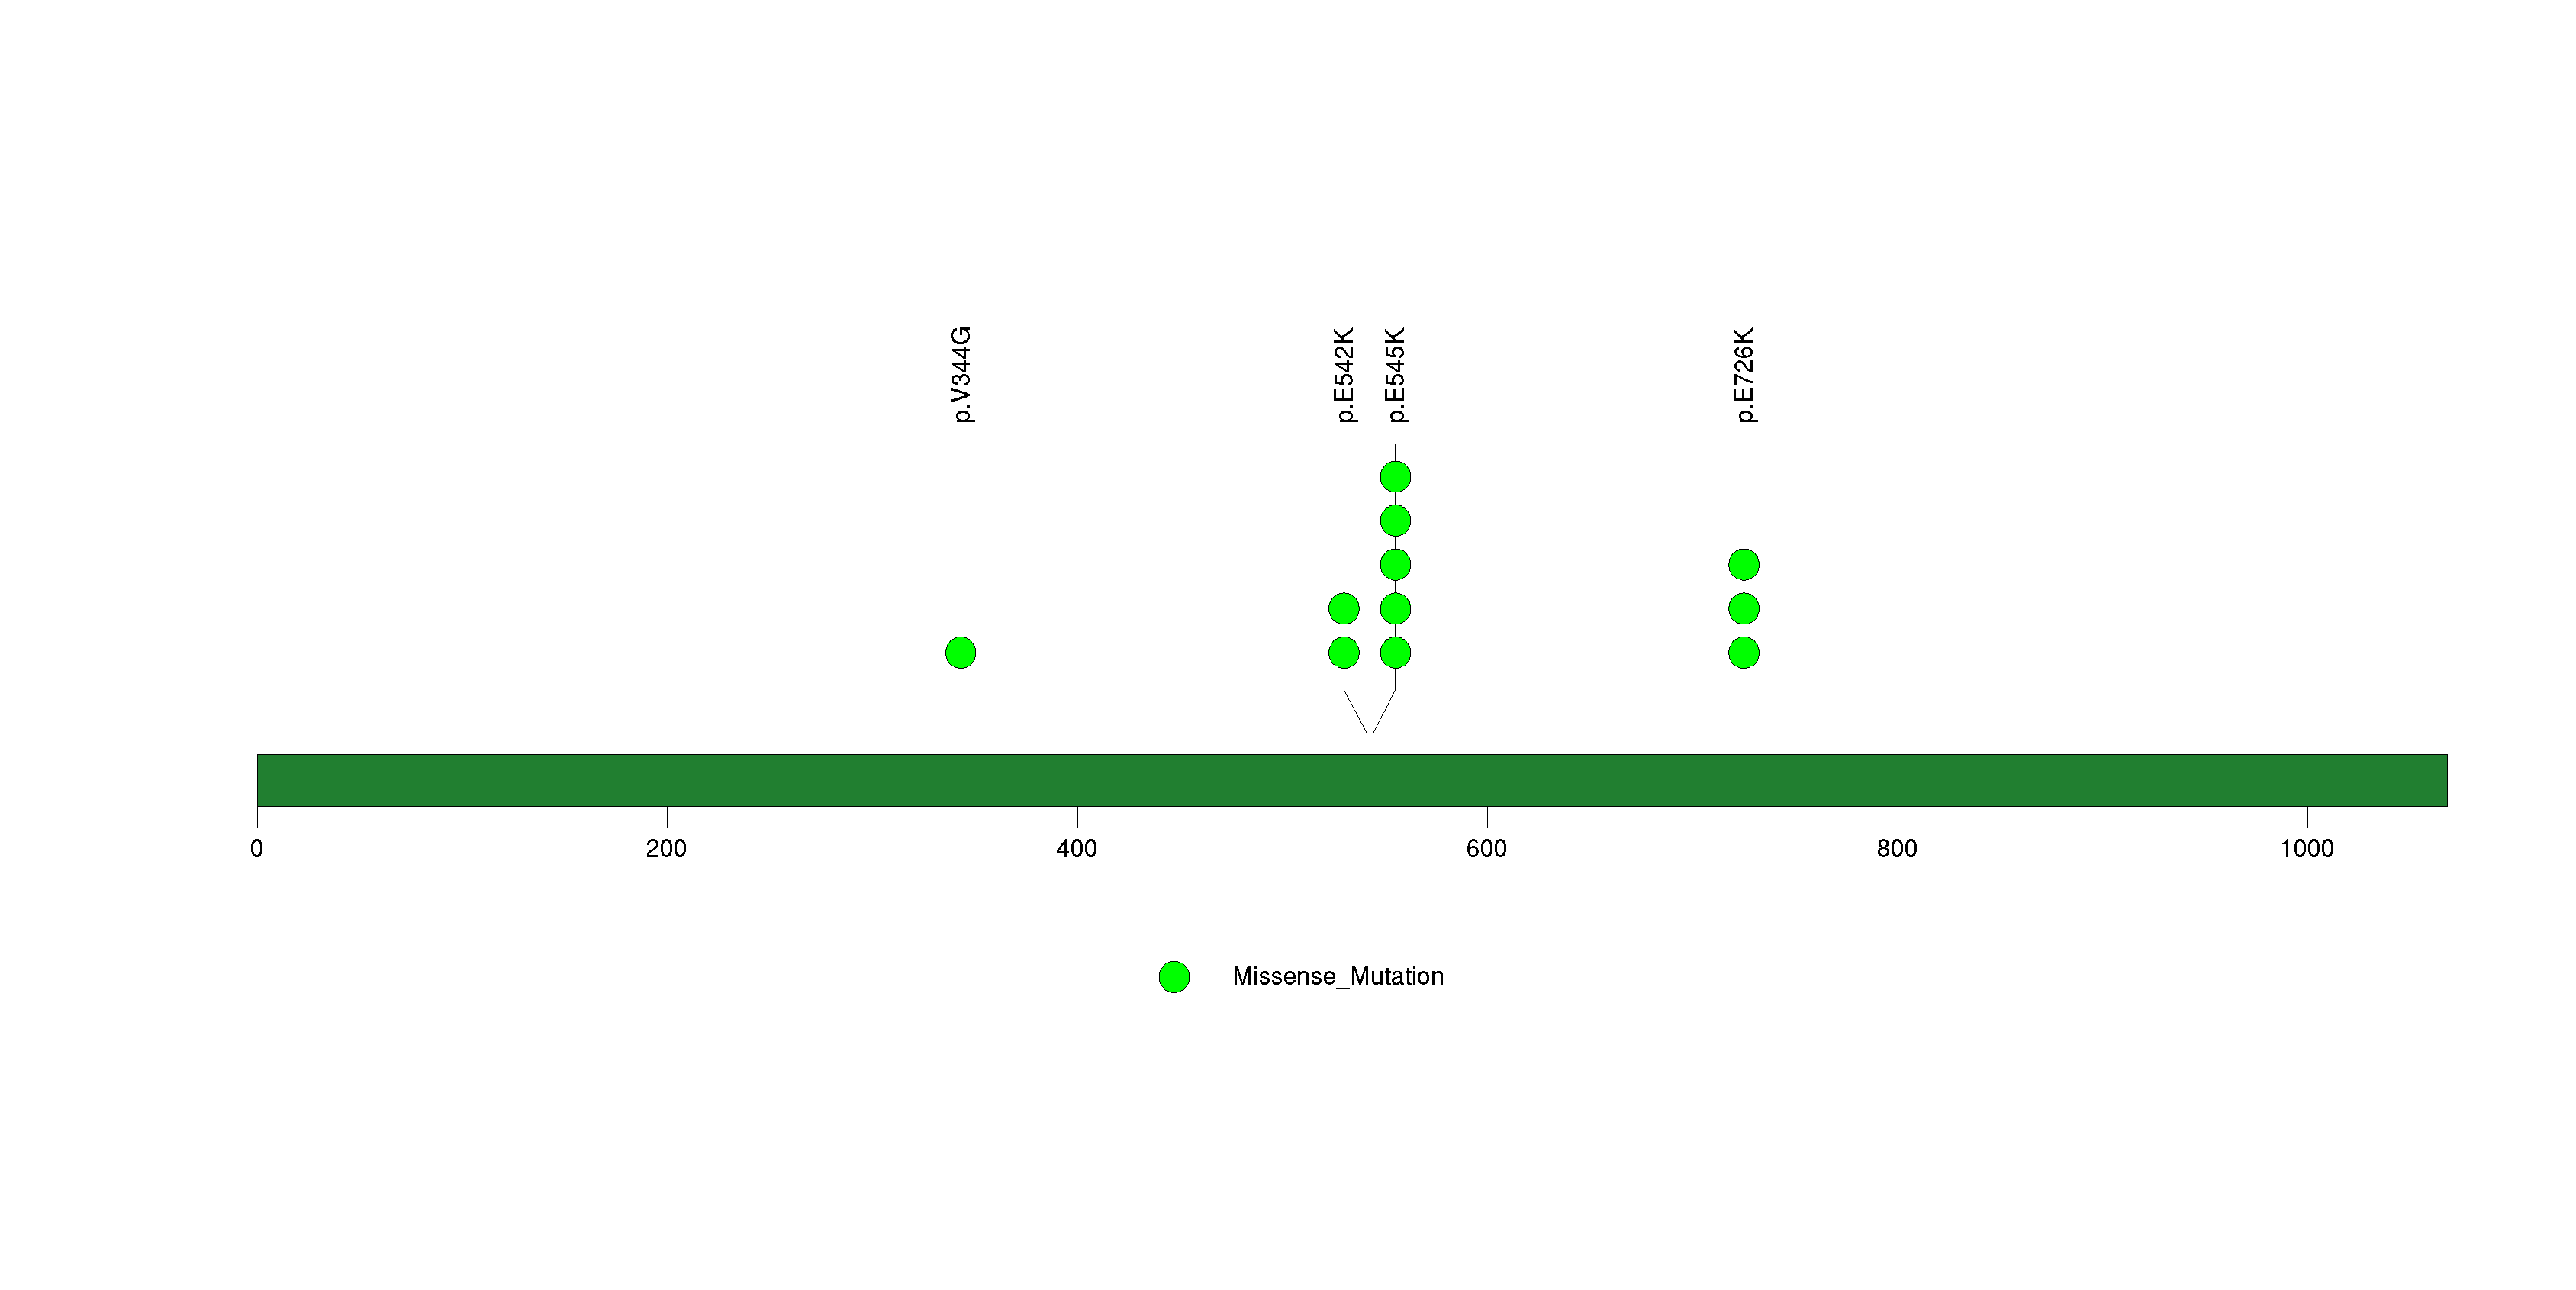
Figure S2. This figure depicts the distribution of mutations and mutation types across the NFE2L2 significant gene.
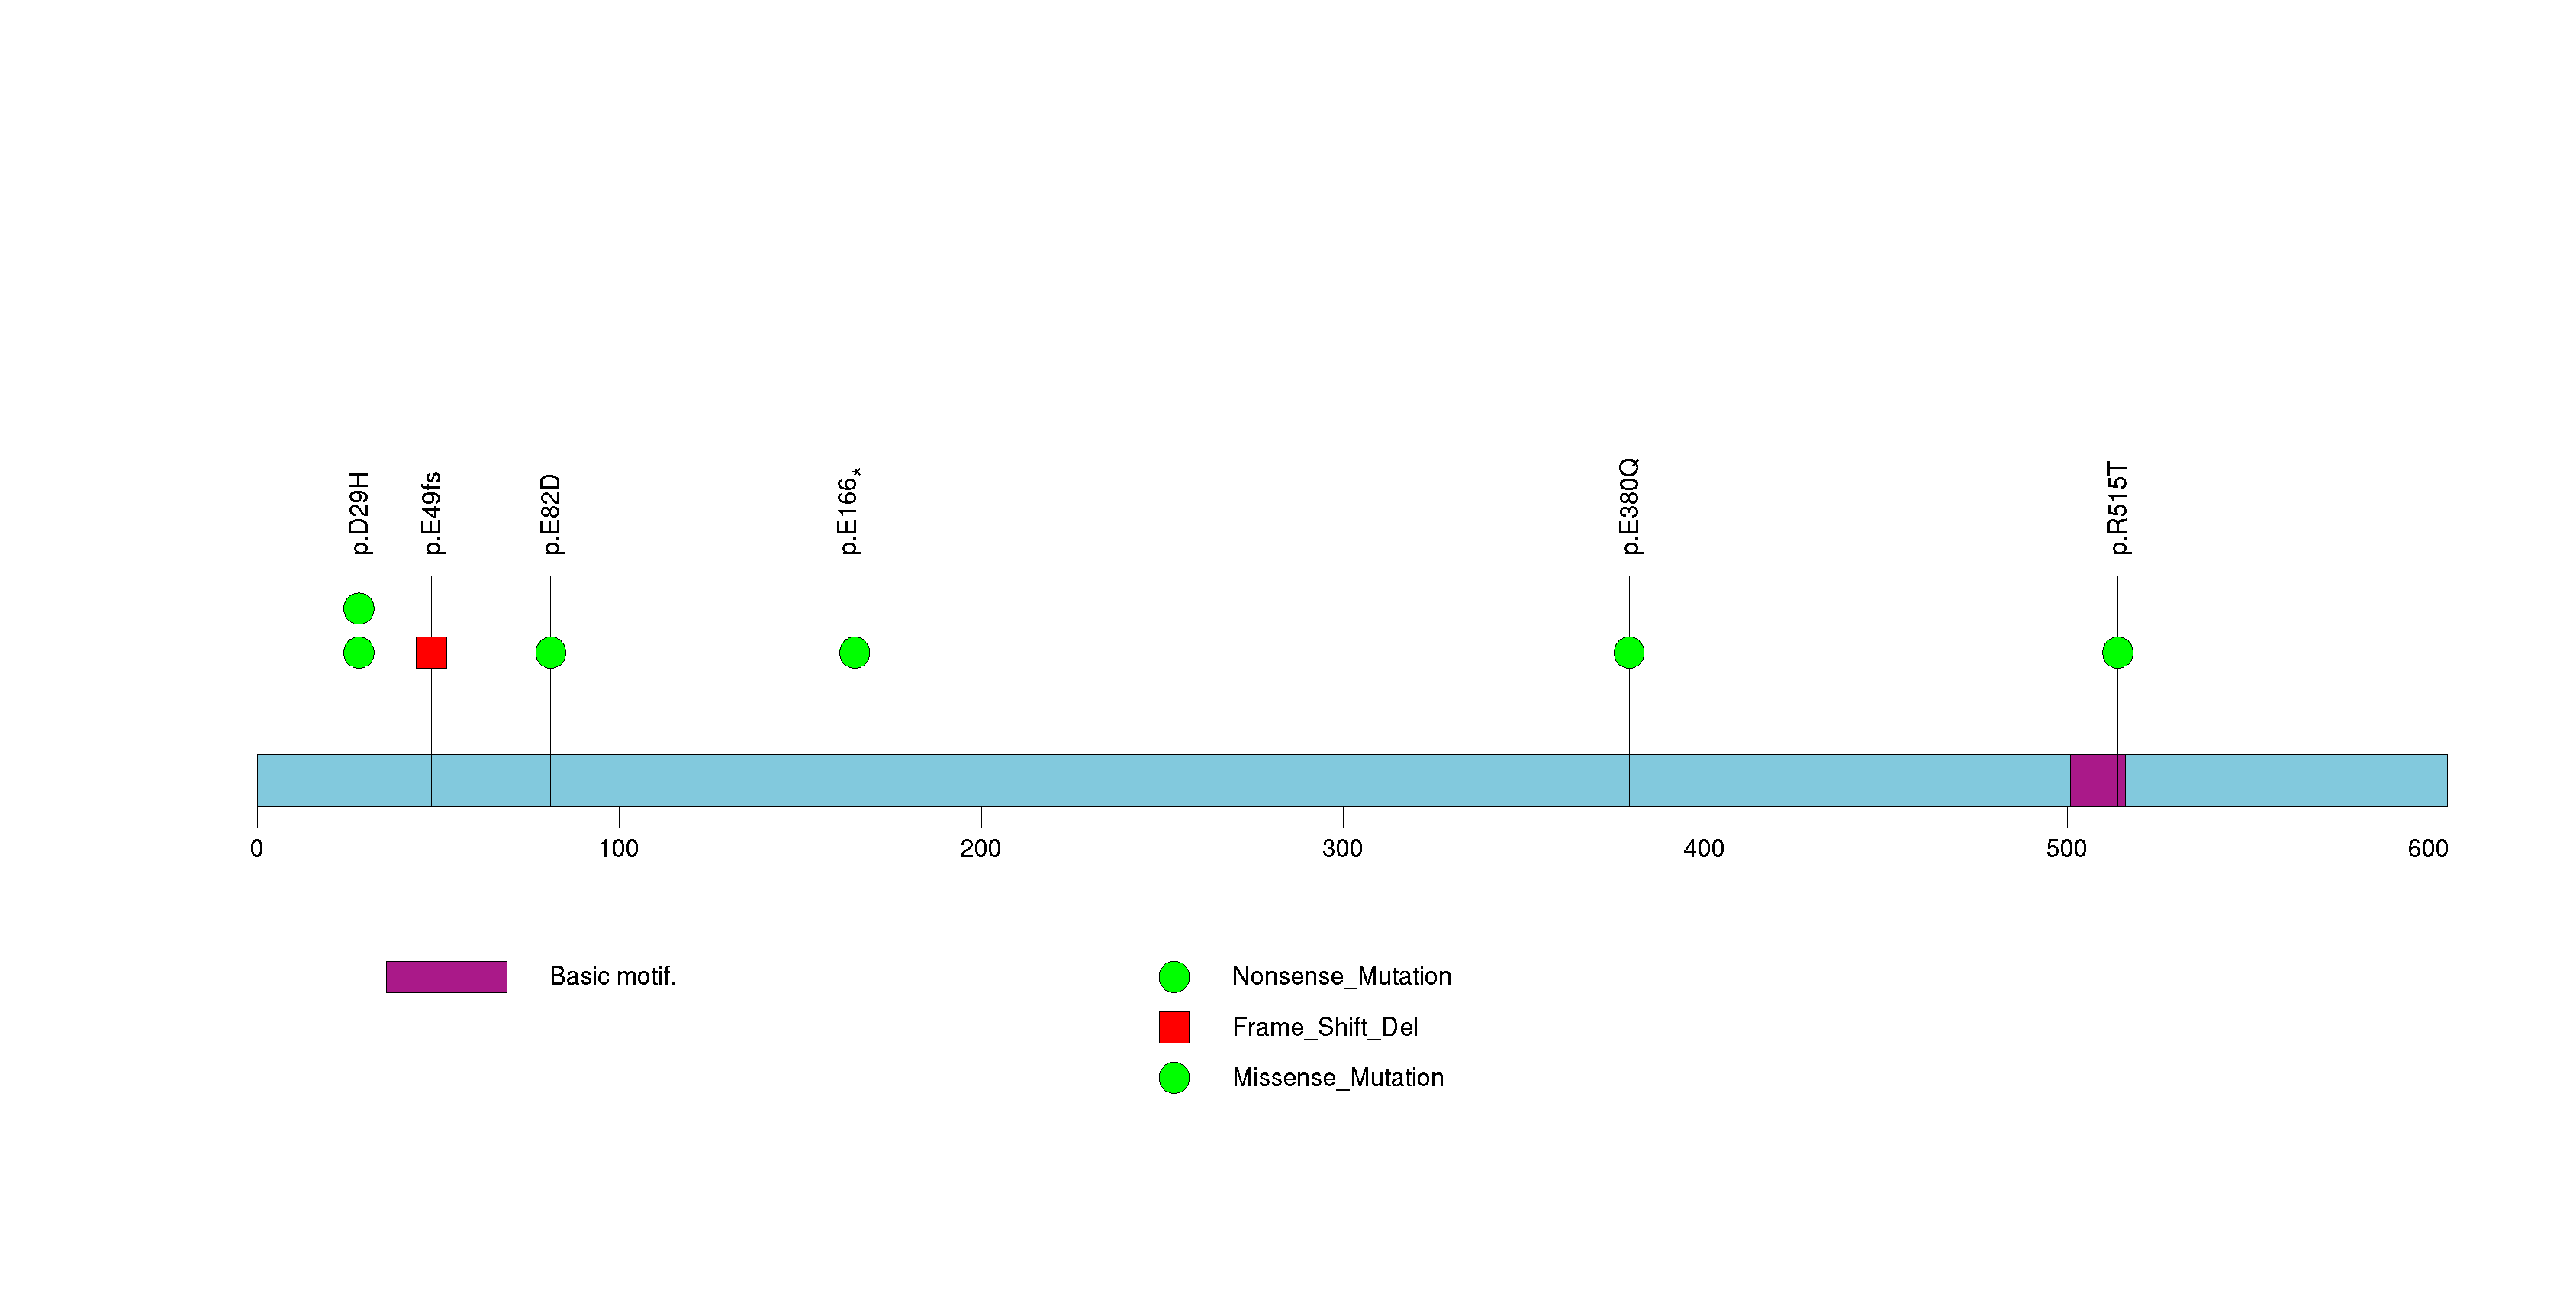
Figure S3. This figure depicts the distribution of mutations and mutation types across the CDC27 significant gene.
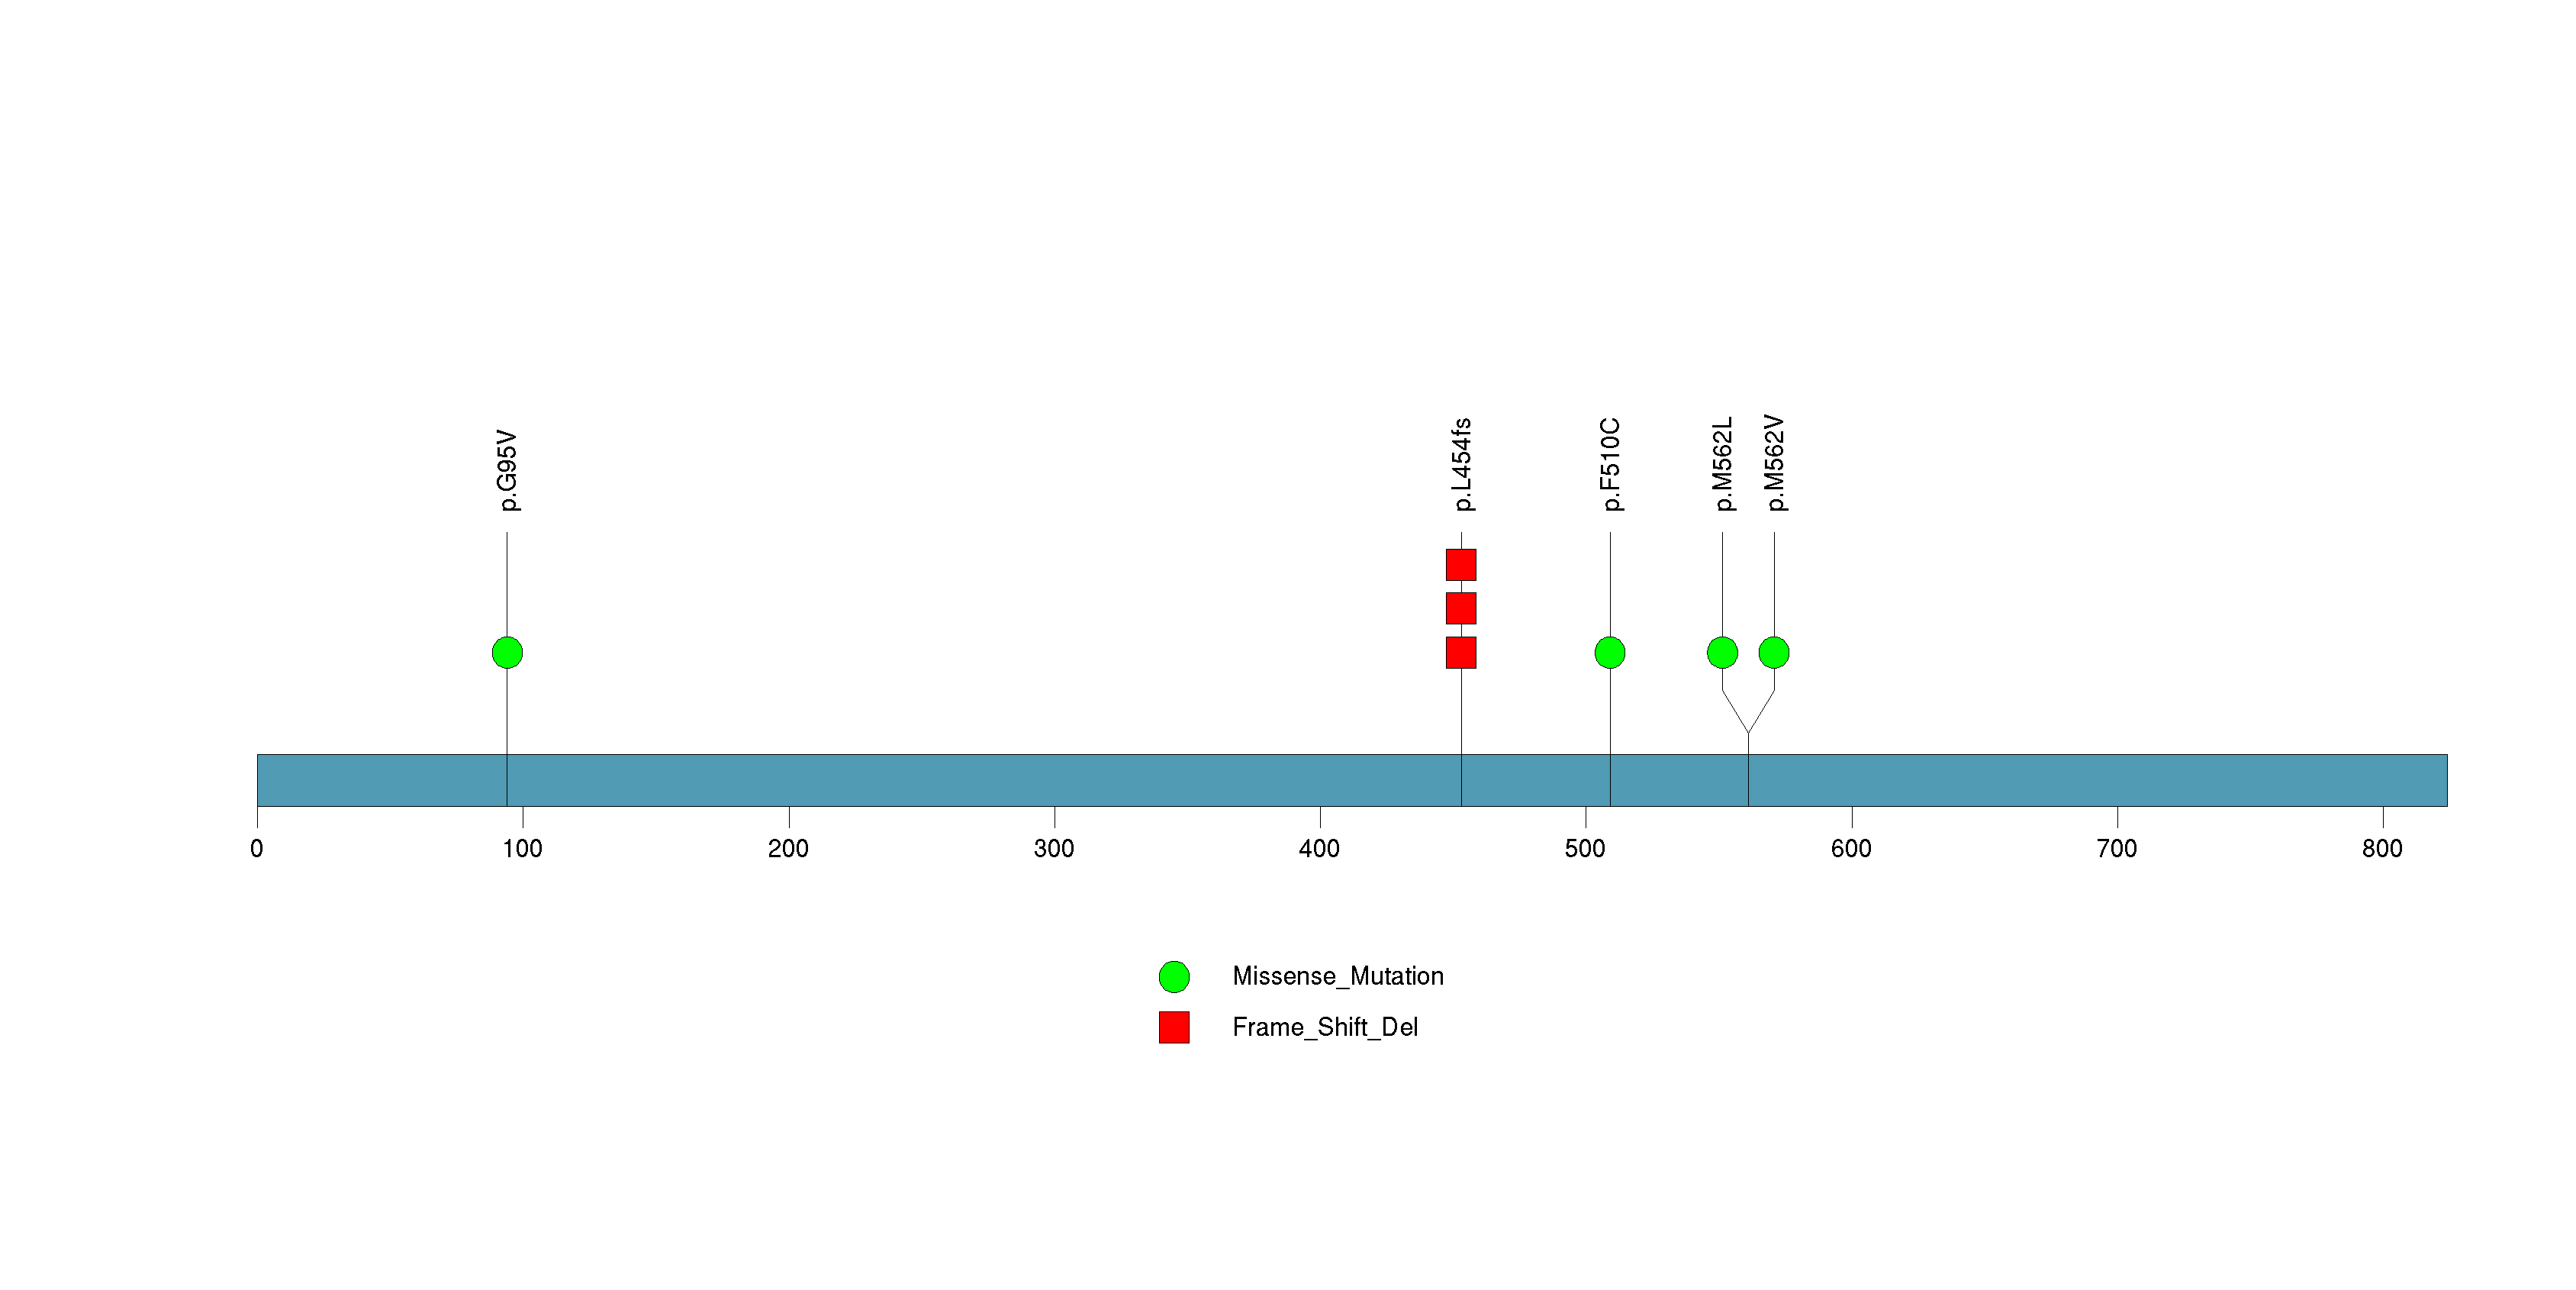
Figure S4. This figure depicts the distribution of mutations and mutation types across the ARID1A significant gene.
In this analysis, COSMIC is used as a filter to increase power by restricting the territory of each gene. Cosmic version: v48.
Table 4. Get Full Table Significantly mutated genes (COSMIC territory only). To access the database please go to: COSMIC. Number of significant genes found: 2. Number of genes displayed: 10
| rank | gene | description | n | cos | n_cos | N_cos | cos_ev | p | q |
|---|---|---|---|---|---|---|---|---|---|
| 1 | PIK3CA | phosphoinositide-3-kinase, catalytic, alpha polypeptide | 11 | 220 | 8 | 8580 | 3939 | 0 | 0 |
| 2 | CHEK2 | CHK2 checkpoint homolog (S. pombe) | 2 | 2 | 2 | 78 | 2 | 9.9e-08 | 0.00022 |
| 3 | ATL2 | atlastin GTPase 2 | 1 | 1 | 1 | 39 | 1 | 0.00022 | 0.13 |
| 4 | EDA | ectodysplasin A | 1 | 1 | 1 | 39 | 1 | 0.00022 | 0.13 |
| 5 | KIAA1024 | KIAA1024 | 2 | 1 | 1 | 39 | 1 | 0.00022 | 0.13 |
| 6 | KRTAP5-5 | keratin associated protein 5-5 | 2 | 1 | 1 | 39 | 1 | 0.00022 | 0.13 |
| 7 | MAPK11 | mitogen-activated protein kinase 11 | 1 | 1 | 1 | 39 | 1 | 0.00022 | 0.13 |
| 8 | SUV39H2 | suppressor of variegation 3-9 homolog 2 (Drosophila) | 1 | 1 | 1 | 39 | 2 | 0.00022 | 0.13 |
| 9 | ALS2 | amyotrophic lateral sclerosis 2 (juvenile) | 2 | 3 | 1 | 117 | 1 | 0.00067 | 0.2 |
| 10 | EPHA10 | EPH receptor A10 | 1 | 3 | 1 | 117 | 1 | 0.00067 | 0.2 |
Note:
n - number of (nonsilent) mutations in this gene across the individual set.
cos = number of unique mutated sites in this gene in COSMIC
n_cos = overlap between n and cos.
N_cos = number of individuals times cos.
cos_ev = total evidence: number of reports in COSMIC for mutations seen in this gene.
p = p-value for seeing the observed amount of overlap in this gene)
q = q-value, False Discovery Rate (Benjamini-Hochberg procedure)
Table 5. Get Full Table Genes with Clustered Mutations
| num | gene | desc | n | mindist | nmuts0 | nmuts3 | nmuts12 | npairs0 | npairs3 | npairs12 |
|---|---|---|---|---|---|---|---|---|---|---|
| 2867 | PIK3CA | phosphoinositide-3-kinase, catalytic, alpha polypeptide | 11 | 0 | 14 | 24 | 24 | 14 | 24 | 24 |
| 4425 | ZSCAN5A | zinc finger and SCAN domain containing 5A | 39 | 0 | 12 | 31 | 61 | 12 | 31 | 61 |
| 2636 | OR1S2 | olfactory receptor, family 1, subfamily S, member 2 | 33 | 0 | 11 | 27 | 39 | 11 | 27 | 39 |
| 2635 | OR1S1 | olfactory receptor, family 1, subfamily S, member 1 | 32 | 0 | 11 | 21 | 45 | 11 | 21 | 45 |
| 2205 | MAGEA12 | melanoma antigen family A, 12 | 29 | 0 | 10 | 26 | 44 | 10 | 26 | 44 |
| 3051 | PRSS48 | protease, serine, 48 | 16 | 0 | 6 | 22 | 54 | 6 | 22 | 54 |
| 2625 | OR10G8 | olfactory receptor, family 10, subfamily G, member 8 | 18 | 0 | 5 | 5 | 13 | 5 | 5 | 13 |
| 1781 | IFITM2 | interferon induced transmembrane protein 2 (1-8D) | 9 | 0 | 3 | 3 | 5 | 3 | 3 | 5 |
| 2240 | MAPK1 | mitogen-activated protein kinase 1 | 3 | 0 | 3 | 3 | 3 | 3 | 3 | 3 |
| 4426 | ZSCAN5B | zinc finger and SCAN domain containing 5B | 16 | 0 | 2 | 9 | 13 | 2 | 9 | 13 |
Note:
n - number of mutations in this gene in the individual set.
mindist - distance (in aa) between closest pair of mutations in this gene
npairs3 - how many pairs of mutations are within 3 aa of each other.
npairs12 - how many pairs of mutations are within 12 aa of each other.
Table 6. Get Full Table A Ranked List of Significantly Mutated Genesets. (Source: MSigDB GSEA Cannonical Pathway Set).Number of significant genesets found: 0. Number of genesets displayed: 10
| rank | geneset | description | genes | N_genes | mut_tally | N | n | npat | nsite | nsil | n1 | n2 | n3 | n4 | n5 | n6 | p_ns_s | p | q |
|---|---|---|---|---|---|---|---|---|---|---|---|---|---|---|---|---|---|---|---|
| 1 | PAR1PATHWAY | Activated extracellular thrombin cleaves and activates the G-protein coupled receptors PAR1 and PAR4, which activate platelets. | ADCY1, ARHA, ARHGEF1, F2, F2R, F2RL3, GNA12, GNA13, GNAI1, GNAQ, GNB1, GNGT1, MAP3K7, PIK3CA, PIK3R1, PLCB1, PPP1R12B, PRKCA, PRKCB1, PTK2B, ROCK1 | 19 | ADCY1(1), ARHGEF1(1), F2R(1), F2RL3(2), GNA13(1), PIK3CA(11), PIK3R1(1), PPP1R12B(1), PRKCA(1), ROCK1(3) | 1478575 | 23 | 13 | 16 | 1 | 16 | 3 | 1 | 2 | 0 | 1 | 0.011 | 0.00052 | 0.15 |
| 2 | ACHPATHWAY | Nicotinic acetylcholine receptors are ligand-gated ion channels that primarily mediate neuromuscular signaling and may inhibit neuronal apoptosis via the AKT pathway. | AKT1, BAD, CHRNB1, CHRNG, FOXO3A, MUSK, PIK3CA, PIK3R1, PTK2, PTK2B, RAPSN, SRC, TERT, TNFSF6, YWHAH | 13 | CHRNG(1), MUSK(1), PIK3CA(11), PIK3R1(1), PTK2(1) | 935251 | 15 | 11 | 8 | 1 | 11 | 0 | 1 | 2 | 1 | 0 | 0.053 | 0.00053 | 0.15 |
| 3 | ERK5PATHWAY | Signaling between a tissue and its innervating axon stimulates retrograde transport via Trk receptors, which activate Erk5, which induces transcription of anti-apoptotic factors. | AKT1, CREB1, GRB2, HRAS, MAPK1, MAPK3, MAPK7, MEF2A, MEF2B, MEF2C, MEF2D, NTRK1, PIK3CA, PIK3R1, PLCG1, RPS6KA1, SHC1 | 17 | MAPK1(3), MAPK7(1), MEF2C(1), PIK3CA(11), PIK3R1(1), RPS6KA1(2) | 1088110 | 19 | 11 | 10 | 1 | 14 | 1 | 0 | 3 | 1 | 0 | 0.03 | 0.00085 | 0.15 |
| 4 | GCRPATHWAY | Corticosteroids activate the glucocorticoid receptor (GR), which inhibits NF-kB and activates Annexin-1, thus inhibiting the inflammatory response. | ADRB2, AKT1, ANXA1, CALM1, CALM2, CALM3, CRN, GNAS, GNB1, GNGT1, HSPCA, NFKB1, NOS3, NPPA, NR3C1, PIK3CA, PIK3R1, RELA, SYT1 | 17 | CALM1(1), CALM3(1), NPPA(1), PIK3CA(11), PIK3R1(1), SYT1(1) | 1019231 | 16 | 11 | 9 | 0 | 12 | 1 | 1 | 2 | 0 | 0 | 0.018 | 0.00096 | 0.15 |
| 5 | CTLA4PATHWAY | T cell activation requires interaction with an antigen-MHC-I complex on an antigen-presenting cell (APC), as well as CD28 interaction with the APC's CD80 or 86. | CD28, CD3D, CD3E, CD3G, CD3Z, CD80, CD86, CTLA4, GRB2, HLA-DRA, HLA-DRB1, ICOS, ICOSL, IL2, ITK, LCK, PIK3CA, PIK3R1, PTPN11, TRA@, TRB@ | 17 | CD86(1), ITK(1), PIK3CA(11), PIK3R1(1), PTPN11(1) | 739491 | 15 | 9 | 8 | 0 | 12 | 1 | 0 | 2 | 0 | 0 | 0.018 | 0.0017 | 0.18 |
| 6 | PTENPATHWAY | PTEN suppresses AKT-induced cell proliferation and antagonizes the action of PI3K. | AKT1, BCAR1, CDKN1B, FOXO3A, GRB2, ILK, ITGB1, MAPK1, MAPK3, PDK2, PDPK1, PIK3CA, PIK3R1, PTEN, PTK2, SHC1, SOS1, TNFSF6 | 16 | MAPK1(3), PIK3CA(11), PIK3R1(1), PTEN(3), PTK2(1), SOS1(1) | 1108069 | 20 | 11 | 11 | 0 | 15 | 0 | 0 | 2 | 3 | 0 | 0.0079 | 0.0019 | 0.18 |
| 7 | ST_TYPE_I_INTERFERON_PATHWAY | Type I interferon is an antiviral cytokine that induces a JAK-STAT type pathway leading to ISGF3 activation and a cellular antiviral response. | IFNAR1, IFNB1, ISGF3G, JAK1, PTPRU, REG1A, STAT1, STAT2, TYK2 | 8 | IFNAR1(2), PTPRU(1), REG1A(1), STAT1(3), TYK2(3) | 723179 | 10 | 10 | 10 | 1 | 7 | 3 | 0 | 0 | 0 | 0 | 0.12 | 0.002 | 0.18 |
| 8 | IFNGPATHWAY | IFN gamma signaling pathway | IFNG, IFNGR1, IFNGR2, JAK1, JAK2, STAT1 | 6 | IFNGR1(2), IFNGR2(2), JAK2(1), STAT1(3) | 473117 | 8 | 7 | 8 | 1 | 4 | 1 | 0 | 0 | 3 | 0 | 0.48 | 0.0026 | 0.2 |
| 9 | ARFPATHWAY | Cyclin-dependent kinase inhibitor 2A is a tumor suppressor that induces G1 arrest and can activate the p53 pathway, leading to G2/M arrest. | ABL1, CDKN2A, E2F1, MDM2, MYC, PIK3CA, PIK3R1, POLR1A, POLR1B, POLR1C, POLR1D, RAC1, RB1, TBX2, TP53, TWIST1 | 16 | ABL1(1), PIK3CA(11), PIK3R1(1), POLR1A(2), POLR1C(2), TP53(2) | 1168503 | 19 | 14 | 12 | 2 | 13 | 0 | 0 | 4 | 2 | 0 | 0.13 | 0.0034 | 0.21 |
| 10 | PLCPATHWAY | Phospholipase C hydrolyzes the membrane lipid PIP2 to DAG, which activates protein kinase C, and IP3, which causes calcium influx. | AKT1, PIK3CA, PIK3R1, PLCB1, PLCG1, PRKCA, PRKCB1, VAV1 | 7 | PIK3CA(11), PIK3R1(1), PRKCA(1) | 739813 | 13 | 9 | 6 | 1 | 11 | 0 | 0 | 2 | 0 | 0 | 0.13 | 0.0034 | 0.21 |
Table 7. Get Full Table A Ranked List of Significantly Mutated Genesets (Excluding Significantly Mutated Genes). Number of significant genesets found: 0. Number of genesets displayed: 10
| rank | geneset | description | genes | N_genes | mut_tally | N | n | npat | nsite | nsil | n1 | n2 | n3 | n4 | n5 | n6 | p_ns_s | p | q |
|---|---|---|---|---|---|---|---|---|---|---|---|---|---|---|---|---|---|---|---|
| 1 | ST_TYPE_I_INTERFERON_PATHWAY | Type I interferon is an antiviral cytokine that induces a JAK-STAT type pathway leading to ISGF3 activation and a cellular antiviral response. | IFNAR1, IFNB1, ISGF3G, JAK1, PTPRU, REG1A, STAT1, STAT2, TYK2 | 8 | IFNAR1(2), PTPRU(1), REG1A(1), STAT1(3), TYK2(3) | 723179 | 10 | 10 | 10 | 1 | 7 | 3 | 0 | 0 | 0 | 0 | 0.12 | 0.002 | 0.79 |
| 2 | IFNGPATHWAY | IFN gamma signaling pathway | IFNG, IFNGR1, IFNGR2, JAK1, JAK2, STAT1 | 6 | IFNGR1(2), IFNGR2(2), JAK2(1), STAT1(3) | 473117 | 8 | 7 | 8 | 1 | 4 | 1 | 0 | 0 | 3 | 0 | 0.48 | 0.0026 | 0.79 |
| 3 | IFNAPATHWAY | Interferon alpha, active in the immune response, binds to the IFN receptor and activates Jak1 and Tyk2, which phosphorylate Stat1 and Stat2. | IFNA1, IFNAR1, IFNAR2, IFNB1, ISGF3G, JAK1, STAT1, STAT2, TYK2 | 8 | IFNA1(1), IFNAR1(2), IFNAR2(1), STAT1(3), TYK2(3) | 627650 | 10 | 9 | 10 | 1 | 9 | 1 | 0 | 0 | 0 | 0 | 0.14 | 0.011 | 1 |
| 4 | FIBRINOLYSISPATHWAY | Thrombin cleavage of fibrinogen results in rapid formation of fibrin threads that form a mesh to capture platelets and other blood cells into a clot. | CPB2, F13A1, F2, F2R, FGA, FGB, FGG, PLAT, PLAU, PLG, SERPINB2, SERPINE1 | 12 | CPB2(2), F2R(1), FGA(1), PLAU(1), PLG(2) | 774038 | 7 | 7 | 7 | 1 | 3 | 1 | 1 | 2 | 0 | 0 | 0.43 | 0.02 | 1 |
| 5 | ST_INTERFERON_GAMMA_PATHWAY | The interferon gamma pathway resembles the JAK-STAT pathway and activates STAT transcription factors. | CISH, IFNG, IFNGR1, JAK1, JAK2, PLA2G2A, PTPRU, REG1A, STAT1, STATIP1 | 9 | IFNGR1(2), JAK2(1), PTPRU(1), REG1A(1), STAT1(3) | 661911 | 8 | 7 | 8 | 1 | 4 | 3 | 0 | 0 | 1 | 0 | 0.27 | 0.021 | 1 |
| 6 | MSPPATHWAY | Macrophage stimulating protein is synthesized as pro-MSP by the liver and, on proteolysis, binds to monocyte receptor kinase RON to induce macrophage development. | CCL2, CSF1, IL1B, MST1, MST1R, TNF | 6 | MST1(1), MST1R(3) | 376583 | 4 | 4 | 4 | 0 | 2 | 2 | 0 | 0 | 0 | 0 | 0.25 | 0.03 | 1 |
| 7 | NKTPATHWAY | T cell differentiation into Th1 and Th2 cells occurs by differential chemokine receptor expression, which mediates tissue localization and immune response. | CCL3, CCL4, CCR1, CCR2, CCR3, CCR4, CCR5, CCR7, CD28, CD4, CSF2, CXCR3, CXCR4, IFNG, IFNGR1, IFNGR2, IL12A, IL12B, IL12RB1, IL12RB2, IL18R1, IL2, IL4, IL4R, IL5, TGFB1, TGFB2, TGFB3, TNFSF5 | 28 | CCL4(1), CCR7(1), IFNGR1(2), IFNGR2(2), IL12B(1), IL12RB1(1), TGFB3(2) | 1166496 | 10 | 9 | 10 | 1 | 5 | 0 | 1 | 0 | 4 | 0 | 0.2 | 0.032 | 1 |
| 8 | HSA00130_UBIQUINONE_BIOSYNTHESIS | Genes involved in ubiquinone biosynthesis | COQ2, COQ3, COQ5, COQ6, COQ7, ND1, ND2, ND3, ND4, ND4L, ND5, ND6, NDUFA12, NDUFA13, NDUFB11 | 8 | COQ3(1), COQ5(1), COQ6(1) | 232317 | 3 | 3 | 3 | 0 | 2 | 1 | 0 | 0 | 0 | 0 | 0.44 | 0.037 | 1 |
| 9 | PLK3PATHWAY | Active Plk3 phosphorylates CDC25c, blocking the G2/M transition, and phosphorylates p53 to induce apoptosis. | ATM, ATR, CDC25C, CHEK1, CHEK2, CNK, TP53, YWHAH | 7 | ATM(2), ATR(2), CHEK2(2), TP53(2) | 923540 | 8 | 8 | 7 | 0 | 4 | 0 | 0 | 3 | 1 | 0 | 0.16 | 0.038 | 1 |
| 10 | TERTPATHWAY | hTERC, the RNA subunit of telomerase, and hTERT, the catalytic protein subunit, are required for telomerase activity and are overexpressed in many cancers. | HDAC1, MAX, MYC, SP1, SP3, TP53, WT1, ZNF42 | 7 | MAX(1), SP3(1), TP53(2) | 407974 | 4 | 4 | 4 | 0 | 2 | 1 | 0 | 0 | 1 | 0 | 0.33 | 0.04 | 1 |
In brief, we tabulate the number of mutations and the number of covered bases for each gene. The counts are broken down by mutation context category: four context categories that are discovered by MutSig, and one for indel and 'null' mutations, which include indels, nonsense mutations, splice-site mutations, and non-stop (read-through) mutations. For each gene, we calculate the probability of seeing the observed constellation of mutations, i.e. the product P1 x P2 x ... x Pm, or a more extreme one, given the background mutation rates calculated across the dataset. [1]
In addition to the links below, the full results of the analysis summarized in this report can also be downloaded programmatically using firehose_get, or interactively from either the Broad GDAC website or TCGA Data Coordination Center Portal.