This pipeline computes the correlation between significantly recurrent gene mutations and selected clinical features.
Testing the association between mutation status of 16 genes and 10 clinical features across 154 patients, 6 significant findings detected with Q value < 0.25.
-
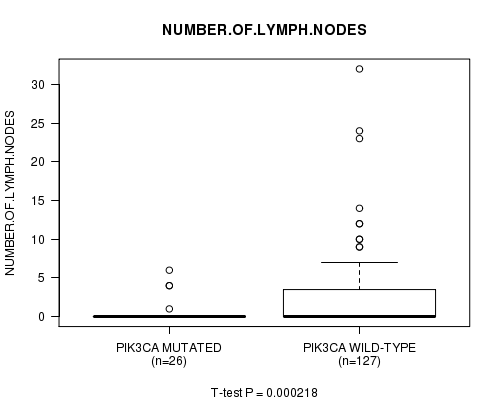
PIK3CA mutation correlated to 'NUMBER.OF.LYMPH.NODES'.
-
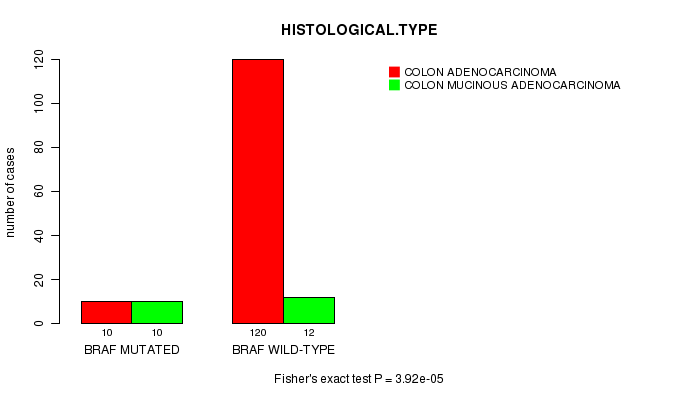
BRAF mutation correlated to 'HISTOLOGICAL.TYPE'.
-
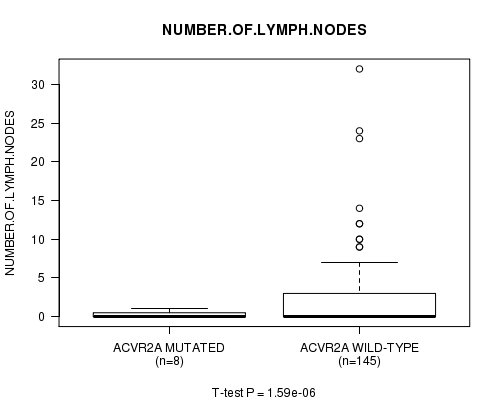
ACVR2A mutation correlated to 'NUMBER.OF.LYMPH.NODES'.
-
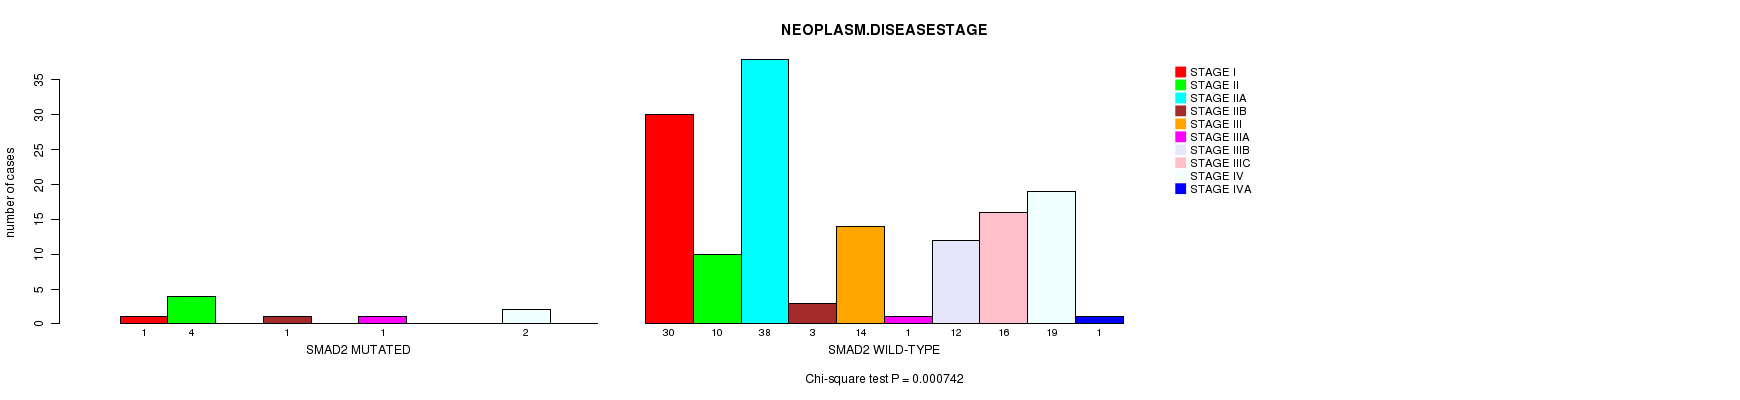
SMAD2 mutation correlated to 'NEOPLASM.DISEASESTAGE'.
-
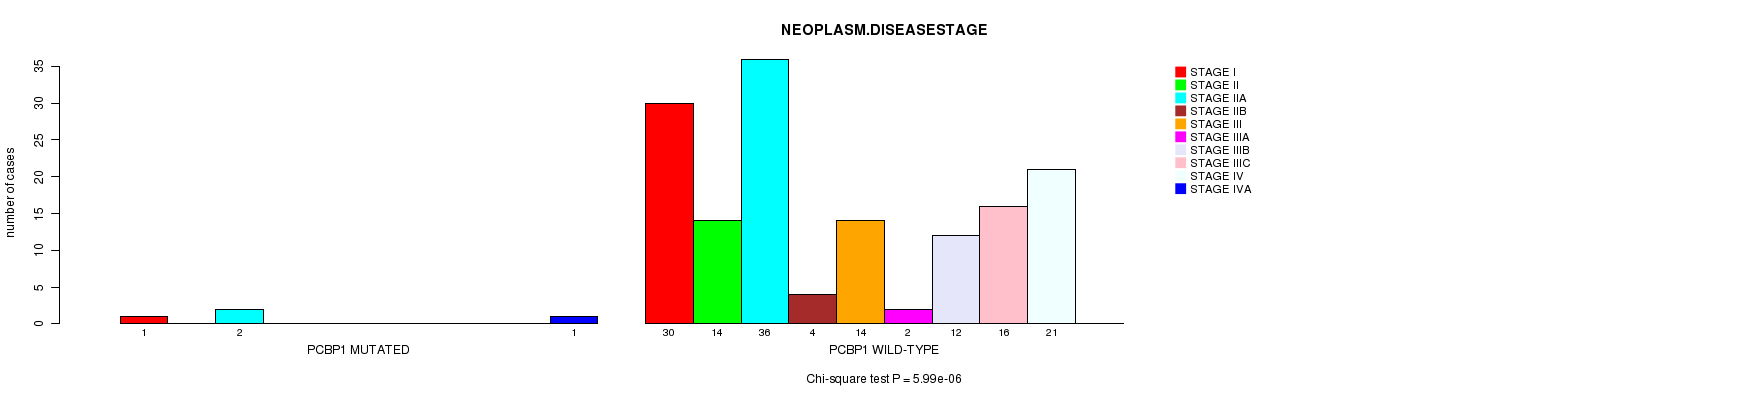
PCBP1 mutation correlated to 'NEOPLASM.DISEASESTAGE'.
-
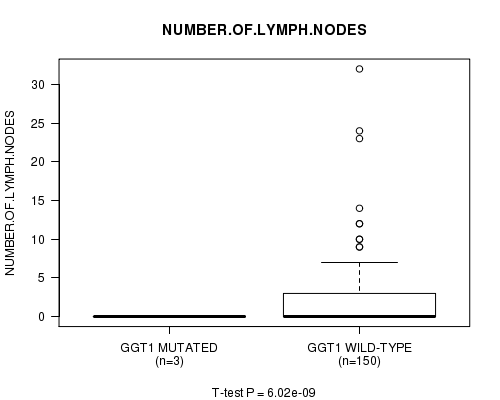
GGT1 mutation correlated to 'NUMBER.OF.LYMPH.NODES'.
Table 1. Get Full Table Overview of the association between mutation status of 16 genes and 10 clinical features. Shown in the table are P values (Q values). Thresholded by Q value < 0.25, 6 significant findings detected.
|
Clinical Features |
Time to Death |
AGE |
NEOPLASM DISEASESTAGE |
PATHOLOGY T STAGE |
PATHOLOGY N STAGE |
PATHOLOGY M STAGE |
GENDER |
HISTOLOGICAL TYPE |
COMPLETENESS OF RESECTION |
NUMBER OF LYMPH NODES |
||
| nMutated (%) | nWild-Type | logrank test | t-test | Chi-square test | Fisher's exact test | Fisher's exact test | Fisher's exact test | Fisher's exact test | Fisher's exact test | Fisher's exact test | t-test | |
| PIK3CA | 26 (17%) | 128 |
0.834 (1.00) |
0.227 (1.00) |
0.0285 (1.00) |
0.566 (1.00) |
0.0103 (1.00) |
0.333 (1.00) |
0.83 (1.00) |
0.217 (1.00) |
0.446 (1.00) |
0.000218 (0.0329) |
| BRAF | 20 (13%) | 134 |
0.552 (1.00) |
0.0297 (1.00) |
0.13 (1.00) |
0.0621 (1.00) |
0.798 (1.00) |
0.401 (1.00) |
0.0915 (1.00) |
3.92e-05 (0.00596) |
0.59 (1.00) |
0.808 (1.00) |
| ACVR2A | 8 (5%) | 146 |
0.188 (1.00) |
0.679 (1.00) |
0.495 (1.00) |
0.891 (1.00) |
0.369 (1.00) |
1 (1.00) |
0.0632 (1.00) |
1 (1.00) |
1 (1.00) |
1.59e-06 (0.000245) |
| SMAD2 | 10 (6%) | 144 |
0.723 (1.00) |
0.767 (1.00) |
0.000742 (0.111) |
0.412 (1.00) |
0.672 (1.00) |
0.636 (1.00) |
0.327 (1.00) |
0.16 (1.00) |
0.407 (1.00) |
0.275 (1.00) |
| PCBP1 | 4 (3%) | 150 |
0.00483 (0.71) |
5.99e-06 (0.000916) |
0.325 (1.00) |
0.641 (1.00) |
0.0347 (1.00) |
1 (1.00) |
1 (1.00) |
1 (1.00) |
0.132 (1.00) |
|
| GGT1 | 3 (2%) | 151 |
0.852 (1.00) |
0.905 (1.00) |
0.712 (1.00) |
0.571 (1.00) |
1 (1.00) |
1 (1.00) |
1 (1.00) |
1 (1.00) |
6.02e-09 (9.33e-07) |
|
| APC | 103 (67%) | 51 |
0.4 (1.00) |
0.467 (1.00) |
0.811 (1.00) |
0.81 (1.00) |
0.891 (1.00) |
0.204 (1.00) |
0.0394 (1.00) |
0.809 (1.00) |
0.0372 (1.00) |
0.603 (1.00) |
| KRAS | 58 (38%) | 96 |
0.347 (1.00) |
0.00444 (0.662) |
0.68 (1.00) |
0.975 (1.00) |
0.416 (1.00) |
0.317 (1.00) |
0.244 (1.00) |
0.813 (1.00) |
0.316 (1.00) |
0.383 (1.00) |
| TP53 | 74 (48%) | 80 |
0.718 (1.00) |
0.101 (1.00) |
0.144 (1.00) |
0.649 (1.00) |
0.223 (1.00) |
0.558 (1.00) |
0.42 (1.00) |
0.00469 (0.695) |
0.756 (1.00) |
0.113 (1.00) |
| FBXW7 | 29 (19%) | 125 |
0.913 (1.00) |
0.0428 (1.00) |
0.046 (1.00) |
0.106 (1.00) |
0.605 (1.00) |
0.0169 (1.00) |
0.216 (1.00) |
0.0151 (1.00) |
0.0805 (1.00) |
0.754 (1.00) |
| NRAS | 15 (10%) | 139 |
0.53 (1.00) |
0.151 (1.00) |
0.483 (1.00) |
0.524 (1.00) |
0.0775 (1.00) |
0.496 (1.00) |
0.0268 (1.00) |
1 (1.00) |
0.278 (1.00) |
0.128 (1.00) |
| SMAD4 | 18 (12%) | 136 |
0.983 (1.00) |
0.876 (1.00) |
0.95 (1.00) |
0.912 (1.00) |
0.834 (1.00) |
1 (1.00) |
0.803 (1.00) |
0.299 (1.00) |
0.773 (1.00) |
0.404 (1.00) |
| FAM123B | 19 (12%) | 135 |
0.858 (1.00) |
0.567 (1.00) |
0.796 (1.00) |
0.755 (1.00) |
0.254 (1.00) |
1 (1.00) |
1 (1.00) |
0.74 (1.00) |
1 (1.00) |
0.665 (1.00) |
| SOX9 | 9 (6%) | 145 |
0.292 (1.00) |
0.138 (1.00) |
0.22 (1.00) |
0.899 (1.00) |
1 (1.00) |
1 (1.00) |
1 (1.00) |
1 (1.00) |
0.326 (1.00) |
|
| TNFRSF10C | 6 (4%) | 148 |
0.954 (1.00) |
0.334 (1.00) |
0.104 (1.00) |
0.246 (1.00) |
0.0736 (1.00) |
0.681 (1.00) |
0.594 (1.00) |
0.106 (1.00) |
0.178 (1.00) |
|
| ACOT4 | 3 (2%) | 151 |
0.0307 (1.00) |
0.982 (1.00) |
0.035 (1.00) |
1 (1.00) |
0.377 (1.00) |
1 (1.00) |
0.377 (1.00) |
0.368 (1.00) |
0.649 (1.00) |
P value = 0.000218 (t-test), Q value = 0.033
Table S1. Gene #2: 'PIK3CA MUTATION STATUS' versus Clinical Feature #10: 'NUMBER.OF.LYMPH.NODES'
| nPatients | Mean (Std.Dev) | |
|---|---|---|
| ALL | 153 | 2.2 (4.5) |
| PIK3CA MUTATED | 26 | 0.6 (1.6) |
| PIK3CA WILD-TYPE | 127 | 2.6 (4.8) |
Figure S1. Get High-res Image Gene #2: 'PIK3CA MUTATION STATUS' versus Clinical Feature #10: 'NUMBER.OF.LYMPH.NODES'
P value = 3.92e-05 (Fisher's exact test), Q value = 0.006
Table S2. Gene #3: 'BRAF MUTATION STATUS' versus Clinical Feature #8: 'HISTOLOGICAL.TYPE'
| nPatients | COLON ADENOCARCINOMA | COLON MUCINOUS ADENOCARCINOMA |
|---|---|---|
| ALL | 130 | 22 |
| BRAF MUTATED | 10 | 10 |
| BRAF WILD-TYPE | 120 | 12 |
Figure S2. Get High-res Image Gene #3: 'BRAF MUTATION STATUS' versus Clinical Feature #8: 'HISTOLOGICAL.TYPE'
P value = 1.59e-06 (t-test), Q value = 0.00024
Table S3. Gene #11: 'ACVR2A MUTATION STATUS' versus Clinical Feature #10: 'NUMBER.OF.LYMPH.NODES'
| nPatients | Mean (Std.Dev) | |
|---|---|---|
| ALL | 153 | 2.2 (4.5) |
| ACVR2A MUTATED | 8 | 0.2 (0.5) |
| ACVR2A WILD-TYPE | 145 | 2.3 (4.6) |
Figure S3. Get High-res Image Gene #11: 'ACVR2A MUTATION STATUS' versus Clinical Feature #10: 'NUMBER.OF.LYMPH.NODES'
P value = 0.000742 (Chi-square test), Q value = 0.11
Table S4. Gene #14: 'SMAD2 MUTATION STATUS' versus Clinical Feature #3: 'NEOPLASM.DISEASESTAGE'
| nPatients | STAGE I | STAGE II | STAGE IIA | STAGE IIB | STAGE III | STAGE IIIA | STAGE IIIB | STAGE IIIC | STAGE IV | STAGE IVA |
|---|---|---|---|---|---|---|---|---|---|---|
| ALL | 31 | 14 | 38 | 4 | 14 | 2 | 12 | 16 | 21 | 1 |
| SMAD2 MUTATED | 1 | 4 | 0 | 1 | 0 | 1 | 0 | 0 | 2 | 0 |
| SMAD2 WILD-TYPE | 30 | 10 | 38 | 3 | 14 | 1 | 12 | 16 | 19 | 1 |
Figure S4. Get High-res Image Gene #14: 'SMAD2 MUTATION STATUS' versus Clinical Feature #3: 'NEOPLASM.DISEASESTAGE'
P value = 5.99e-06 (Chi-square test), Q value = 0.00092
Table S5. Gene #15: 'PCBP1 MUTATION STATUS' versus Clinical Feature #3: 'NEOPLASM.DISEASESTAGE'
| nPatients | STAGE I | STAGE II | STAGE IIA | STAGE IIB | STAGE III | STAGE IIIA | STAGE IIIB | STAGE IIIC | STAGE IV | STAGE IVA |
|---|---|---|---|---|---|---|---|---|---|---|
| ALL | 31 | 14 | 38 | 4 | 14 | 2 | 12 | 16 | 21 | 1 |
| PCBP1 MUTATED | 1 | 0 | 2 | 0 | 0 | 0 | 0 | 0 | 0 | 1 |
| PCBP1 WILD-TYPE | 30 | 14 | 36 | 4 | 14 | 2 | 12 | 16 | 21 | 0 |
Figure S5. Get High-res Image Gene #15: 'PCBP1 MUTATION STATUS' versus Clinical Feature #3: 'NEOPLASM.DISEASESTAGE'
P value = 6.02e-09 (t-test), Q value = 9.3e-07
Table S6. Gene #16: 'GGT1 MUTATION STATUS' versus Clinical Feature #10: 'NUMBER.OF.LYMPH.NODES'
| nPatients | Mean (Std.Dev) | |
|---|---|---|
| ALL | 153 | 2.2 (4.5) |
| GGT1 MUTATED | 3 | 0.0 (0.0) |
| GGT1 WILD-TYPE | 150 | 2.3 (4.5) |
Figure S6. Get High-res Image Gene #16: 'GGT1 MUTATION STATUS' versus Clinical Feature #10: 'NUMBER.OF.LYMPH.NODES'
-
Mutation data file = COAD-TP.mutsig.cluster.txt
-
Clinical data file = COAD-TP.clin.merged.picked.txt
-
Number of patients = 154
-
Number of significantly mutated genes = 16
-
Number of selected clinical features = 10
-
Exclude genes that fewer than K tumors have mutations, K = 3
For survival clinical features, the Kaplan-Meier survival curves of tumors with and without gene mutations were plotted and the statistical significance P values were estimated by logrank test (Bland and Altman 2004) using the 'survdiff' function in R
For continuous numerical clinical features, two-tailed Student's t test with unequal variance (Lehmann and Romano 2005) was applied to compare the clinical values between tumors with and without gene mutations using 't.test' function in R
For multi-class clinical features (nominal or ordinal), Chi-square tests (Greenwood and Nikulin 1996) were used to estimate the P values using the 'chisq.test' function in R
For binary or multi-class clinical features (nominal or ordinal), two-tailed Fisher's exact tests (Fisher 1922) were used to estimate the P values using the 'fisher.test' function in R
For multiple hypothesis correction, Q value is the False Discovery Rate (FDR) analogue of the P value (Benjamini and Hochberg 1995), defined as the minimum FDR at which the test may be called significant. We used the 'Benjamini and Hochberg' method of 'p.adjust' function in R to convert P values into Q values.
In addition to the links below, the full results of the analysis summarized in this report can also be downloaded programmatically using firehose_get, or interactively from either the Broad GDAC website or TCGA Data Coordination Center Portal.