This pipeline computes the correlation between significant copy number variation (cnv focal) genes and selected clinical features.
Testing the association between copy number variation 70 focal events and 6 clinical features across 553 patients, 17 significant findings detected with Q value < 0.25.
-
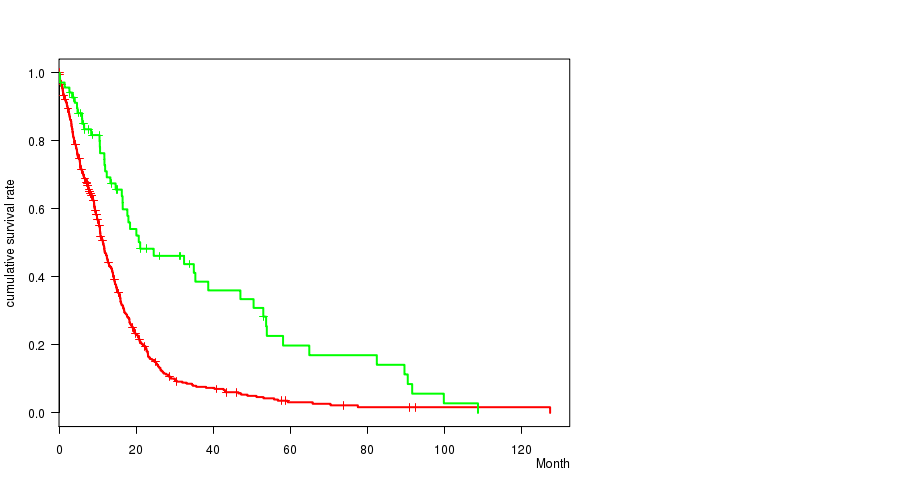
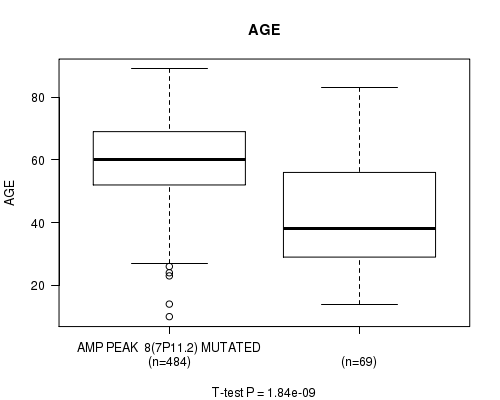
AMP PEAK 8(7P11.2) MUTATION ANALYSIS cnv correlated to 'Time to Death' and 'AGE'.
-
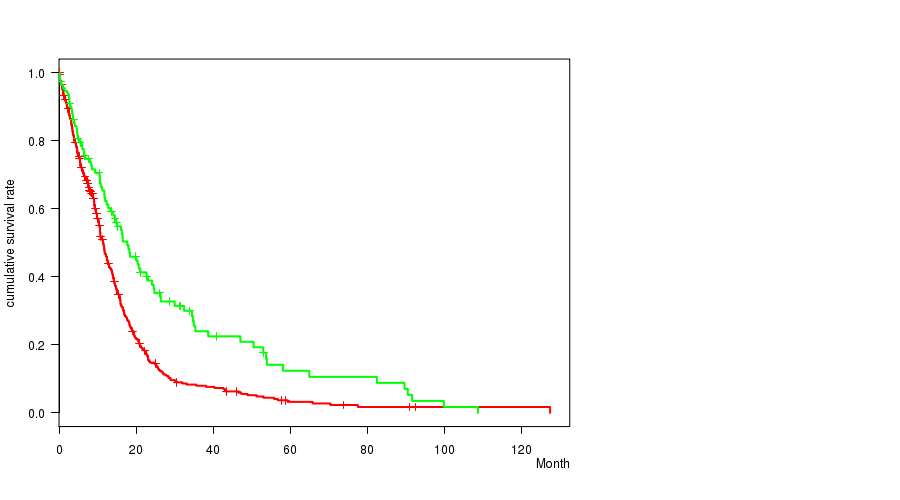
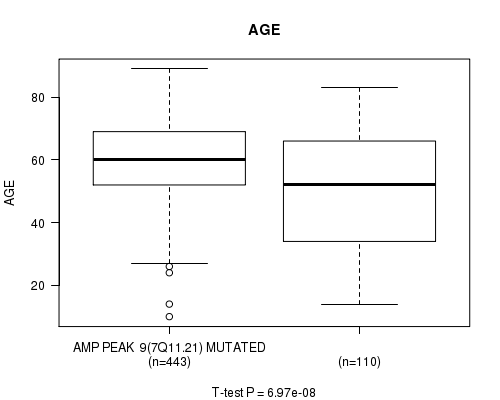
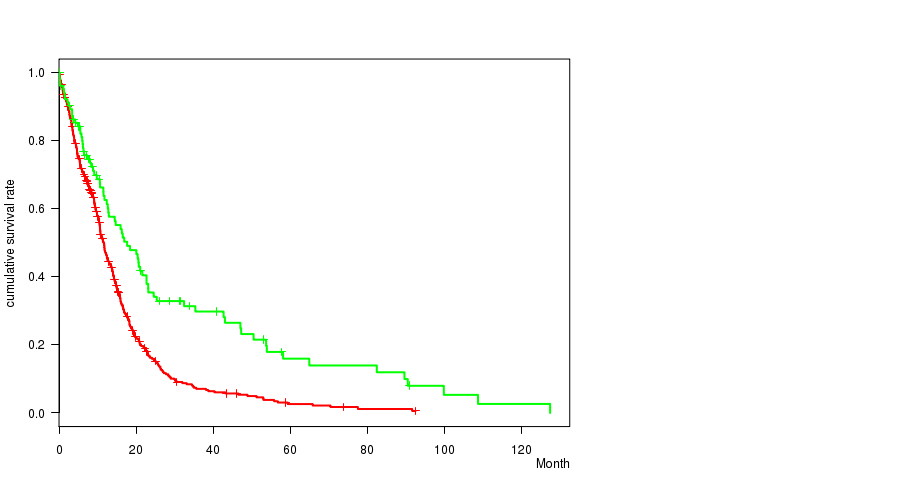
AMP PEAK 9(7Q11.21) MUTATION ANALYSIS cnv correlated to 'Time to Death' and 'AGE'.
-
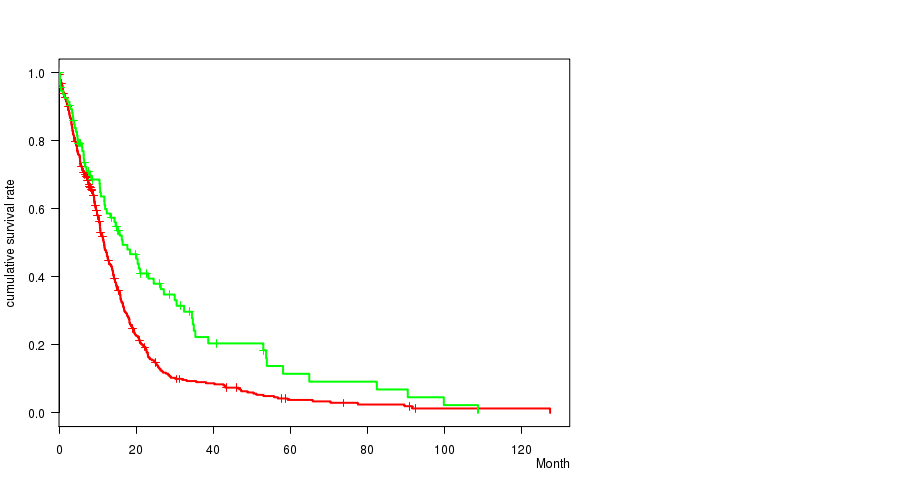
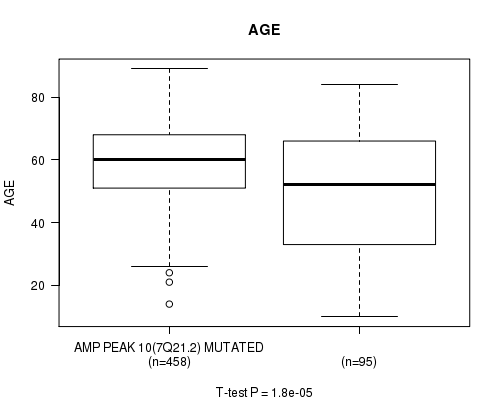
AMP PEAK 10(7Q21.2) MUTATION ANALYSIS cnv correlated to 'Time to Death' and 'AGE'.
-
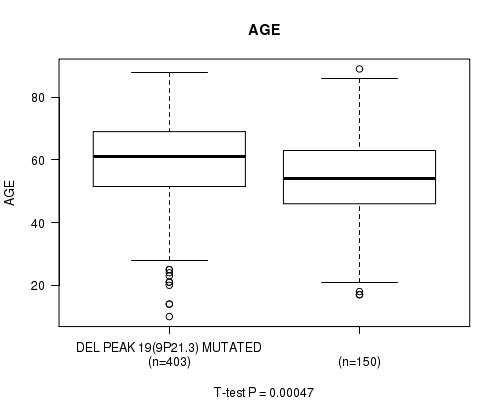
DEL PEAK 19(9P21.3) MUTATION ANALYSIS cnv correlated to 'AGE'.
-
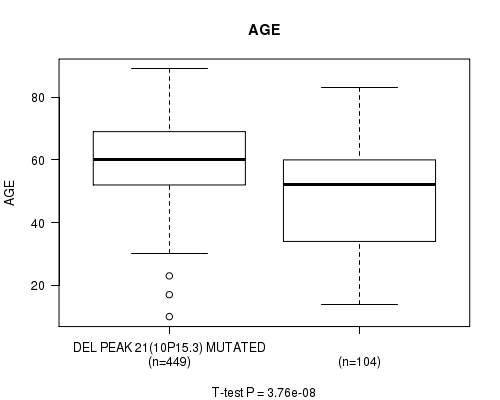
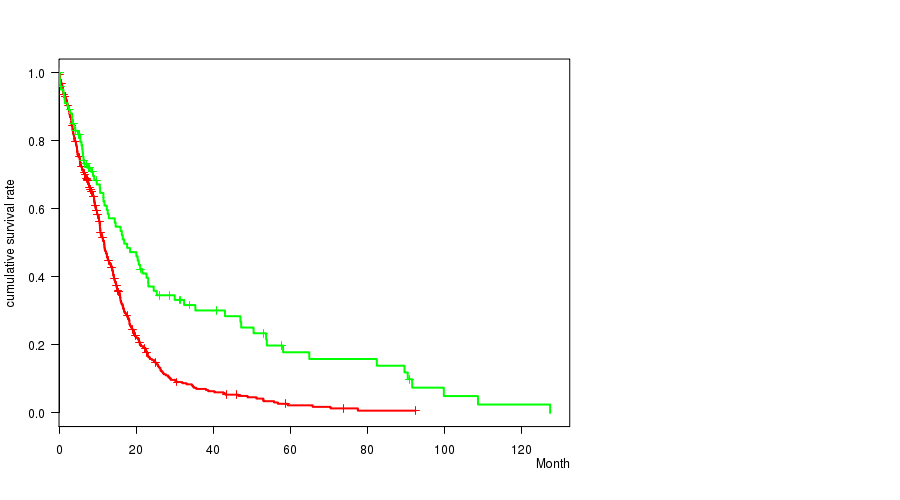
DEL PEAK 21(10P15.3) MUTATION ANALYSIS cnv correlated to 'Time to Death' and 'AGE'.
-
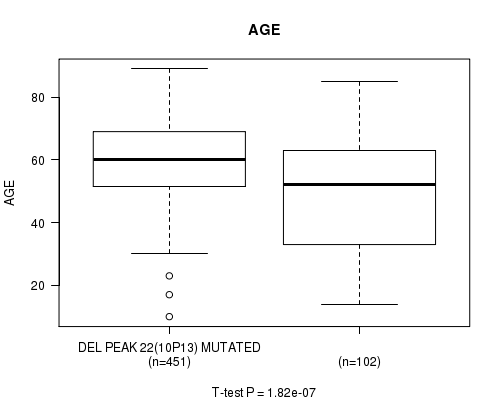
DEL PEAK 22(10P13) MUTATION ANALYSIS cnv correlated to 'Time to Death' and 'AGE'.
-
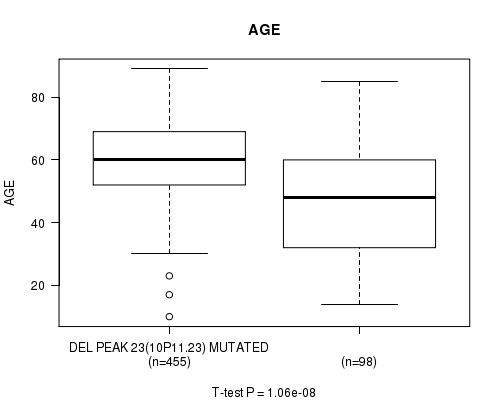
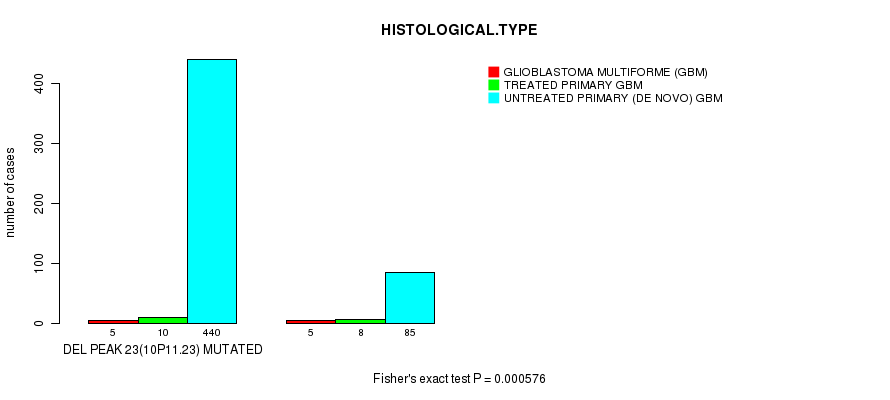
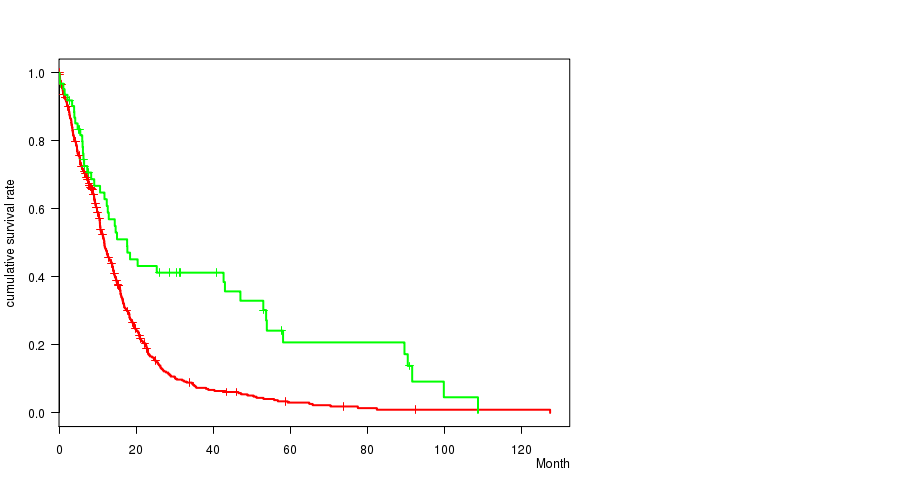
DEL PEAK 23(10P11.23) MUTATION ANALYSIS cnv correlated to 'Time to Death', 'AGE', and 'HISTOLOGICAL.TYPE'.
-
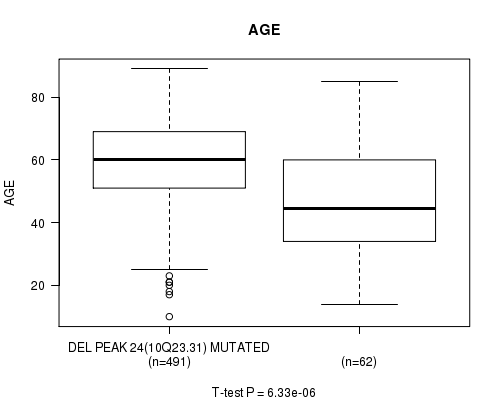
DEL PEAK 24(10Q23.31) MUTATION ANALYSIS cnv correlated to 'Time to Death' and 'AGE'.
-
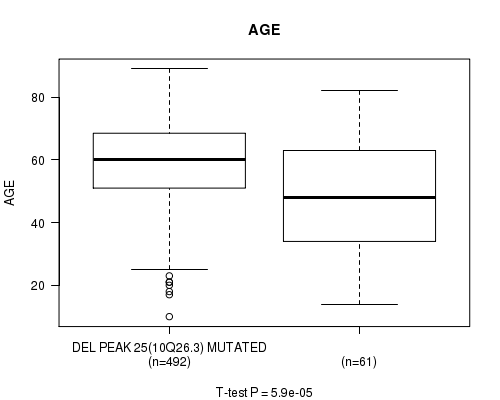
DEL PEAK 25(10Q26.3) MUTATION ANALYSIS cnv correlated to 'AGE'.
Table 1. Get Full Table Overview of the association between significant copy number variation of 70 focal events and 6 clinical features. Shown in the table are P values (Q values). Thresholded by Q value < 0.25, 17 significant findings detected.
|
Clinical Features |
Time to Death |
AGE | GENDER |
KARNOFSKY PERFORMANCE SCORE |
HISTOLOGICAL TYPE |
RADIATIONS RADIATION REGIMENINDICATION |
||
| nCNV (%) | nWild-Type | logrank test | t-test | Fisher's exact test | t-test | Fisher's exact test | Fisher's exact test | |
| DEL PEAK 23(10P11 23) MUTATION ANALYSIS | 455 (82%) | 98 |
9.13e-08 (3.8e-05) |
1.06e-08 (4.46e-06) |
0.171 (1.00) |
0.244 (1.00) |
0.000576 (0.233) |
0.81 (1.00) |
| AMP PEAK 8(7P11 2) MUTATION ANALYSIS | 484 (88%) | 69 |
2.4e-07 (9.94e-05) |
1.84e-09 (7.74e-07) |
0.511 (1.00) |
0.0373 (1.00) |
0.0246 (1.00) |
0.0943 (1.00) |
| AMP PEAK 9(7Q11 21) MUTATION ANALYSIS | 443 (80%) | 110 |
1.83e-05 (0.00749) |
6.97e-08 (2.91e-05) |
0.328 (1.00) |
0.679 (1.00) |
0.00222 (0.89) |
0.134 (1.00) |
| AMP PEAK 10(7Q21 2) MUTATION ANALYSIS | 458 (83%) | 95 |
0.000339 (0.138) |
1.8e-05 (0.00738) |
0.566 (1.00) |
0.507 (1.00) |
0.0207 (1.00) |
0.223 (1.00) |
| DEL PEAK 21(10P15 3) MUTATION ANALYSIS | 449 (81%) | 104 |
1.91e-06 (0.000788) |
3.76e-08 (1.57e-05) |
0.121 (1.00) |
0.617 (1.00) |
0.00306 (1.00) |
0.64 (1.00) |
| DEL PEAK 22(10P13) MUTATION ANALYSIS | 451 (82%) | 102 |
1.27e-06 (0.000523) |
1.82e-07 (7.54e-05) |
0.0564 (1.00) |
0.86 (1.00) |
0.00228 (0.908) |
0.906 (1.00) |
| DEL PEAK 24(10Q23 31) MUTATION ANALYSIS | 491 (89%) | 62 |
1.08e-05 (0.00443) |
6.33e-06 (0.0026) |
0.681 (1.00) |
0.0789 (1.00) |
0.00239 (0.95) |
1 (1.00) |
| DEL PEAK 19(9P21 3) MUTATION ANALYSIS | 403 (73%) | 150 |
0.0242 (1.00) |
0.00047 (0.19) |
0.435 (1.00) |
0.1 (1.00) |
0.175 (1.00) |
0.535 (1.00) |
| DEL PEAK 25(10Q26 3) MUTATION ANALYSIS | 492 (89%) | 61 |
0.00133 (0.533) |
5.9e-05 (0.024) |
0.582 (1.00) |
0.0647 (1.00) |
0.006 (1.00) |
1 (1.00) |
| AMP PEAK 1(1P36 21) MUTATION ANALYSIS | 87 (16%) | 466 |
0.043 (1.00) |
0.318 (1.00) |
0.283 (1.00) |
0.636 (1.00) |
0.269 (1.00) |
1 (1.00) |
| AMP PEAK 2(1Q32 1) MUTATION ANALYSIS | 149 (27%) | 404 |
0.362 (1.00) |
0.266 (1.00) |
0.695 (1.00) |
0.265 (1.00) |
0.549 (1.00) |
0.756 (1.00) |
| AMP PEAK 3(1Q44) MUTATION ANALYSIS | 94 (17%) | 459 |
0.171 (1.00) |
0.903 (1.00) |
0.297 (1.00) |
0.582 (1.00) |
0.512 (1.00) |
0.903 (1.00) |
| AMP PEAK 4(2P24 3) MUTATION ANALYSIS | 45 (8%) | 508 |
0.212 (1.00) |
0.186 (1.00) |
0.34 (1.00) |
0.594 (1.00) |
0.853 (1.00) |
0.867 (1.00) |
| AMP PEAK 5(3Q26 33) MUTATION ANALYSIS | 105 (19%) | 448 |
0.18 (1.00) |
0.0302 (1.00) |
0.825 (1.00) |
0.711 (1.00) |
0.0205 (1.00) |
0.907 (1.00) |
| AMP PEAK 6(4P16 3) MUTATION ANALYSIS | 45 (8%) | 508 |
0.787 (1.00) |
0.54 (1.00) |
0.525 (1.00) |
0.439 (1.00) |
1 (1.00) |
0.401 (1.00) |
| AMP PEAK 7(4Q12) MUTATION ANALYSIS | 103 (19%) | 450 |
0.508 (1.00) |
0.534 (1.00) |
0.221 (1.00) |
0.615 (1.00) |
0.277 (1.00) |
0.479 (1.00) |
| AMP PEAK 11(7Q31 2) MUTATION ANALYSIS | 450 (81%) | 103 |
0.00598 (1.00) |
0.00115 (0.463) |
0.503 (1.00) |
0.496 (1.00) |
0.0234 (1.00) |
0.124 (1.00) |
| AMP PEAK 12(7Q36 1) MUTATION ANALYSIS | 455 (82%) | 98 |
0.0171 (1.00) |
0.00177 (0.709) |
0.649 (1.00) |
0.753 (1.00) |
0.0143 (1.00) |
0.471 (1.00) |
| AMP PEAK 13(8Q24 21) MUTATION ANALYSIS | 63 (11%) | 490 |
0.47 (1.00) |
0.141 (1.00) |
0.275 (1.00) |
0.788 (1.00) |
0.786 (1.00) |
0.666 (1.00) |
| AMP PEAK 14(11P13) MUTATION ANALYSIS | 25 (5%) | 528 |
0.898 (1.00) |
0.228 (1.00) |
0.406 (1.00) |
0.321 (1.00) |
0.365 (1.00) |
0.828 (1.00) |
| AMP PEAK 15(12P13 32) MUTATION ANALYSIS | 79 (14%) | 474 |
0.885 (1.00) |
0.103 (1.00) |
1 (1.00) |
0.679 (1.00) |
1 (1.00) |
0.793 (1.00) |
| AMP PEAK 16(12Q14 1) MUTATION ANALYSIS | 129 (23%) | 424 |
0.384 (1.00) |
0.565 (1.00) |
0.411 (1.00) |
0.83 (1.00) |
0.934 (1.00) |
1 (1.00) |
| AMP PEAK 17(12Q15) MUTATION ANALYSIS | 89 (16%) | 464 |
0.75 (1.00) |
0.723 (1.00) |
0.346 (1.00) |
0.931 (1.00) |
0.766 (1.00) |
0.263 (1.00) |
| AMP PEAK 18(13Q34) MUTATION ANALYSIS | 30 (5%) | 523 |
0.749 (1.00) |
0.848 (1.00) |
0.339 (1.00) |
0.827 (1.00) |
0.329 (1.00) |
0.688 (1.00) |
| AMP PEAK 19(14Q32 33) MUTATION ANALYSIS | 32 (6%) | 521 |
0.344 (1.00) |
0.0207 (1.00) |
0.582 (1.00) |
0.249 (1.00) |
0.249 (1.00) |
1 (1.00) |
| AMP PEAK 20(17P13 2) MUTATION ANALYSIS | 44 (8%) | 509 |
0.875 (1.00) |
0.565 (1.00) |
0.336 (1.00) |
0.113 (1.00) |
0.848 (1.00) |
0.614 (1.00) |
| AMP PEAK 21(17Q25 1) MUTATION ANALYSIS | 75 (14%) | 478 |
0.03 (1.00) |
0.078 (1.00) |
0.256 (1.00) |
0.855 (1.00) |
1 (1.00) |
0.687 (1.00) |
| AMP PEAK 22(19P13 2) MUTATION ANALYSIS | 234 (42%) | 319 |
0.123 (1.00) |
0.733 (1.00) |
1 (1.00) |
0.47 (1.00) |
0.379 (1.00) |
0.852 (1.00) |
| AMP PEAK 23(19Q12) MUTATION ANALYSIS | 199 (36%) | 354 |
0.361 (1.00) |
0.465 (1.00) |
0.527 (1.00) |
0.962 (1.00) |
0.735 (1.00) |
0.565 (1.00) |
| AMP PEAK 24(21Q21 1) MUTATION ANALYSIS | 64 (12%) | 489 |
0.504 (1.00) |
0.0175 (1.00) |
0.684 (1.00) |
0.564 (1.00) |
0.428 (1.00) |
0.566 (1.00) |
| DEL PEAK 1(1P36 32) MUTATION ANALYSIS | 95 (17%) | 458 |
0.699 (1.00) |
0.818 (1.00) |
0.0645 (1.00) |
0.979 (1.00) |
0.272 (1.00) |
1 (1.00) |
| DEL PEAK 2(1P36 23) MUTATION ANALYSIS | 131 (24%) | 422 |
0.494 (1.00) |
0.0207 (1.00) |
0.0105 (1.00) |
0.203 (1.00) |
0.185 (1.00) |
0.516 (1.00) |
| DEL PEAK 3(1P32 3) MUTATION ANALYSIS | 58 (10%) | 495 |
0.812 (1.00) |
0.0716 (1.00) |
0.201 (1.00) |
0.549 (1.00) |
0.774 (1.00) |
0.073 (1.00) |
| DEL PEAK 4(1P22 1) MUTATION ANALYSIS | 46 (8%) | 507 |
0.447 (1.00) |
0.322 (1.00) |
1 (1.00) |
0.595 (1.00) |
0.0948 (1.00) |
0.742 (1.00) |
| DEL PEAK 5(1Q42 11) MUTATION ANALYSIS | 45 (8%) | 508 |
0.0641 (1.00) |
0.0611 (1.00) |
1 (1.00) |
0.00983 (1.00) |
1 (1.00) |
0.18 (1.00) |
| DEL PEAK 6(1Q44) MUTATION ANALYSIS | 31 (6%) | 522 |
0.398 (1.00) |
0.287 (1.00) |
0.85 (1.00) |
0.0652 (1.00) |
1 (1.00) |
0.844 (1.00) |
| DEL PEAK 7(2Q22 1) MUTATION ANALYSIS | 44 (8%) | 509 |
0.445 (1.00) |
0.244 (1.00) |
0.262 (1.00) |
0.673 (1.00) |
0.599 (1.00) |
0.0878 (1.00) |
| DEL PEAK 8(2Q37 1) MUTATION ANALYSIS | 56 (10%) | 497 |
0.766 (1.00) |
0.227 (1.00) |
0.194 (1.00) |
0.672 (1.00) |
1 (1.00) |
0.286 (1.00) |
| DEL PEAK 9(3P21 1) MUTATION ANALYSIS | 52 (9%) | 501 |
0.0252 (1.00) |
0.012 (1.00) |
0.883 (1.00) |
0.714 (1.00) |
0.419 (1.00) |
0.0593 (1.00) |
| DEL PEAK 10(3Q13 31) MUTATION ANALYSIS | 55 (10%) | 498 |
0.447 (1.00) |
0.0636 (1.00) |
0.383 (1.00) |
0.316 (1.00) |
0.665 (1.00) |
0.166 (1.00) |
| DEL PEAK 11(3Q22 1) MUTATION ANALYSIS | 55 (10%) | 498 |
0.547 (1.00) |
0.137 (1.00) |
1 (1.00) |
0.503 (1.00) |
0.665 (1.00) |
0.442 (1.00) |
| DEL PEAK 12(3Q29) MUTATION ANALYSIS | 63 (11%) | 490 |
0.214 (1.00) |
0.25 (1.00) |
1 (1.00) |
0.473 (1.00) |
1 (1.00) |
0.246 (1.00) |
| DEL PEAK 13(4P16 3) MUTATION ANALYSIS | 76 (14%) | 477 |
0.44 (1.00) |
0.0317 (1.00) |
0.255 (1.00) |
0.161 (1.00) |
0.389 (1.00) |
0.0844 (1.00) |
| DEL PEAK 14(4Q34 3) MUTATION ANALYSIS | 89 (16%) | 464 |
0.135 (1.00) |
0.0957 (1.00) |
0.0588 (1.00) |
0.64 (1.00) |
0.453 (1.00) |
0.0615 (1.00) |
| DEL PEAK 15(5Q35 2) MUTATION ANALYSIS | 54 (10%) | 499 |
0.0617 (1.00) |
0.124 (1.00) |
0.661 (1.00) |
0.796 (1.00) |
0.88 (1.00) |
0.165 (1.00) |
| DEL PEAK 16(6Q22 31) MUTATION ANALYSIS | 152 (27%) | 401 |
0.07 (1.00) |
0.313 (1.00) |
0.0802 (1.00) |
0.476 (1.00) |
0.0647 (1.00) |
0.757 (1.00) |
| DEL PEAK 17(6Q26) MUTATION ANALYSIS | 172 (31%) | 381 |
0.168 (1.00) |
0.782 (1.00) |
0.189 (1.00) |
0.732 (1.00) |
0.0986 (1.00) |
0.552 (1.00) |
| DEL PEAK 18(8P23 2) MUTATION ANALYSIS | 66 (12%) | 487 |
0.21 (1.00) |
0.0314 (1.00) |
0.594 (1.00) |
0.648 (1.00) |
0.889 (1.00) |
0.571 (1.00) |
| DEL PEAK 20(9Q34 2) MUTATION ANALYSIS | 71 (13%) | 482 |
0.452 (1.00) |
0.586 (1.00) |
1 (1.00) |
0.513 (1.00) |
0.894 (1.00) |
1 (1.00) |
| DEL PEAK 26(11P15 5) MUTATION ANALYSIS | 126 (23%) | 427 |
0.0194 (1.00) |
0.0036 (1.00) |
0.213 (1.00) |
0.256 (1.00) |
0.503 (1.00) |
0.913 (1.00) |
| DEL PEAK 27(11P11 2) MUTATION ANALYSIS | 100 (18%) | 453 |
0.0555 (1.00) |
0.684 (1.00) |
0.143 (1.00) |
0.818 (1.00) |
0.222 (1.00) |
0.812 (1.00) |
| DEL PEAK 28(11Q14 1) MUTATION ANALYSIS | 94 (17%) | 459 |
0.98 (1.00) |
0.77 (1.00) |
0.297 (1.00) |
0.521 (1.00) |
0.399 (1.00) |
0.0656 (1.00) |
| DEL PEAK 29(12P13 1) MUTATION ANALYSIS | 73 (13%) | 480 |
0.208 (1.00) |
0.852 (1.00) |
0.441 (1.00) |
0.729 (1.00) |
0.811 (1.00) |
0.786 (1.00) |
| DEL PEAK 30(12Q12) MUTATION ANALYSIS | 75 (14%) | 478 |
0.54 (1.00) |
0.7 (1.00) |
0.9 (1.00) |
0.792 (1.00) |
1 (1.00) |
0.347 (1.00) |
| DEL PEAK 31(12Q15) MUTATION ANALYSIS | 76 (14%) | 477 |
0.572 (1.00) |
0.681 (1.00) |
0.451 (1.00) |
0.178 (1.00) |
0.669 (1.00) |
0.144 (1.00) |
| DEL PEAK 32(13Q14 2) MUTATION ANALYSIS | 233 (42%) | 320 |
0.748 (1.00) |
0.577 (1.00) |
0.792 (1.00) |
0.789 (1.00) |
0.584 (1.00) |
0.514 (1.00) |
| DEL PEAK 33(14Q13 1) MUTATION ANALYSIS | 172 (31%) | 381 |
0.691 (1.00) |
0.562 (1.00) |
0.189 (1.00) |
0.224 (1.00) |
0.0839 (1.00) |
0.552 (1.00) |
| DEL PEAK 34(14Q24 2) MUTATION ANALYSIS | 167 (30%) | 386 |
0.645 (1.00) |
0.421 (1.00) |
0.344 (1.00) |
0.545 (1.00) |
0.0593 (1.00) |
0.369 (1.00) |
| DEL PEAK 35(14Q31 3) MUTATION ANALYSIS | 154 (28%) | 399 |
0.874 (1.00) |
0.689 (1.00) |
0.561 (1.00) |
0.581 (1.00) |
0.0336 (1.00) |
0.474 (1.00) |
| DEL PEAK 36(15Q14) MUTATION ANALYSIS | 146 (26%) | 407 |
0.314 (1.00) |
0.064 (1.00) |
0.768 (1.00) |
0.723 (1.00) |
0.546 (1.00) |
0.348 (1.00) |
| DEL PEAK 37(16P12 2) MUTATION ANALYSIS | 89 (16%) | 464 |
0.135 (1.00) |
0.312 (1.00) |
0.239 (1.00) |
0.826 (1.00) |
0.224 (1.00) |
0.534 (1.00) |
| DEL PEAK 38(16Q23 3) MUTATION ANALYSIS | 93 (17%) | 460 |
0.0572 (1.00) |
0.956 (1.00) |
0.485 (1.00) |
0.256 (1.00) |
0.395 (1.00) |
0.0268 (1.00) |
| DEL PEAK 39(17P13 2) MUTATION ANALYSIS | 82 (15%) | 471 |
0.579 (1.00) |
0.469 (1.00) |
0.272 (1.00) |
0.199 (1.00) |
1 (1.00) |
0.698 (1.00) |
| DEL PEAK 40(17P13 1) MUTATION ANALYSIS | 92 (17%) | 461 |
0.327 (1.00) |
0.148 (1.00) |
0.0798 (1.00) |
0.819 (1.00) |
1 (1.00) |
0.11 (1.00) |
| DEL PEAK 41(17Q11 2) MUTATION ANALYSIS | 68 (12%) | 485 |
0.19 (1.00) |
0.484 (1.00) |
0.895 (1.00) |
0.238 (1.00) |
1 (1.00) |
0.0677 (1.00) |
| DEL PEAK 42(18Q22 3) MUTATION ANALYSIS | 79 (14%) | 474 |
0.537 (1.00) |
0.594 (1.00) |
0.805 (1.00) |
0.122 (1.00) |
1 (1.00) |
0.896 (1.00) |
| DEL PEAK 43(19Q13 41) MUTATION ANALYSIS | 99 (18%) | 454 |
0.0311 (1.00) |
0.314 (1.00) |
1 (1.00) |
0.278 (1.00) |
0.725 (1.00) |
1 (1.00) |
| DEL PEAK 44(21Q22 3) MUTATION ANALYSIS | 59 (11%) | 494 |
0.534 (1.00) |
0.0624 (1.00) |
0.325 (1.00) |
0.205 (1.00) |
1 (1.00) |
0.655 (1.00) |
| DEL PEAK 45(22Q13 32) MUTATION ANALYSIS | 207 (37%) | 346 |
0.922 (1.00) |
0.373 (1.00) |
1 (1.00) |
0.547 (1.00) |
0.86 (1.00) |
0.705 (1.00) |
| DEL PEAK 46(XP22 2) MUTATION ANALYSIS | 123 (22%) | 430 |
0.0913 (1.00) |
0.34 (1.00) |
0.676 (1.00) |
0.8 (1.00) |
0.618 (1.00) |
0.58 (1.00) |
P value = 2.4e-07 (logrank test), Q value = 9.9e-05
Table S1. Gene #8: 'AMP PEAK 8(7P11.2) MUTATION STATUS' versus Clinical Feature #1: 'Time to Death'
| nPatients | nDeath | Duration Range (Median), Month | |
|---|---|---|---|
| ALL | 553 | 445 | 0.1 - 127.6 (9.9) |
| AMP PEAK 8(7P11.2) MUTATED | 484 | 397 | 0.1 - 127.6 (9.4) |
| AMP PEAK 8(7P11.2) WILD-TYPE | 69 | 48 | 0.2 - 108.8 (15.3) |
Figure S1. Get High-res Image Gene #8: 'AMP PEAK 8(7P11.2) MUTATION STATUS' versus Clinical Feature #1: 'Time to Death'
P value = 1.84e-09 (t-test), Q value = 7.7e-07
Table S2. Gene #8: 'AMP PEAK 8(7P11.2) MUTATION STATUS' versus Clinical Feature #2: 'AGE'
| nPatients | Mean (Std.Dev) | |
|---|---|---|
| ALL | 553 | 57.8 (14.4) |
| AMP PEAK 8(7P11.2) MUTATED | 484 | 59.8 (12.5) |
| AMP PEAK 8(7P11.2) WILD-TYPE | 69 | 43.9 (18.8) |
Figure S2. Get High-res Image Gene #8: 'AMP PEAK 8(7P11.2) MUTATION STATUS' versus Clinical Feature #2: 'AGE'
P value = 1.83e-05 (logrank test), Q value = 0.0075
Table S3. Gene #9: 'AMP PEAK 9(7Q11.21) MUTATION STATUS' versus Clinical Feature #1: 'Time to Death'
| nPatients | nDeath | Duration Range (Median), Month | |
|---|---|---|---|
| ALL | 553 | 445 | 0.1 - 127.6 (9.9) |
| AMP PEAK 9(7Q11.21) MUTATED | 443 | 360 | 0.1 - 127.6 (9.4) |
| AMP PEAK 9(7Q11.21) WILD-TYPE | 110 | 85 | 0.2 - 108.8 (14.3) |
Figure S3. Get High-res Image Gene #9: 'AMP PEAK 9(7Q11.21) MUTATION STATUS' versus Clinical Feature #1: 'Time to Death'
P value = 6.97e-08 (t-test), Q value = 2.9e-05
Table S4. Gene #9: 'AMP PEAK 9(7Q11.21) MUTATION STATUS' versus Clinical Feature #2: 'AGE'
| nPatients | Mean (Std.Dev) | |
|---|---|---|
| ALL | 553 | 57.8 (14.4) |
| AMP PEAK 9(7Q11.21) MUTATED | 443 | 59.9 (12.5) |
| AMP PEAK 9(7Q11.21) WILD-TYPE | 110 | 49.4 (18.4) |
Figure S4. Get High-res Image Gene #9: 'AMP PEAK 9(7Q11.21) MUTATION STATUS' versus Clinical Feature #2: 'AGE'
P value = 0.000339 (logrank test), Q value = 0.14
Table S5. Gene #10: 'AMP PEAK 10(7Q21.2) MUTATION STATUS' versus Clinical Feature #1: 'Time to Death'
| nPatients | nDeath | Duration Range (Median), Month | |
|---|---|---|---|
| ALL | 553 | 445 | 0.1 - 127.6 (9.9) |
| AMP PEAK 10(7Q21.2) MUTATED | 458 | 375 | 0.1 - 127.6 (9.7) |
| AMP PEAK 10(7Q21.2) WILD-TYPE | 95 | 70 | 0.1 - 108.8 (12.4) |
Figure S5. Get High-res Image Gene #10: 'AMP PEAK 10(7Q21.2) MUTATION STATUS' versus Clinical Feature #1: 'Time to Death'
P value = 1.8e-05 (t-test), Q value = 0.0074
Table S6. Gene #10: 'AMP PEAK 10(7Q21.2) MUTATION STATUS' versus Clinical Feature #2: 'AGE'
| nPatients | Mean (Std.Dev) | |
|---|---|---|
| ALL | 553 | 57.8 (14.4) |
| AMP PEAK 10(7Q21.2) MUTATED | 458 | 59.4 (12.5) |
| AMP PEAK 10(7Q21.2) WILD-TYPE | 95 | 50.0 (19.8) |
Figure S6. Get High-res Image Gene #10: 'AMP PEAK 10(7Q21.2) MUTATION STATUS' versus Clinical Feature #2: 'AGE'
P value = 0.00047 (t-test), Q value = 0.19
Table S7. Gene #43: 'DEL PEAK 19(9P21.3) MUTATION STATUS' versus Clinical Feature #2: 'AGE'
| nPatients | Mean (Std.Dev) | |
|---|---|---|
| ALL | 553 | 57.8 (14.4) |
| DEL PEAK 19(9P21.3) MUTATED | 403 | 59.2 (13.7) |
| DEL PEAK 19(9P21.3) WILD-TYPE | 150 | 54.1 (15.7) |
Figure S7. Get High-res Image Gene #43: 'DEL PEAK 19(9P21.3) MUTATION STATUS' versus Clinical Feature #2: 'AGE'
P value = 1.91e-06 (logrank test), Q value = 0.00079
Table S8. Gene #45: 'DEL PEAK 21(10P15.3) MUTATION STATUS' versus Clinical Feature #1: 'Time to Death'
| nPatients | nDeath | Duration Range (Median), Month | |
|---|---|---|---|
| ALL | 553 | 445 | 0.1 - 127.6 (9.9) |
| DEL PEAK 21(10P15.3) MUTATED | 449 | 369 | 0.1 - 92.6 (9.8) |
| DEL PEAK 21(10P15.3) WILD-TYPE | 104 | 76 | 0.1 - 127.6 (11.7) |
Figure S8. Get High-res Image Gene #45: 'DEL PEAK 21(10P15.3) MUTATION STATUS' versus Clinical Feature #1: 'Time to Death'
P value = 3.76e-08 (t-test), Q value = 1.6e-05
Table S9. Gene #45: 'DEL PEAK 21(10P15.3) MUTATION STATUS' versus Clinical Feature #2: 'AGE'
| nPatients | Mean (Std.Dev) | |
|---|---|---|
| ALL | 553 | 57.8 (14.4) |
| DEL PEAK 21(10P15.3) MUTATED | 449 | 59.9 (12.5) |
| DEL PEAK 21(10P15.3) WILD-TYPE | 104 | 48.8 (18.5) |
Figure S9. Get High-res Image Gene #45: 'DEL PEAK 21(10P15.3) MUTATION STATUS' versus Clinical Feature #2: 'AGE'
P value = 1.27e-06 (logrank test), Q value = 0.00052
Table S10. Gene #46: 'DEL PEAK 22(10P13) MUTATION STATUS' versus Clinical Feature #1: 'Time to Death'
| nPatients | nDeath | Duration Range (Median), Month | |
|---|---|---|---|
| ALL | 553 | 445 | 0.1 - 127.6 (9.9) |
| DEL PEAK 22(10P13) MUTATED | 451 | 370 | 0.1 - 92.6 (9.9) |
| DEL PEAK 22(10P13) WILD-TYPE | 102 | 75 | 0.1 - 127.6 (11.5) |
Figure S10. Get High-res Image Gene #46: 'DEL PEAK 22(10P13) MUTATION STATUS' versus Clinical Feature #1: 'Time to Death'
P value = 1.82e-07 (t-test), Q value = 7.5e-05
Table S11. Gene #46: 'DEL PEAK 22(10P13) MUTATION STATUS' versus Clinical Feature #2: 'AGE'
| nPatients | Mean (Std.Dev) | |
|---|---|---|
| ALL | 553 | 57.8 (14.4) |
| DEL PEAK 22(10P13) MUTATED | 451 | 59.8 (12.4) |
| DEL PEAK 22(10P13) WILD-TYPE | 102 | 48.9 (19.0) |
Figure S11. Get High-res Image Gene #46: 'DEL PEAK 22(10P13) MUTATION STATUS' versus Clinical Feature #2: 'AGE'
P value = 9.13e-08 (logrank test), Q value = 3.8e-05
Table S12. Gene #47: 'DEL PEAK 23(10P11.23) MUTATION STATUS' versus Clinical Feature #1: 'Time to Death'
| nPatients | nDeath | Duration Range (Median), Month | |
|---|---|---|---|
| ALL | 553 | 445 | 0.1 - 127.6 (9.9) |
| DEL PEAK 23(10P11.23) MUTATED | 455 | 373 | 0.1 - 92.6 (9.7) |
| DEL PEAK 23(10P11.23) WILD-TYPE | 98 | 72 | 0.1 - 127.6 (12.8) |
Figure S12. Get High-res Image Gene #47: 'DEL PEAK 23(10P11.23) MUTATION STATUS' versus Clinical Feature #1: 'Time to Death'

P value = 1.06e-08 (t-test), Q value = 4.5e-06
Table S13. Gene #47: 'DEL PEAK 23(10P11.23) MUTATION STATUS' versus Clinical Feature #2: 'AGE'
| nPatients | Mean (Std.Dev) | |
|---|---|---|
| ALL | 553 | 57.8 (14.4) |
| DEL PEAK 23(10P11.23) MUTATED | 455 | 60.0 (12.3) |
| DEL PEAK 23(10P11.23) WILD-TYPE | 98 | 47.7 (18.9) |
Figure S13. Get High-res Image Gene #47: 'DEL PEAK 23(10P11.23) MUTATION STATUS' versus Clinical Feature #2: 'AGE'
P value = 0.000576 (Fisher's exact test), Q value = 0.23
Table S14. Gene #47: 'DEL PEAK 23(10P11.23) MUTATION STATUS' versus Clinical Feature #5: 'HISTOLOGICAL.TYPE'
| nPatients | GLIOBLASTOMA MULTIFORME (GBM) | TREATED PRIMARY GBM | UNTREATED PRIMARY (DE NOVO) GBM |
|---|---|---|---|
| ALL | 10 | 18 | 525 |
| DEL PEAK 23(10P11.23) MUTATED | 5 | 10 | 440 |
| DEL PEAK 23(10P11.23) WILD-TYPE | 5 | 8 | 85 |
Figure S14. Get High-res Image Gene #47: 'DEL PEAK 23(10P11.23) MUTATION STATUS' versus Clinical Feature #5: 'HISTOLOGICAL.TYPE'
P value = 1.08e-05 (logrank test), Q value = 0.0044
Table S15. Gene #48: 'DEL PEAK 24(10Q23.31) MUTATION STATUS' versus Clinical Feature #1: 'Time to Death'
| nPatients | nDeath | Duration Range (Median), Month | |
|---|---|---|---|
| ALL | 553 | 445 | 0.1 - 127.6 (9.9) |
| DEL PEAK 24(10Q23.31) MUTATED | 491 | 401 | 0.1 - 127.6 (9.9) |
| DEL PEAK 24(10Q23.31) WILD-TYPE | 62 | 44 | 0.2 - 108.8 (12.5) |
Figure S15. Get High-res Image Gene #48: 'DEL PEAK 24(10Q23.31) MUTATION STATUS' versus Clinical Feature #1: 'Time to Death'
P value = 6.33e-06 (t-test), Q value = 0.0026
Table S16. Gene #48: 'DEL PEAK 24(10Q23.31) MUTATION STATUS' versus Clinical Feature #2: 'AGE'
| nPatients | Mean (Std.Dev) | |
|---|---|---|
| ALL | 553 | 57.8 (14.4) |
| DEL PEAK 24(10Q23.31) MUTATED | 491 | 59.2 (13.2) |
| DEL PEAK 24(10Q23.31) WILD-TYPE | 62 | 47.2 (18.7) |
Figure S16. Get High-res Image Gene #48: 'DEL PEAK 24(10Q23.31) MUTATION STATUS' versus Clinical Feature #2: 'AGE'
P value = 5.9e-05 (t-test), Q value = 0.024
Table S17. Gene #49: 'DEL PEAK 25(10Q26.3) MUTATION STATUS' versus Clinical Feature #2: 'AGE'
| nPatients | Mean (Std.Dev) | |
|---|---|---|
| ALL | 553 | 57.8 (14.4) |
| DEL PEAK 25(10Q26.3) MUTATED | 492 | 59.0 (13.4) |
| DEL PEAK 25(10Q26.3) WILD-TYPE | 61 | 48.3 (18.9) |
Figure S17. Get High-res Image Gene #49: 'DEL PEAK 25(10Q26.3) MUTATION STATUS' versus Clinical Feature #2: 'AGE'
-
Copy number data file = transformed.cor.cli.txt
-
Clinical data file = GBM-TP.clin.merged.picked.txt
-
Number of patients = 553
-
Number of significantly focal cnvs = 70
-
Number of selected clinical features = 6
-
Exclude genes that fewer than K tumors have mutations, K = 3
For survival clinical features, the Kaplan-Meier survival curves of tumors with and without gene mutations were plotted and the statistical significance P values were estimated by logrank test (Bland and Altman 2004) using the 'survdiff' function in R
For continuous numerical clinical features, two-tailed Student's t test with unequal variance (Lehmann and Romano 2005) was applied to compare the clinical values between tumors with and without gene mutations using 't.test' function in R
For binary or multi-class clinical features (nominal or ordinal), two-tailed Fisher's exact tests (Fisher 1922) were used to estimate the P values using the 'fisher.test' function in R
For multiple hypothesis correction, Q value is the False Discovery Rate (FDR) analogue of the P value (Benjamini and Hochberg 1995), defined as the minimum FDR at which the test may be called significant. We used the 'Benjamini and Hochberg' method of 'p.adjust' function in R to convert P values into Q values.
In addition to the links below, the full results of the analysis summarized in this report can also be downloaded programmatically using firehose_get, or interactively from either the Broad GDAC website or TCGA Data Coordination Center Portal.