This pipeline uses various statistical tests to identify miRs whose expression levels correlated to selected clinical features.
Testing the association between 534 miRs and 6 clinical features across 489 samples, statistically thresholded by Q value < 0.05, 3 clinical features related to at least one miRs.
-
3 miRs correlated to 'Time to Death'.
-
HSA-MIR-222 , HSA-MIR-221 , HSA-MIR-34A
-
2 miRs correlated to 'AGE'.
-
HSA-MIR-148A , HSA-MIR-210
-
9 miRs correlated to 'HISTOLOGICAL.TYPE'.
-
HSA-MIR-29C , HSA-MIR-137 , HSA-MIR-139 , HSA-MIR-433 , HSA-MIR-29B , ...
-
No miRs correlated to 'GENDER', 'KARNOFSKY.PERFORMANCE.SCORE', and 'RADIATIONS.RADIATION.REGIMENINDICATION'.
Complete statistical result table is provided in Supplement Table 1
Table 1. Get Full Table This table shows the clinical features, statistical methods used, and the number of miRs that are significantly associated with each clinical feature at Q value < 0.05.
| Clinical feature | Statistical test | Significant miRs | Associated with | Associated with | ||
|---|---|---|---|---|---|---|
| Time to Death | Cox regression test | N=3 | shorter survival | N=3 | longer survival | N=0 |
| AGE | Spearman correlation test | N=2 | older | N=2 | younger | N=0 |
| GENDER | t test | N=0 | ||||
| KARNOFSKY PERFORMANCE SCORE | Spearman correlation test | N=0 | ||||
| HISTOLOGICAL TYPE | ANOVA test | N=9 | ||||
| RADIATIONS RADIATION REGIMENINDICATION | t test | N=0 |
Table S1. Basic characteristics of clinical feature: 'Time to Death'
| Time to Death | Duration (Months) | 0.1-127.6 (median=10.6) |
| censored | N = 80 | |
| death | N = 409 | |
| Significant markers | N = 3 | |
| associated with shorter survival | 3 | |
| associated with longer survival | 0 |
Table S2. Get Full Table List of 3 miRs significantly associated with 'Time to Death' by Cox regression test
| HazardRatio | Wald_P | Q | C_index | |
|---|---|---|---|---|
| HSA-MIR-222 | 1.26 | 4.763e-09 | 2.5e-06 | 0.561 |
| HSA-MIR-221 | 1.3 | 1.556e-06 | 0.00083 | 0.55 |
| HSA-MIR-34A | 1.2 | 5.891e-05 | 0.031 | 0.542 |
Figure S1. Get High-res Image As an example, this figure shows the association of HSA-MIR-222 to 'Time to Death'. four curves present the cumulative survival rates of 4 quartile subsets of patients. P value = 4.76e-09 with univariate Cox regression analysis using continuous log-2 expression values.
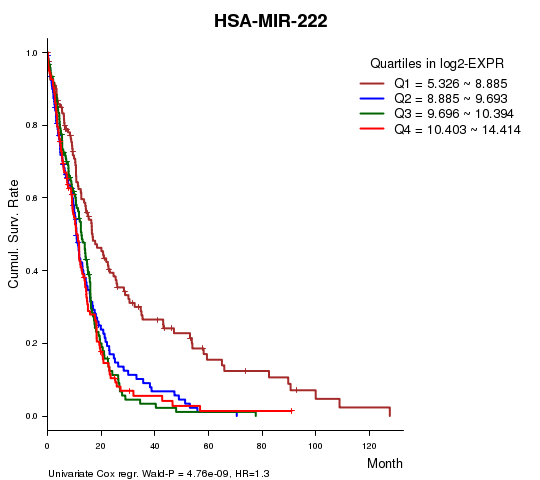
Table S3. Basic characteristics of clinical feature: 'AGE'
| AGE | Mean (SD) | 57.59 (15) |
| Significant markers | N = 2 | |
| pos. correlated | 2 | |
| neg. correlated | 0 |
Table S4. Get Full Table List of 2 miRs significantly correlated to 'AGE' by Spearman correlation test
| SpearmanCorr | corrP | Q | |
|---|---|---|---|
| HSA-MIR-148A | 0.2093 | 3.037e-06 | 0.00162 |
| HSA-MIR-210 | 0.1947 | 1.458e-05 | 0.00777 |
Figure S2. Get High-res Image As an example, this figure shows the association of HSA-MIR-148A to 'AGE'. P value = 3.04e-06 with Spearman correlation analysis. The straight line presents the best linear regression.
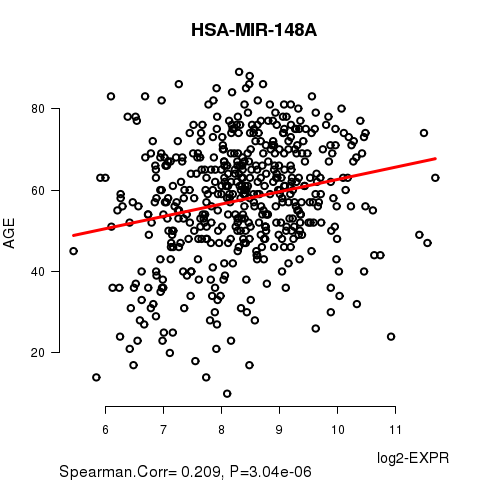
Table S5. Basic characteristics of clinical feature: 'GENDER'
| GENDER | Labels | N |
| FEMALE | 188 | |
| MALE | 301 | |
| Significant markers | N = 0 |
No miR related to 'KARNOFSKY.PERFORMANCE.SCORE'.
Table S6. Basic characteristics of clinical feature: 'KARNOFSKY.PERFORMANCE.SCORE'
| KARNOFSKY.PERFORMANCE.SCORE | Mean (SD) | 77.61 (14) |
| Significant markers | N = 0 |
Table S7. Basic characteristics of clinical feature: 'HISTOLOGICAL.TYPE'
| HISTOLOGICAL.TYPE | Labels | N |
| GLIOBLASTOMA MULTIFORME (GBM) | 7 | |
| TREATED PRIMARY GBM | 20 | |
| UNTREATED PRIMARY (DE NOVO) GBM | 462 | |
| Significant markers | N = 9 |
Table S8. Get Full Table List of 9 miRs differentially expressed by 'HISTOLOGICAL.TYPE'
| ANOVA_P | Q | |
|---|---|---|
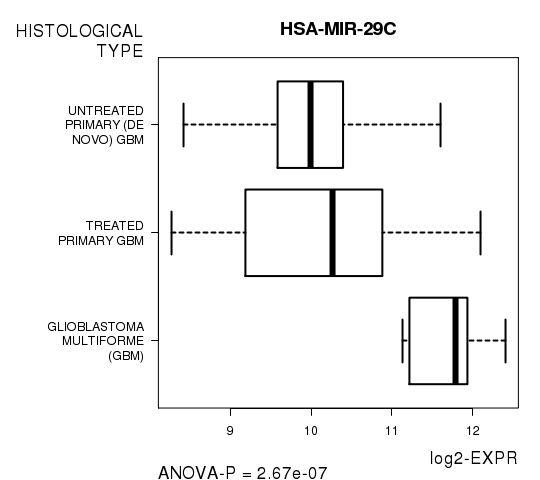
| HSA-MIR-29C | 2.667e-07 | 0.000142 |
| HSA-MIR-137 | 2.753e-07 | 0.000147 |
| HSA-MIR-139 | 7.732e-07 | 0.000411 |
| HSA-MIR-433 | 2.525e-06 | 0.00134 |
| HSA-MIR-29B | 4.647e-06 | 0.00246 |
| HSA-MIR-769-5P | 2.064e-05 | 0.0109 |
| HSA-MIR-130B | 2.959e-05 | 0.0156 |
| HSA-MIR-485-5P | 3.525e-05 | 0.0186 |
| HSA-MIR-218 | 5.233e-05 | 0.0275 |
Figure S3. Get High-res Image As an example, this figure shows the association of HSA-MIR-29C to 'HISTOLOGICAL.TYPE'. P value = 2.67e-07 with ANOVA analysis.
No miR related to 'RADIATIONS.RADIATION.REGIMENINDICATION'.
Table S9. Basic characteristics of clinical feature: 'RADIATIONS.RADIATION.REGIMENINDICATION'
| RADIATIONS.RADIATION.REGIMENINDICATION | Labels | N |
| NO | 338 | |
| YES | 151 | |
| Significant markers | N = 0 |
-
Expresson data file = GBM-TP.mirna__h_mirna_8x15k__unc_edu__Level_3__unc_DWD_Batch_adjusted__data.data.txt
-
Clinical data file = GBM-TP.clin.merged.picked.txt
-
Number of patients = 489
-
Number of miRs = 534
-
Number of clinical features = 6
For survival clinical features, Wald's test in univariate Cox regression analysis with proportional hazards model (Andersen and Gill 1982) was used to estimate the P values using the 'coxph' function in R. Kaplan-Meier survival curves were plot using the four quartile subgroups of patients based on expression levels
For continuous numerical clinical features, Spearman's rank correlation coefficients (Spearman 1904) and two-tailed P values were estimated using 'cor.test' function in R
For two-class clinical features, two-tailed Student's t test with unequal variance (Lehmann and Romano 2005) was applied to compare the log2-expression levels between the two clinical classes using 't.test' function in R
For multi-class clinical features (ordinal or nominal), one-way analysis of variance (Howell 2002) was applied to compare the log2-expression levels between different clinical classes using 'anova' function in R
For multiple hypothesis correction, Q value is the False Discovery Rate (FDR) analogue of the P value (Benjamini and Hochberg 1995), defined as the minimum FDR at which the test may be called significant. We used the 'Benjamini and Hochberg' method of 'p.adjust' function in R to convert P values into Q values.
In addition to the links below, the full results of the analysis summarized in this report can also be downloaded programmatically using firehose_get, or interactively from either the Broad GDAC website or TCGA Data Coordination Center Portal.