This report serves to describe the mutational landscape and properties of a given individual set, as well as rank genes and genesets according to mutational significance. MutSig v2.0 and MutSigCV v0.9 merged result was used to generate the results found in this report.
-
Working with individual set: GBM-TP
-
Number of patients in set: 283
The input for this pipeline is a set of individuals with the following files associated for each:
-
An annotated .maf file describing the mutations called for the respective individual, and their properties.
-
A .wig file that contains information about the coverage of the sample.
-
MAF used for this analysis:GBM-TP.final_analysis_set.maf
-
Significantly mutated genes (q ≤ 0.1): 12
-
Mutations seen in COSMIC: 470
-
Significantly mutated genes in COSMIC territory: 74
-
Significantly mutated genesets: 118
-
Read 283 MAFs of type "Broad"
-
Total number of mutations in input MAFs: 21510
-
Number of mutations before filtering: 21510
-
After removing 589 mutations outside gene set: 20921
-
After removing 12 mutations outside category set: 20909
Table 1. Get Full Table Table representing breakdown of mutations by type.
| type | count |
|---|---|
| Frame_Shift_Del | 534 |
| Frame_Shift_Ins | 206 |
| In_Frame_Del | 205 |
| In_Frame_Ins | 27 |
| Missense_Mutation | 13483 |
| Nonsense_Mutation | 808 |
| Nonstop_Mutation | 11 |
| Silent | 5240 |
| Splice_Site | 342 |
| Translation_Start_Site | 53 |
| Total | 20909 |
Table 2. Get Full Table A breakdown of mutation rates per category discovered for this individual set.
| category | n | N | rate | rate_per_mb | relative_rate | exp_ns_s_ratio |
|---|---|---|---|---|---|---|
| *CpG->T | 5501 | 471456280 | 0.000012 | 12 | 6.3 | 2.1 |
| *Cp(A/C/T)->T | 2408 | 3846173156 | 6.3e-07 | 0.63 | 0.34 | 1.7 |
| A->G | 1689 | 4141354039 | 4.1e-07 | 0.41 | 0.22 | 2.3 |
| transver | 3937 | 8458983475 | 4.7e-07 | 0.47 | 0.25 | 5 |
| indel+null | 2122 | 8458983475 | 2.5e-07 | 0.25 | 0.14 | NaN |
| double_null | 12 | 8458983475 | 1.4e-09 | 0.0014 | 0.00077 | NaN |
| Total | 15669 | 8458983475 | 1.9e-06 | 1.9 | 1 | 3.5 |
The x axis represents the samples. The y axis represents the exons, one row per exon, and they are sorted by average coverage across samples. For exons with exactly the same average coverage, they are sorted next by the %GC of the exon. (The secondary sort is especially useful for the zero-coverage exons at the bottom).
Figure 1.
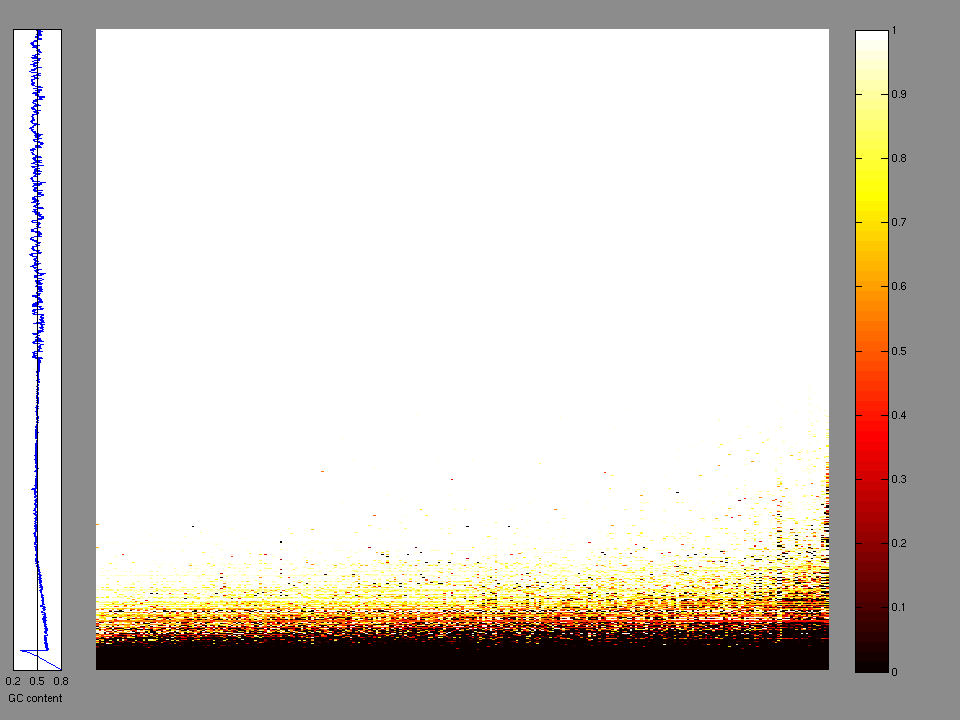
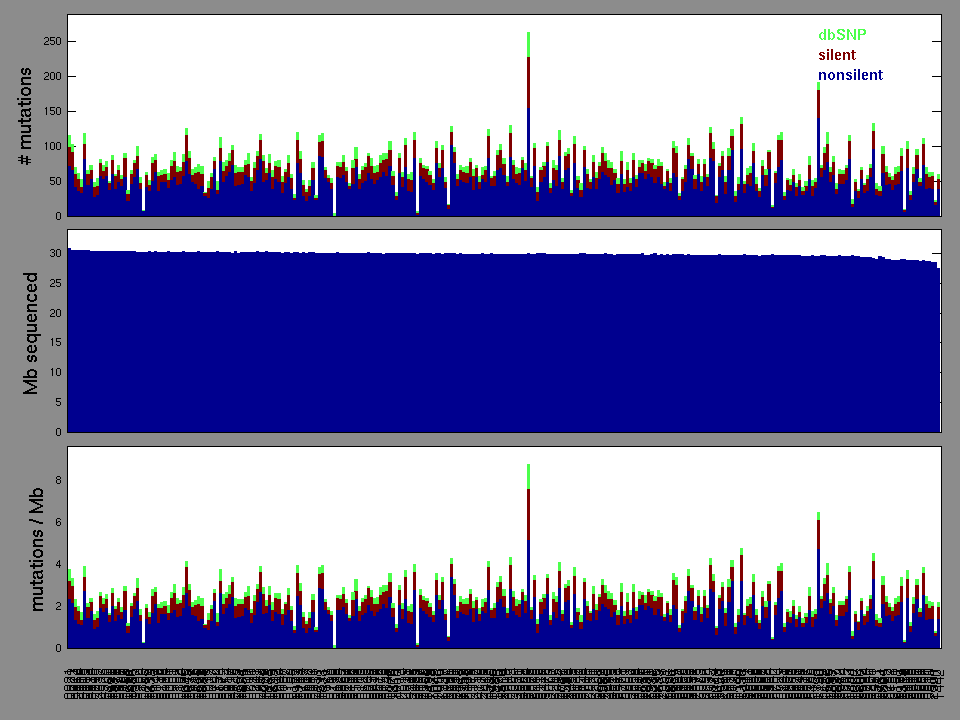
Figure 2. Patients counts and rates file used to generate this plot: GBM-TP.patients.counts_and_rates.txt
The mutation spectrum is depicted in the lego plots below in which the 96 possible mutation types are subdivided into six large blocks, color-coded to reflect the base substitution type. Each large block is further subdivided into the 16 possible pairs of 5' and 3' neighbors, as listed in the 4x4 trinucleotide context legend. The height of each block corresponds to the mutation frequency for that kind of mutation (counts of mutations normalized by the base coverage in a given bin). The shape of the spectrum is a signature for dominant mutational mechanisms in different tumor types.
Figure 3. Get High-res Image SNV Mutation rate lego plot for entire set. Each bin is normalized by base coverage for that bin. Colors represent the six SNV types on the upper right. The three-base context for each mutation is labeled in the 4x4 legend on the lower right. The fractional breakdown of SNV counts is shown in the pie chart on the upper left. If this figure is blank, not enough information was provided in the MAF to generate it.
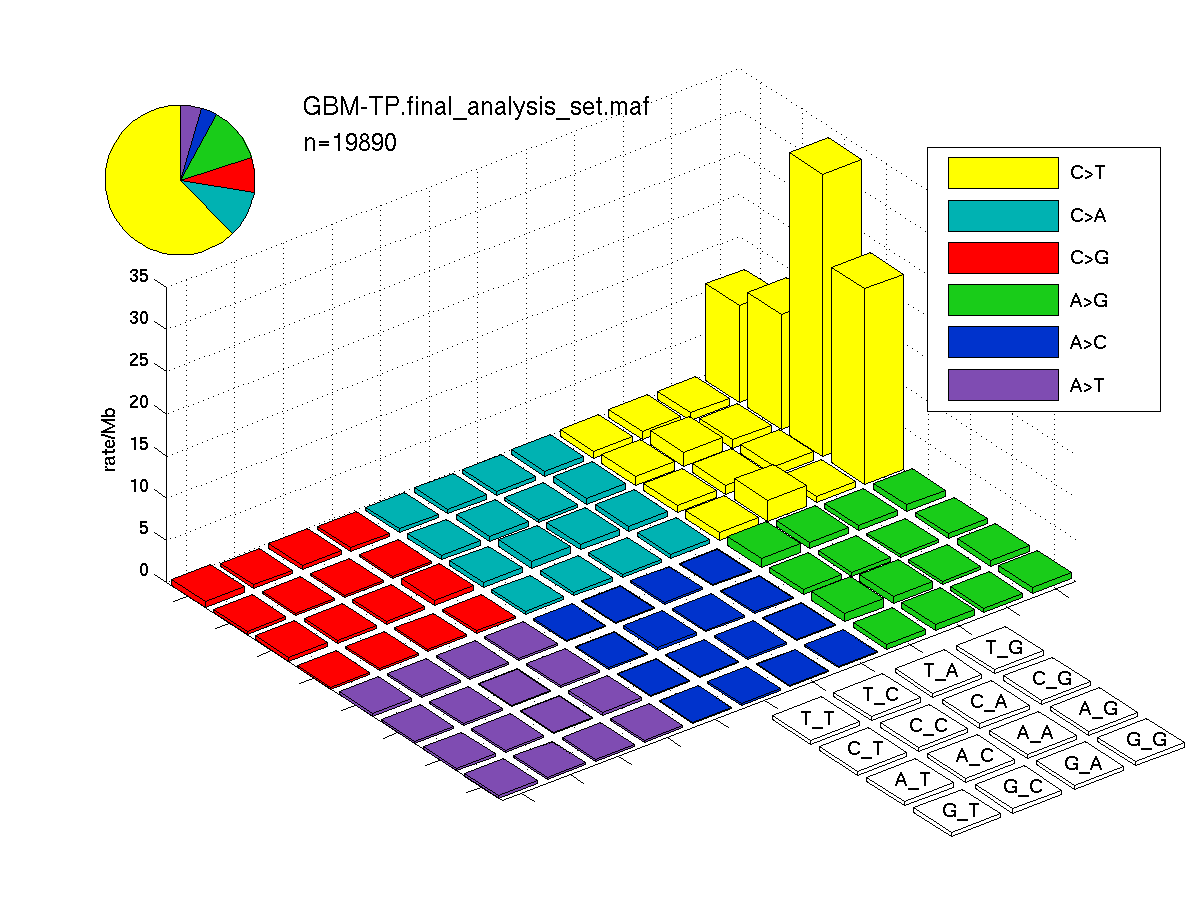
Figure 4. Get High-res Image SNV Mutation rate lego plots for 4 slices of mutation allele fraction (0<=AF<0.1, 0.1<=AF<0.25, 0.25<=AF<0.5, & 0.5<=AF) . The color code and three-base context legends are the same as the previous figure. If this figure is blank, not enough information was provided in the MAF to generate it.

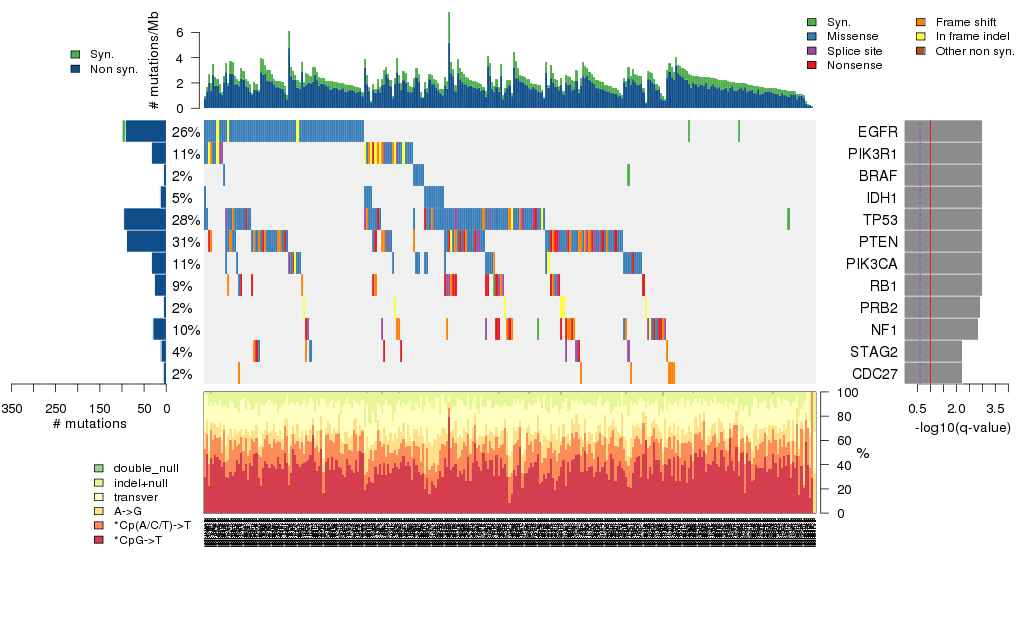
Figure 5. Get High-res Image The matrix in the center of the figure represents individual mutations in patient samples, color-coded by type of mutation, for the significantly mutated genes. The rate of synonymous and non-synonymous mutations is displayed at the top of the matrix. The barplot on the left of the matrix shows the number of mutations in each gene. The percentages represent the fraction of tumors with at least one mutation in the specified gene. The barplot to the right of the matrix displays the q-values for the most significantly mutated genes. The purple boxplots below the matrix (only displayed if required columns are present in the provided MAF) represent the distributions of allelic fractions observed in each sample. The plot at the bottom represents the base substitution distribution of individual samples, using the same categories that were used to calculate significance.
Column Descriptions:
-
N = number of sequenced bases in this gene across the individual set
-
n = number of (nonsilent) mutations in this gene across the individual set
-
npat = number of patients (individuals) with at least one nonsilent mutation
-
nsite = number of unique sites having a non-silent mutation
-
nsil = number of silent mutations in this gene across the individual set
-
n1 = number of nonsilent mutations of type: *CpG->T
-
n2 = number of nonsilent mutations of type: *Cp(A/C/T)->T
-
n3 = number of nonsilent mutations of type: A->G
-
n4 = number of nonsilent mutations of type: transver
-
n5 = number of nonsilent mutations of type: indel+null
-
n6 = number of nonsilent mutations of type: double_null
-
p_cons = p-value for enrichment of mutations at evolutionarily most-conserved sites in gene
-
p_joint = p-value for clustering + conservation
-
p = p-value (overall)
-
q = q-value, False Discovery Rate (Benjamini-Hochberg procedure)
Table 3. Get Full Table A Ranked List of Significantly Mutated Genes. Number of significant genes found: 12. Number of genes displayed: 35. Click on a gene name to display its stick figure depicting the distribution of mutations and mutation types across the chosen gene (this feature may not be available for all significant genes).
| rank | gene | description | N | n | npat | nsite | nsil | n1 | n2 | n3 | n4 | n5 | n6 | p_clust | p_cons | p_joint | p_cv | p | q |
|---|---|---|---|---|---|---|---|---|---|---|---|---|---|---|---|---|---|---|---|
| 1 | EGFR | epidermal growth factor receptor (erythroblastic leukemia viral (v-erb-b) oncogene homolog, avian) | 1131442 | 92 | 74 | 44 | 7 | 10 | 44 | 2 | 32 | 4 | 0 | 0 | 0 | 0 | 2.9e-15 | 0 | 0 |
| 2 | PIK3R1 | phosphoinositide-3-kinase, regulatory subunit 1 (alpha) | 668244 | 33 | 32 | 27 | 0 | 0 | 3 | 4 | 7 | 19 | 0 | 3.6e-06 | 0.085 | 4.8e-06 | 4.7e-15 | 0 | 0 |
| 3 | BRAF | v-raf murine sarcoma viral oncogene homolog B1 | 631073 | 6 | 6 | 2 | 1 | 0 | 1 | 0 | 5 | 0 | 0 | 0 | 0.08 | 0 | 0.043 | 0 | 0 |
| 4 | IDH1 | isocitrate dehydrogenase 1 (NADP+), soluble | 361231 | 14 | 14 | 2 | 0 | 13 | 0 | 0 | 1 | 0 | 0 | 0 | 0.83 | 0 | 1.1e-06 | 0 | 0 |
| 5 | TP53 | tumor protein p53 | 358092 | 96 | 79 | 59 | 1 | 29 | 15 | 11 | 23 | 18 | 0 | 0 | 0 | 0 | 0 | 0 | 0 |
| 6 | PTEN | phosphatase and tensin homolog (mutated in multiple advanced cancers 1) | 337830 | 90 | 87 | 73 | 0 | 5 | 20 | 10 | 13 | 42 | 0 | 0.0045 | 0.39 | 0.014 | 2.2e-15 | 1.2e-15 | 3.7e-12 |
| 7 | PIK3CA | phosphoinositide-3-kinase, catalytic, alpha polypeptide | 924699 | 33 | 30 | 28 | 0 | 5 | 8 | 7 | 6 | 7 | 0 | 0.012 | 0.17 | 0.014 | 7.7e-15 | 4.1e-15 | 1.1e-11 |
| 8 | RB1 | retinoblastoma 1 (including osteosarcoma) | 752003 | 26 | 25 | 24 | 1 | 1 | 0 | 0 | 2 | 22 | 1 | 0.044 | 0.023 | 0.017 | 6.4e-15 | 4.1e-15 | 1.1e-11 |
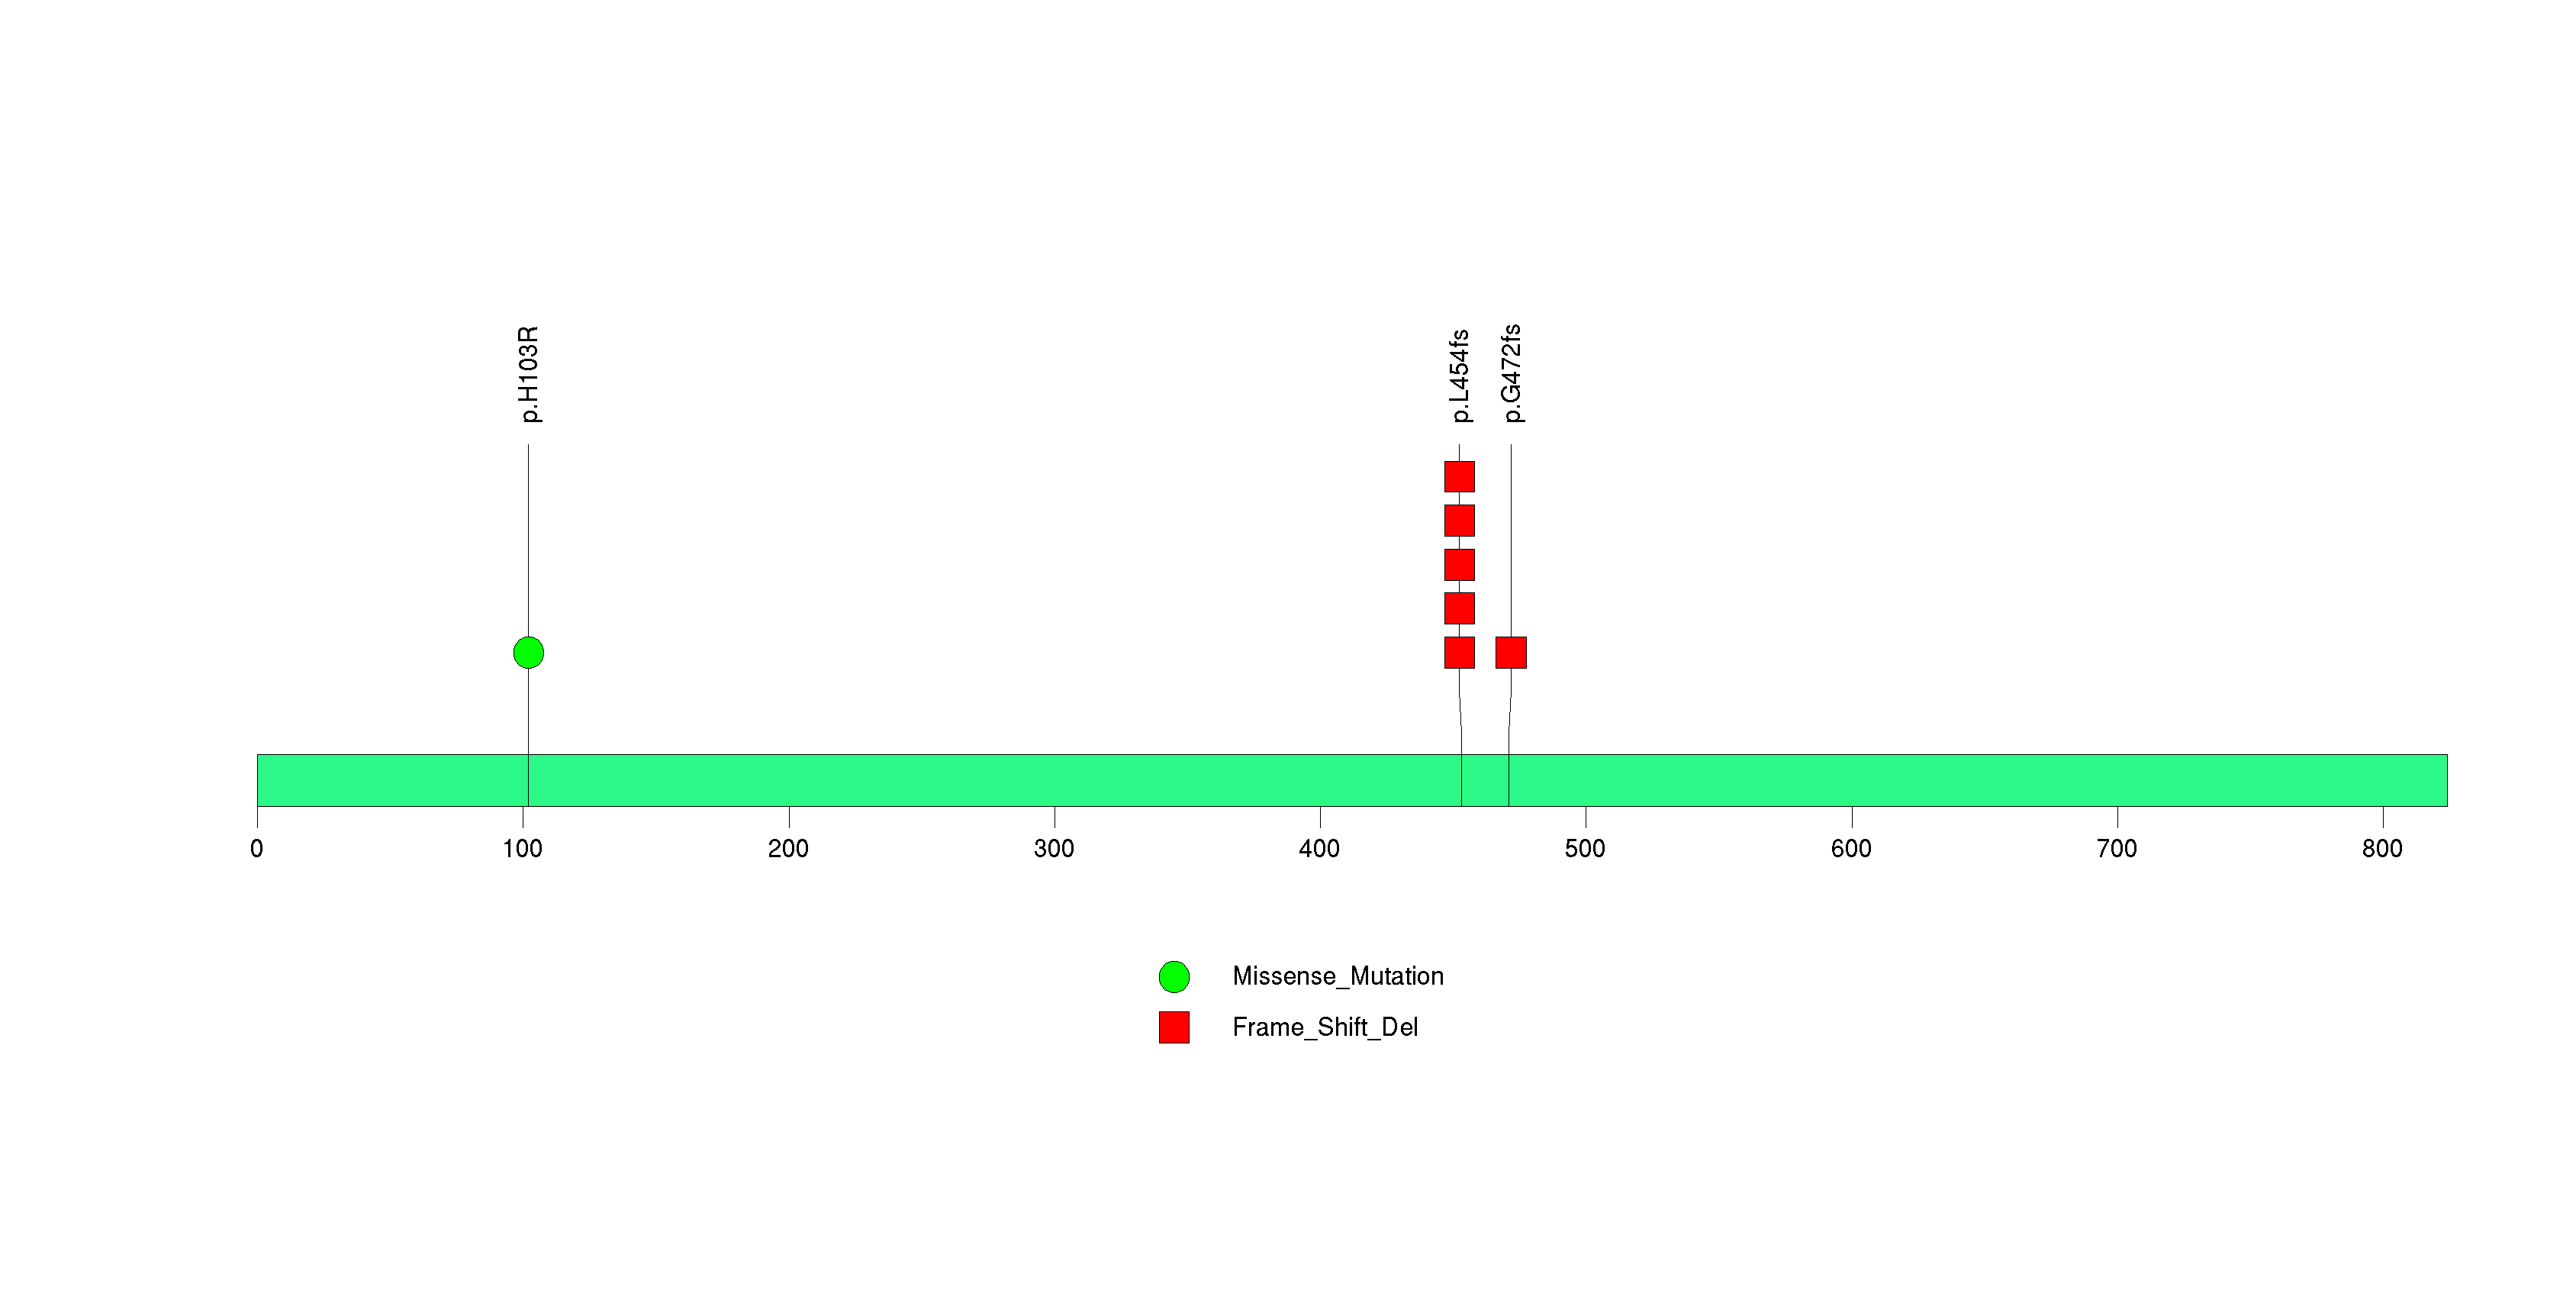
| 9 | PRB2 | proline-rich protein BstNI subfamily 2 | 357375 | 6 | 6 | 2 | 0 | 0 | 0 | 0 | 0 | 6 | 0 | 0.00042 | 0.57 | 0.0015 | 2.5e-06 | 7.8e-08 | 0.00016 |
| 10 | NF1 | neurofibromin 1 (neurofibromatosis, von Recklinghausen disease, Watson disease) | 2457594 | 30 | 29 | 30 | 1 | 0 | 2 | 1 | 1 | 21 | 5 | 0.16 | 0.95 | 0.26 | 4.5e-08 | 2.2e-07 | 0.0004 |
| 11 | STAG2 | stromal antigen 2 | 1110411 | 12 | 12 | 12 | 0 | 0 | 0 | 0 | 2 | 10 | 0 | 0.29 | 0.59 | 0.45 | 3.8e-07 | 2.8e-06 | 0.0046 |
| 12 | CDC27 | cell division cycle 27 homolog (S. cerevisiae) | 715613 | 7 | 6 | 3 | 0 | 0 | 0 | 1 | 0 | 6 | 0 | 0.00028 | 0.036 | 0.00025 | 0.00073 | 3.1e-06 | 0.0046 |
| 13 | WNT2 | wingless-type MMTV integration site family member 2 | 311956 | 5 | 5 | 5 | 0 | 3 | 0 | 0 | 1 | 1 | 0 | 0.003 | 0.03 | 0.00066 | 0.013 | 0.00011 | 0.15 |
| 14 | TPTE2 | transmembrane phosphoinositide 3-phosphatase and tensin homolog 2 | 464692 | 8 | 8 | 6 | 0 | 2 | 1 | 0 | 2 | 3 | 0 | 0.028 | 0.021 | 0.02 | 0.00054 | 0.00013 | 0.17 |
| 15 | GABRA6 | gamma-aminobutyric acid (GABA) A receptor, alpha 6 | 395438 | 11 | 11 | 10 | 1 | 4 | 2 | 1 | 4 | 0 | 0 | 0.73 | 0.34 | 0.76 | 0.000018 | 0.00016 | 0.2 |
| 16 | CD3EAP | CD3e molecule, epsilon associated protein | 427771 | 3 | 3 | 1 | 0 | 0 | 0 | 0 | 0 | 3 | 0 | 0.000069 | 0.88 | 0.0048 | 0.0074 | 0.0004 | 0.45 |
| 17 | QKI | quaking homolog, KH domain RNA binding (mouse) | 327911 | 5 | 5 | 5 | 0 | 0 | 0 | 0 | 2 | 3 | 0 | 0.4 | 0.0052 | 0.028 | 0.0016 | 0.00049 | 0.53 |
| 18 | PODXL | podocalyxin-like | 420137 | 3 | 3 | 1 | 0 | 0 | 0 | 0 | 0 | 3 | 0 | 0.0001 | 0.47 | 0.0021 | 0.037 | 0.00083 | 0.83 |
| 19 | OGDH | oxoglutarate (alpha-ketoglutarate) dehydrogenase (lipoamide) | 916526 | 3 | 3 | 1 | 3 | 0 | 0 | 0 | 0 | 3 | 0 | 0.000076 | 0.16 | 0.00031 | 0.29 | 0.00094 | 0.89 |
| 20 | RPL5 | ribosomal protein L5 | 261806 | 7 | 7 | 7 | 0 | 0 | 1 | 1 | 0 | 5 | 0 | 0.44 | 0.072 | 0.19 | 0.00074 | 0.0014 | 1 |
| 21 | CDKN2C | cyclin-dependent kinase inhibitor 2C (p18, inhibits CDK4) | 145441 | 3 | 3 | 3 | 0 | 0 | 0 | 0 | 0 | 3 | 0 | 0.17 | 0.94 | 0.42 | 0.00037 | 0.0015 | 1 |
| 22 | OR5AR1 | olfactory receptor, family 5, subfamily AR, member 1 | 264117 | 7 | 7 | 7 | 0 | 3 | 0 | 2 | 2 | 0 | 0 | 0.38 | 0.077 | 0.18 | 0.00085 | 0.0015 | 1 |
| 23 | CDHR3 | cadherin-related family member 3 | 766365 | 3 | 3 | 3 | 0 | 1 | 1 | 0 | 0 | 1 | 0 | 0.002 | 0.0097 | 0.00028 | 0.7 | 0.0019 | 1 |
| 24 | PSPH | phosphoserine phosphatase | 197527 | 5 | 5 | 3 | 0 | 0 | 3 | 0 | 1 | 1 | 0 | 0.083 | 0.35 | 0.18 | 0.0012 | 0.002 | 1 |
| 25 | ZPBP | zona pellucida binding protein | 282197 | 5 | 5 | 4 | 0 | 3 | 0 | 1 | 0 | 1 | 0 | 0.0081 | 0.37 | 0.019 | 0.012 | 0.002 | 1 |
| 26 | TMEM147 | transmembrane protein 147 | 198835 | 2 | 2 | 1 | 0 | 0 | 2 | 0 | 0 | 0 | 0 | 0.014 | 0.013 | 0.0017 | 0.15 | 0.0024 | 1 |
| 27 | LZTR1 | leucine-zipper-like transcription regulator 1 | 647961 | 10 | 10 | 10 | 0 | 4 | 0 | 1 | 4 | 1 | 0 | 0.29 | 0.18 | 0.24 | 0.0012 | 0.0027 | 1 |
| 28 | LRRC55 | leucine rich repeat containing 55 | 292293 | 6 | 6 | 6 | 1 | 4 | 0 | 0 | 1 | 1 | 0 | 0.1 | 0.61 | 0.21 | 0.0015 | 0.0029 | 1 |
| 29 | LCE4A | late cornified envelope 4A | 86032 | 2 | 2 | 1 | 0 | 0 | 0 | 0 | 0 | 2 | 0 | 0.0099 | 0.74 | 0.38 | 0.00085 | 0.0029 | 1 |
| 30 | POTEF | POTE ankyrin domain family, member F | 720525 | 5 | 5 | 5 | 1 | 1 | 0 | 0 | 4 | 0 | 0 | 0.0024 | 1 | 0.0033 | 0.098 | 0.0029 | 1 |
| 31 | ZNF697 | zinc finger protein 697 | 167111 | 3 | 3 | 3 | 0 | 2 | 0 | 0 | 0 | 1 | 0 | 0.18 | 0.04 | 0.048 | 0.0077 | 0.0033 | 1 |
| 32 | UGT2A3 | UDP glucuronosyltransferase 2 family, polypeptide A3 | 450901 | 6 | 6 | 6 | 0 | 1 | 0 | 2 | 2 | 1 | 0 | 0.22 | 0.013 | 0.041 | 0.0099 | 0.0036 | 1 |
| 33 | RBM47 | RNA binding motif protein 47 | 475159 | 8 | 8 | 8 | 3 | 7 | 0 | 1 | 0 | 0 | 0 | 0.0081 | 0.92 | 0.018 | 0.026 | 0.0041 | 1 |
| 34 | OR5P2 | olfactory receptor, family 5, subfamily P, member 2 | 274349 | 4 | 4 | 3 | 0 | 3 | 0 | 0 | 0 | 1 | 0 | 0.058 | 0.61 | 0.098 | 0.0059 | 0.0049 | 1 |
| 35 | OTC | ornithine carbamoyltransferase | 310746 | 3 | 3 | 3 | 0 | 0 | 1 | 1 | 1 | 0 | 0 | 0.012 | 0.25 | 0.015 | 0.045 | 0.0056 | 1 |
Figure S1. This figure depicts the distribution of mutations and mutation types across the EGFR significant gene.
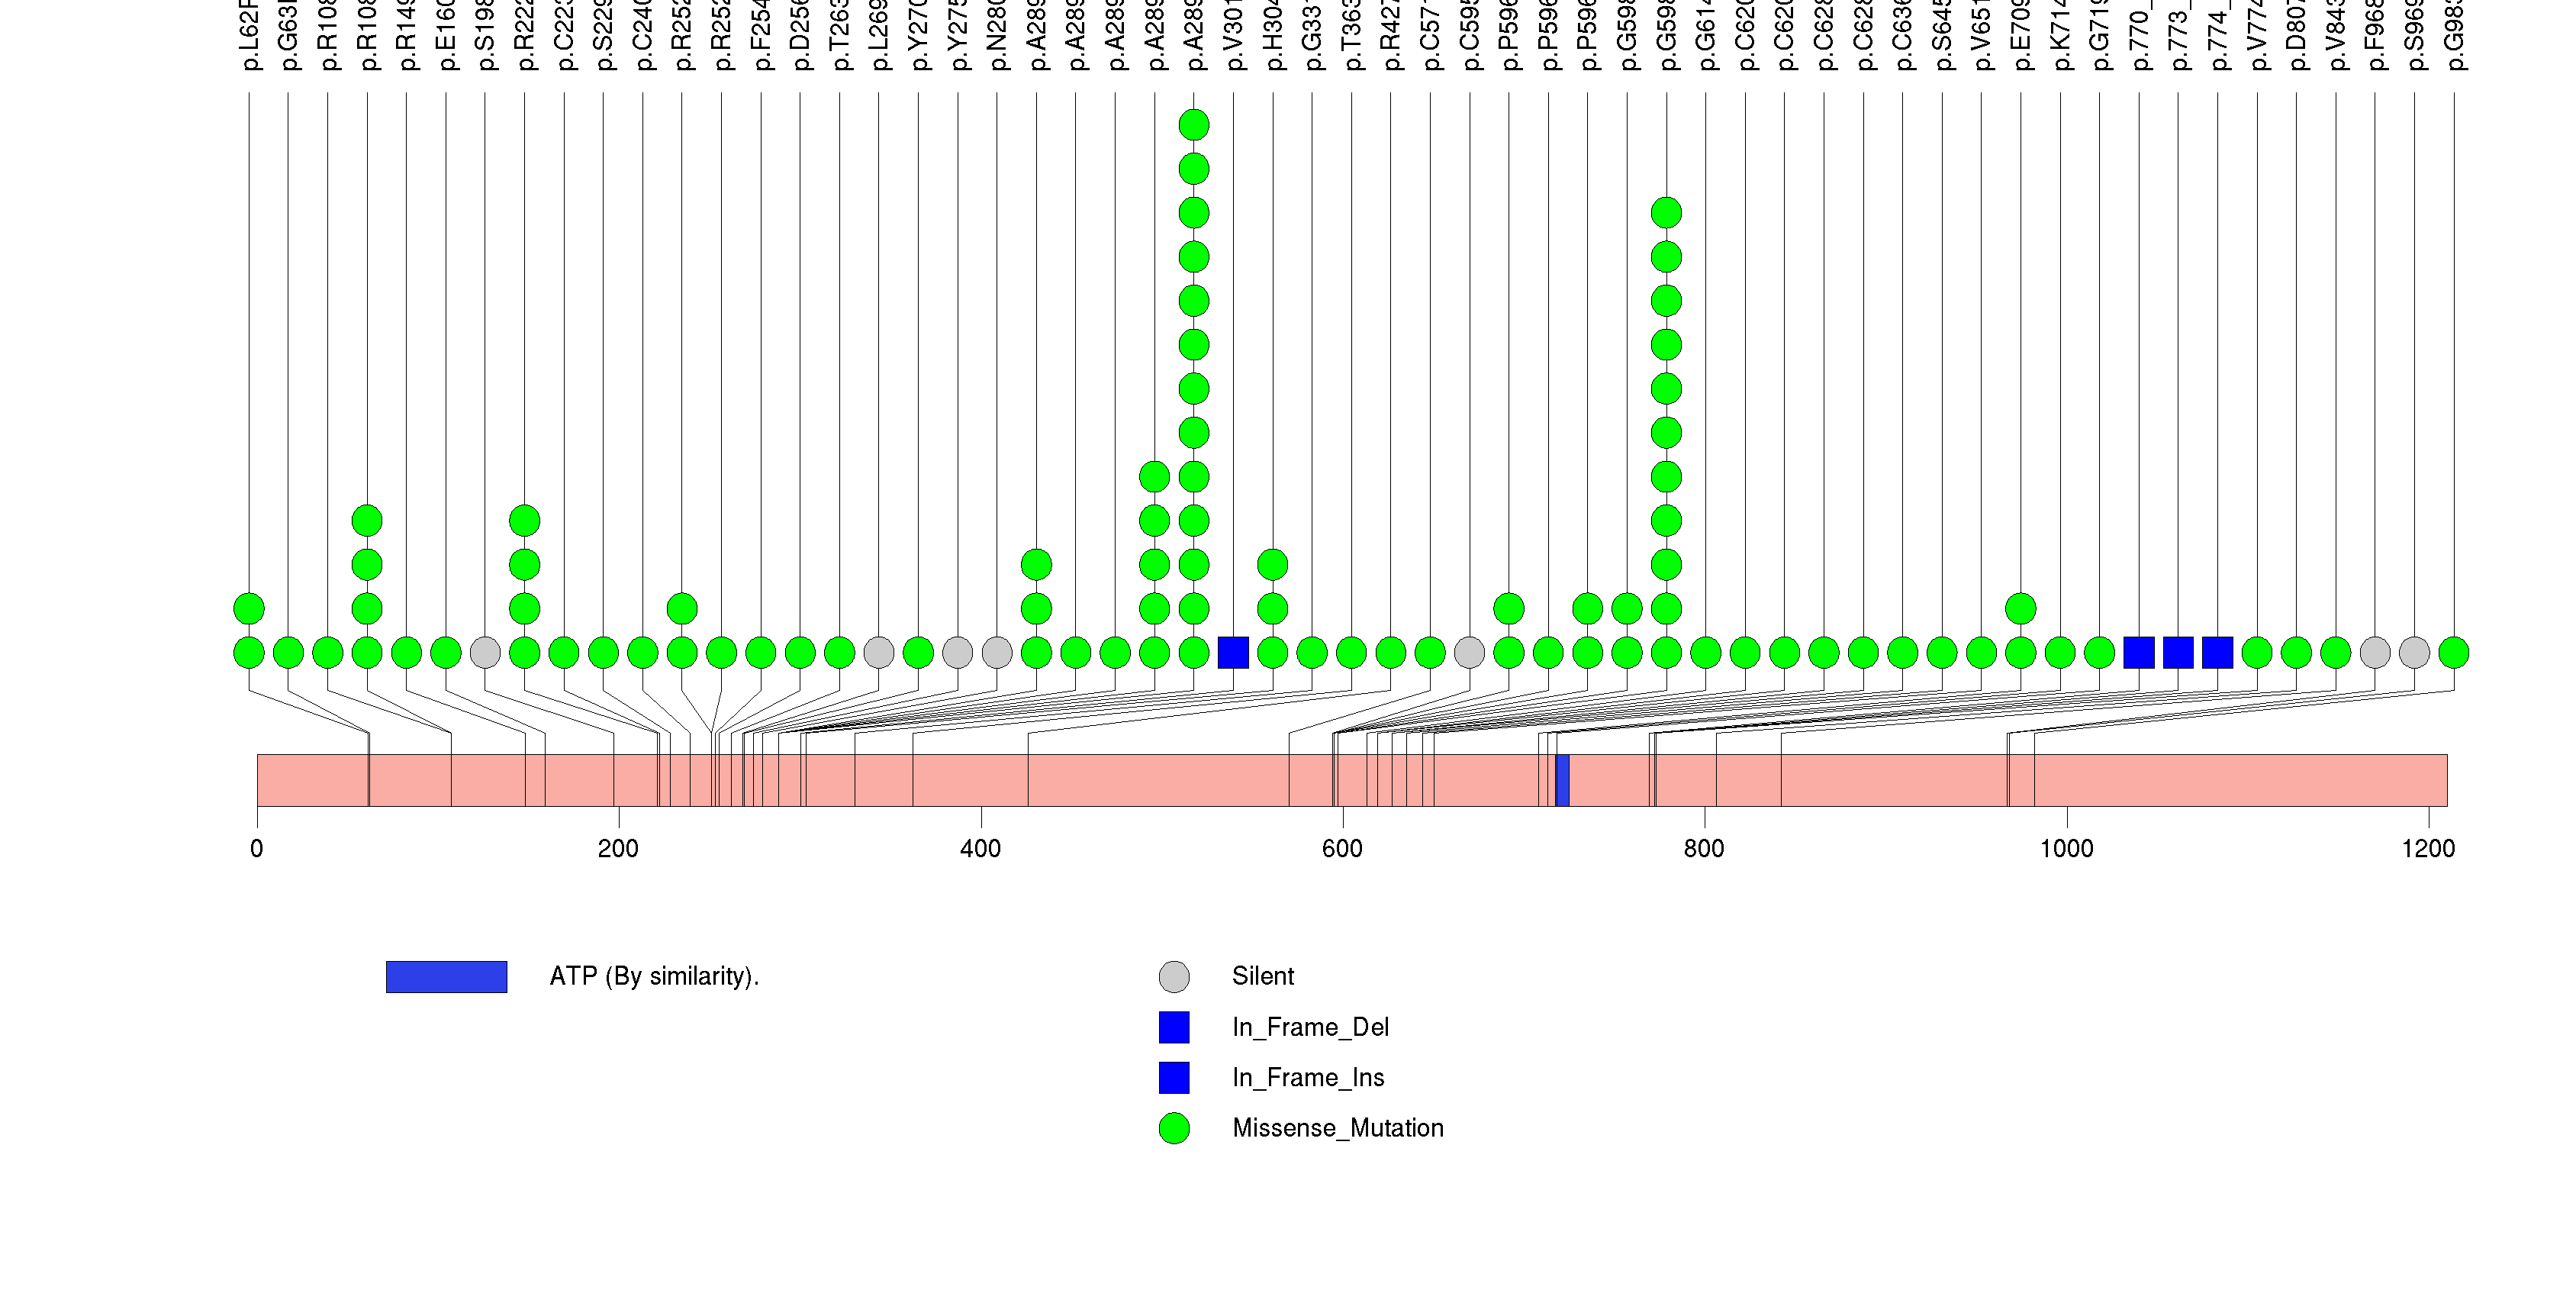
Figure S2. This figure depicts the distribution of mutations and mutation types across the PIK3R1 significant gene.
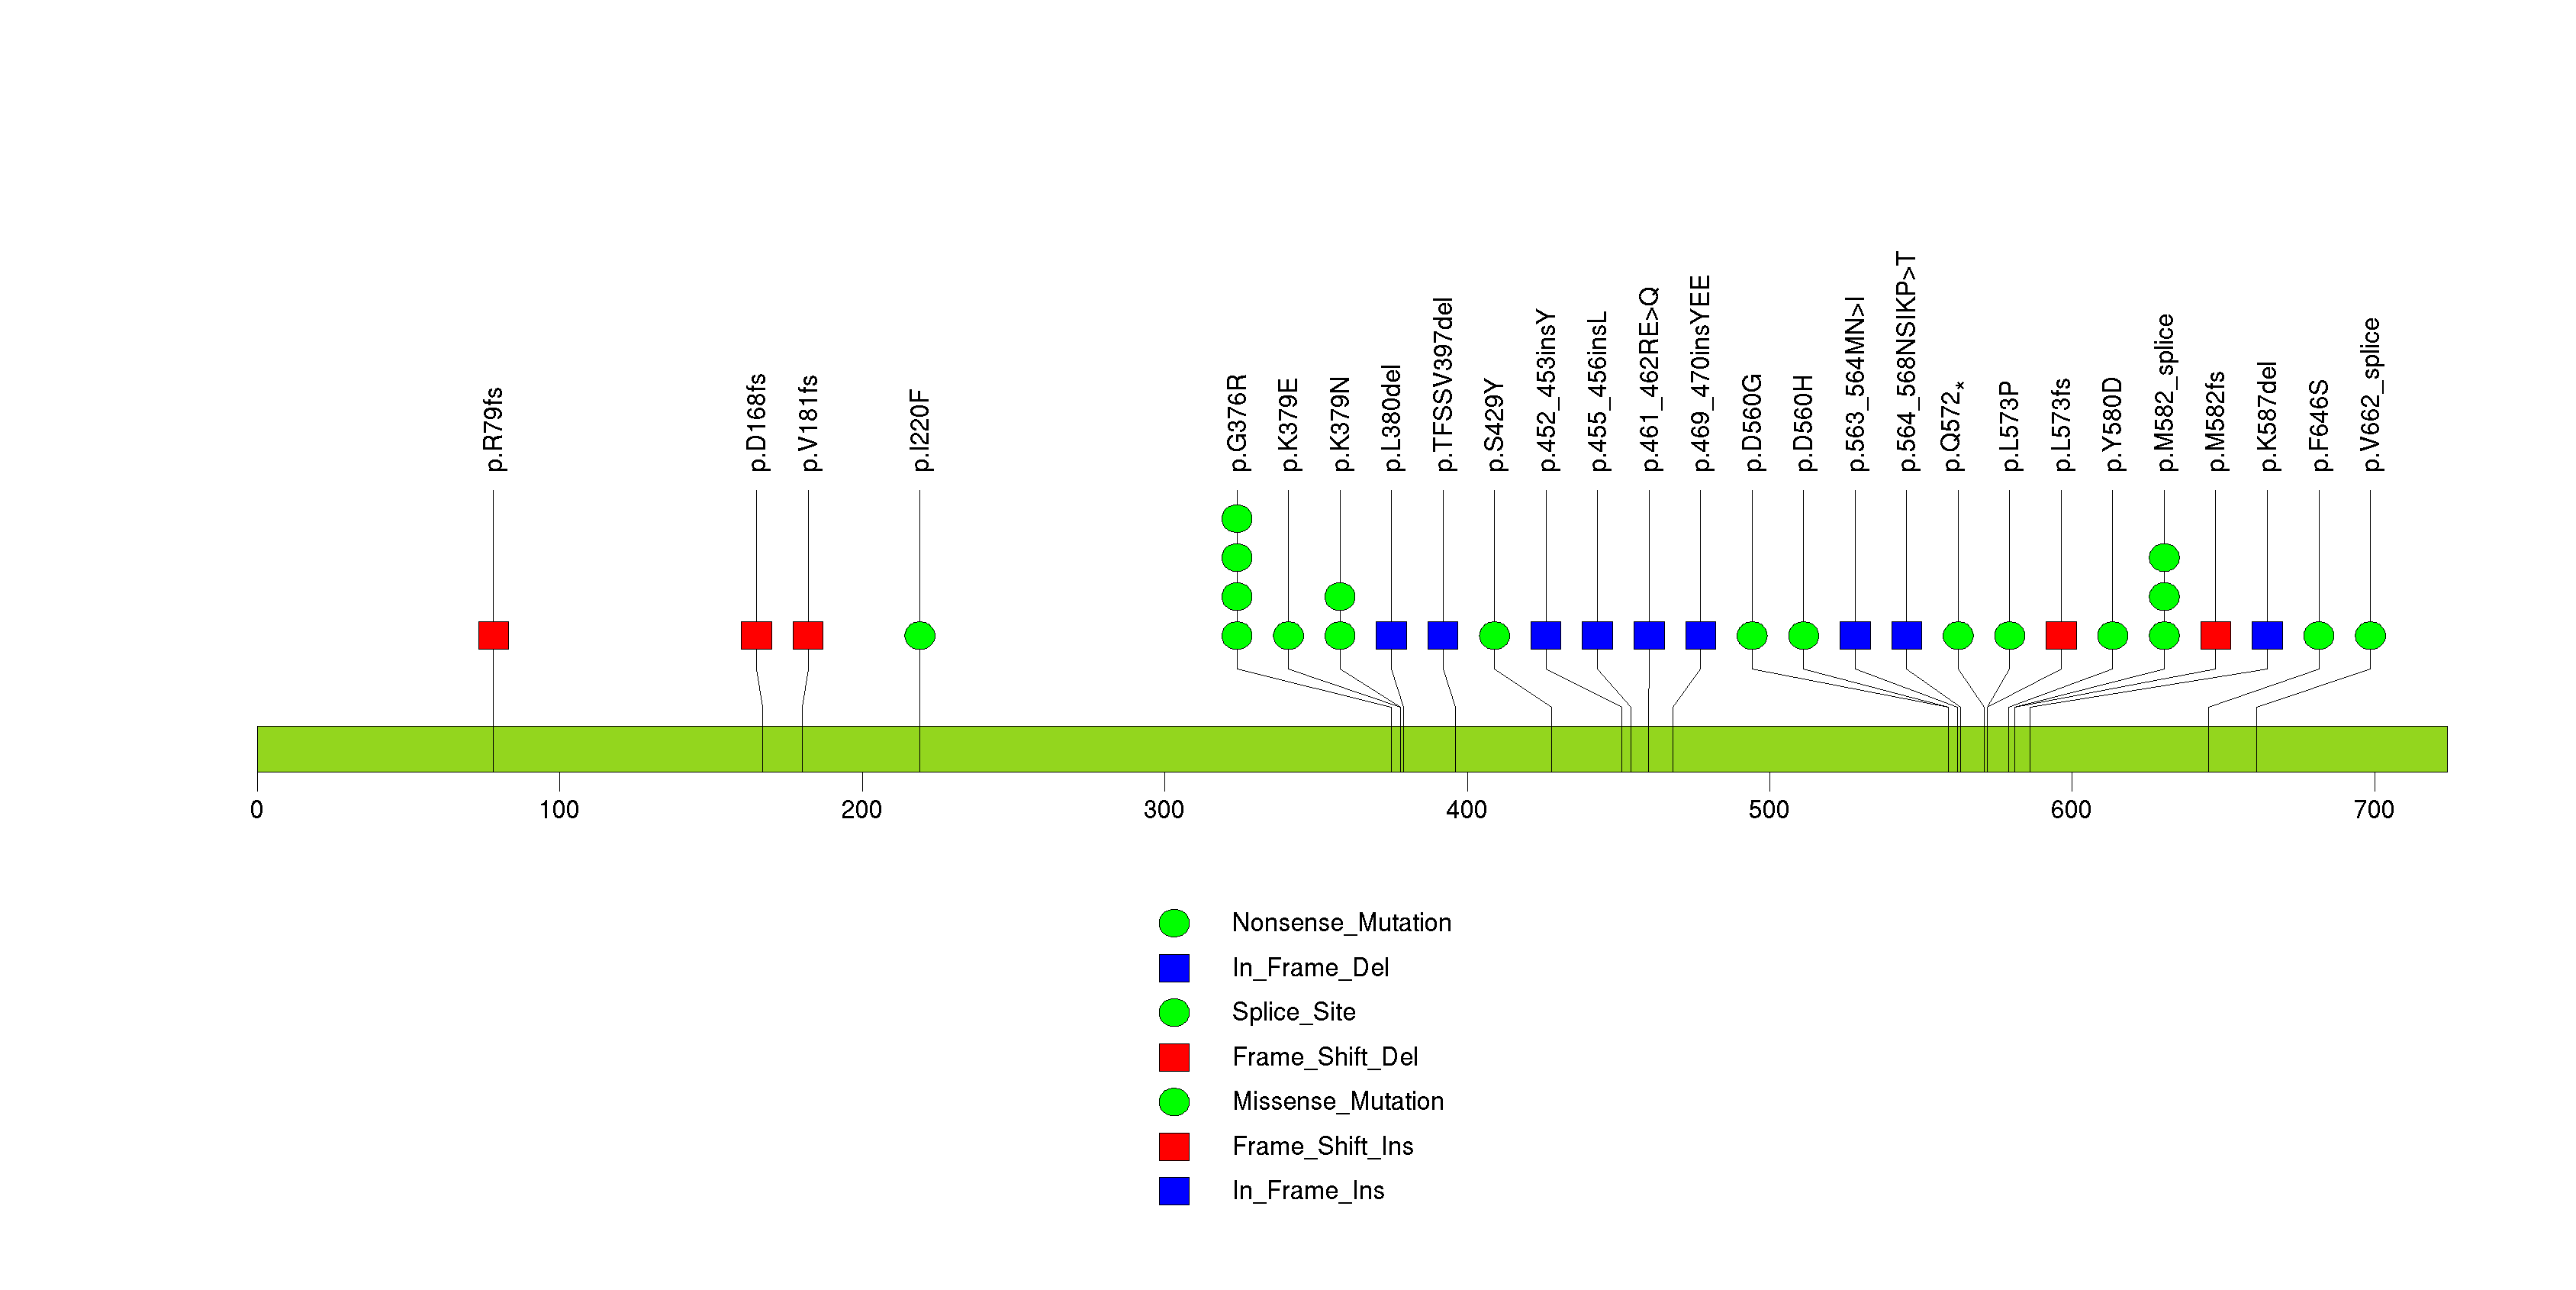
Figure S3. This figure depicts the distribution of mutations and mutation types across the BRAF significant gene.
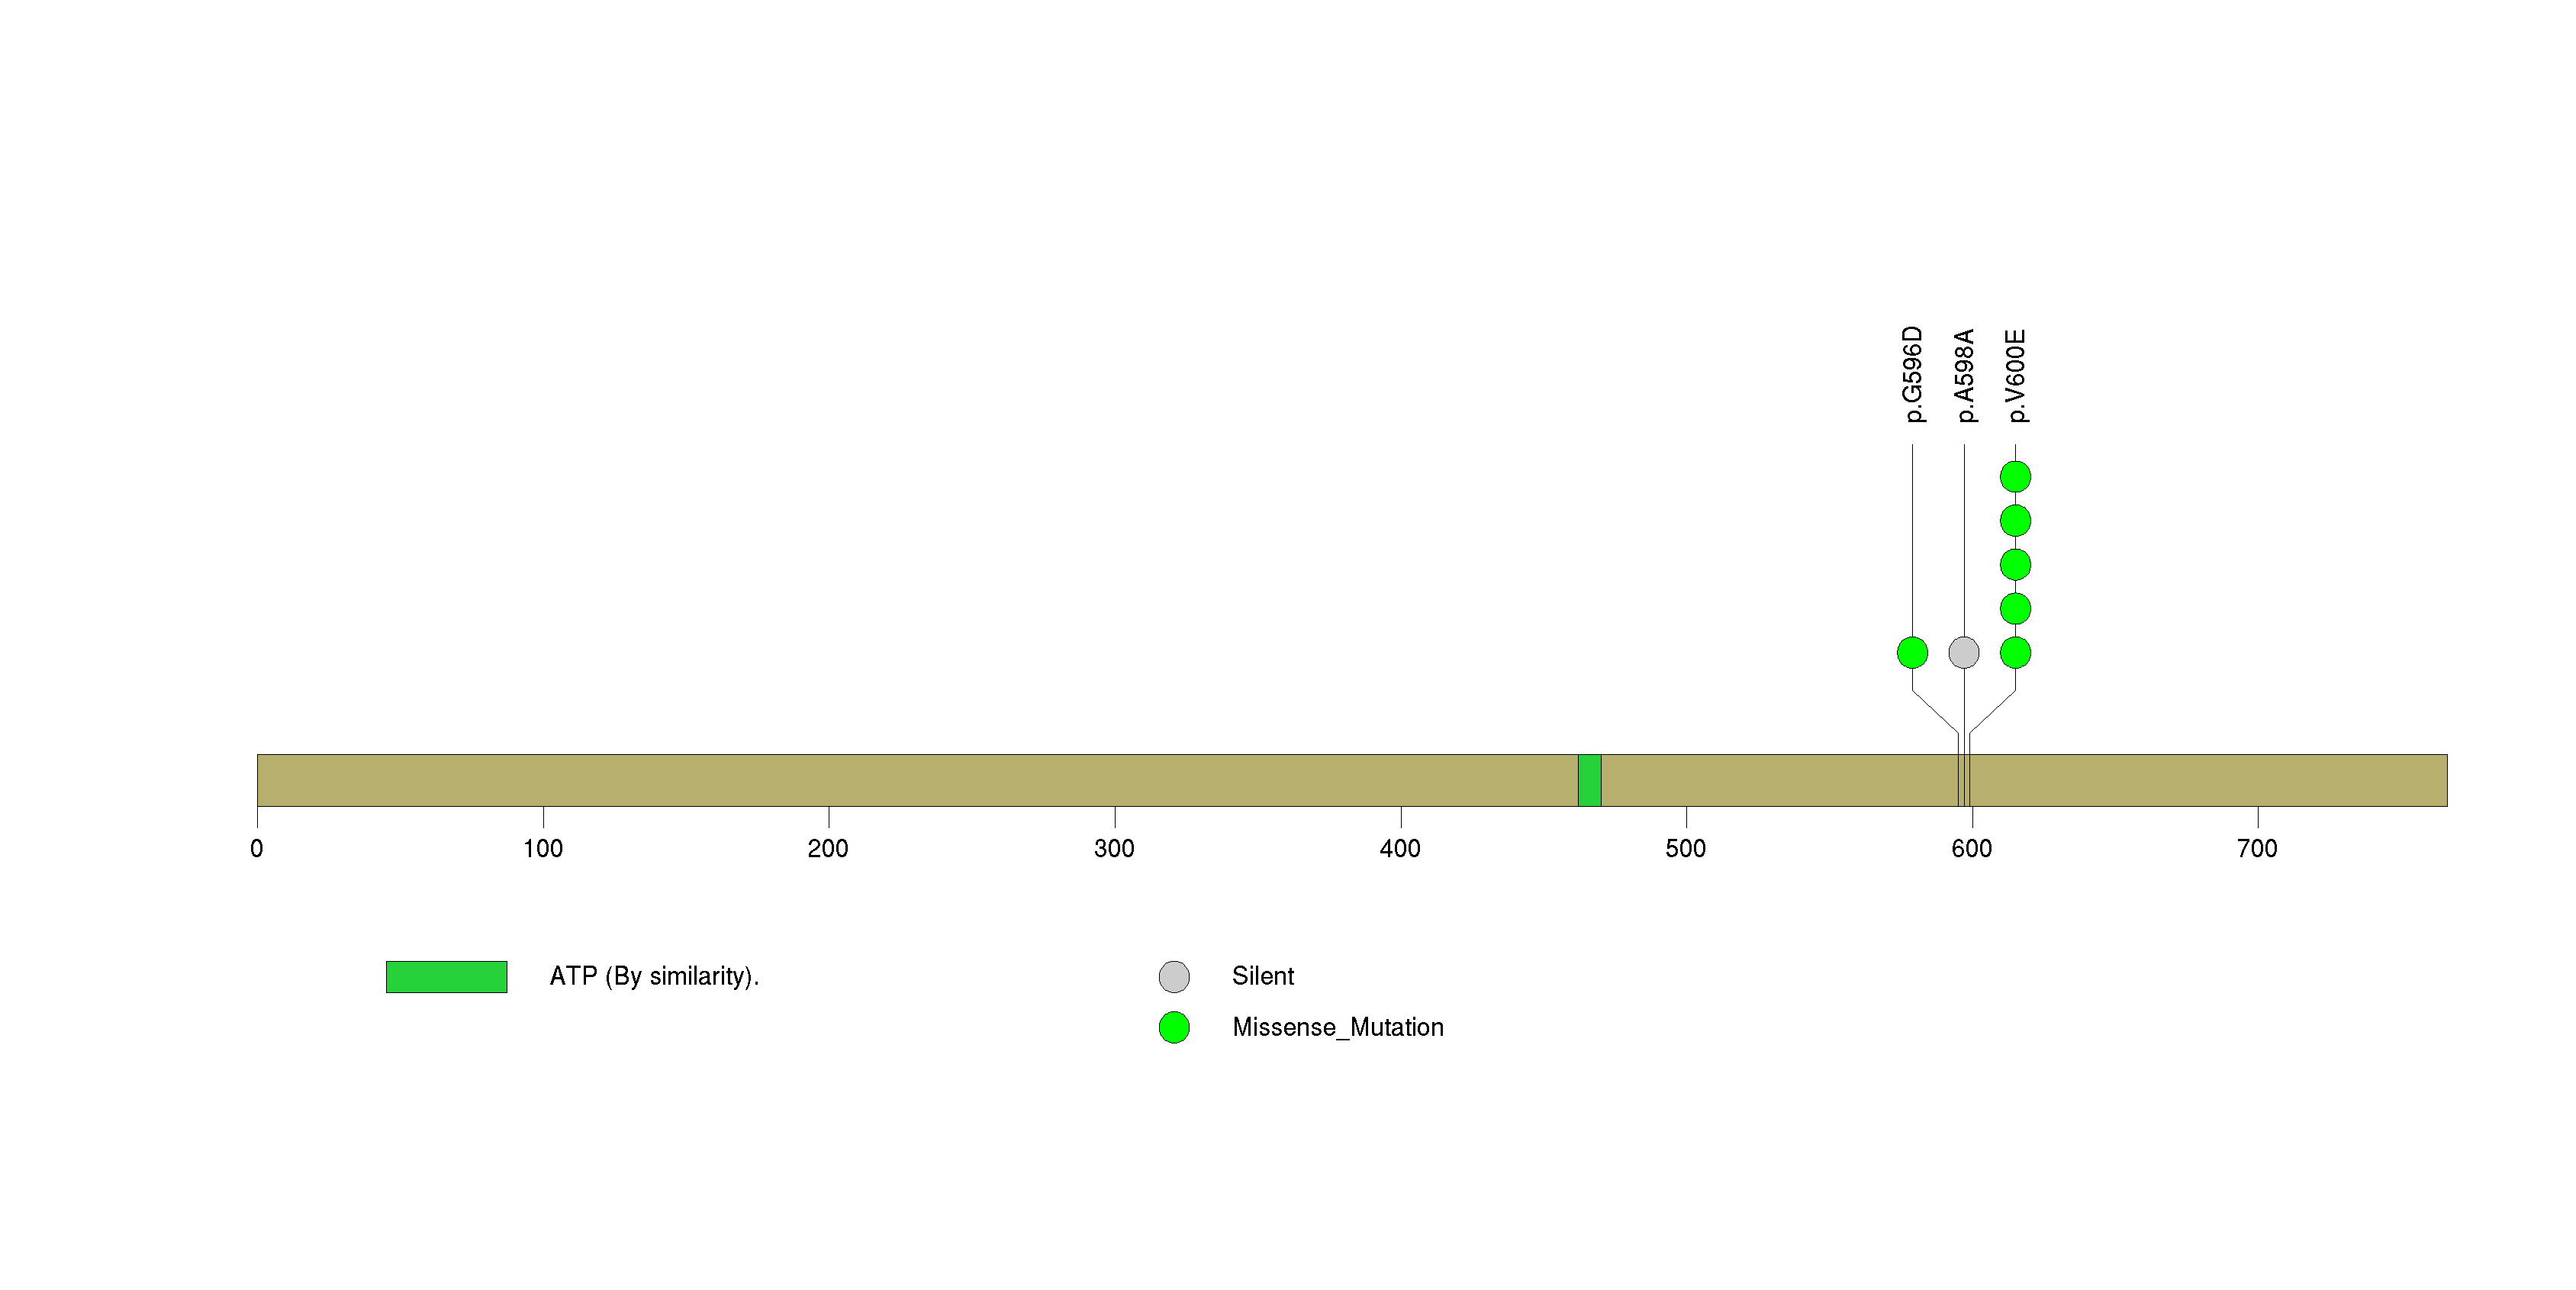
Figure S4. This figure depicts the distribution of mutations and mutation types across the IDH1 significant gene.
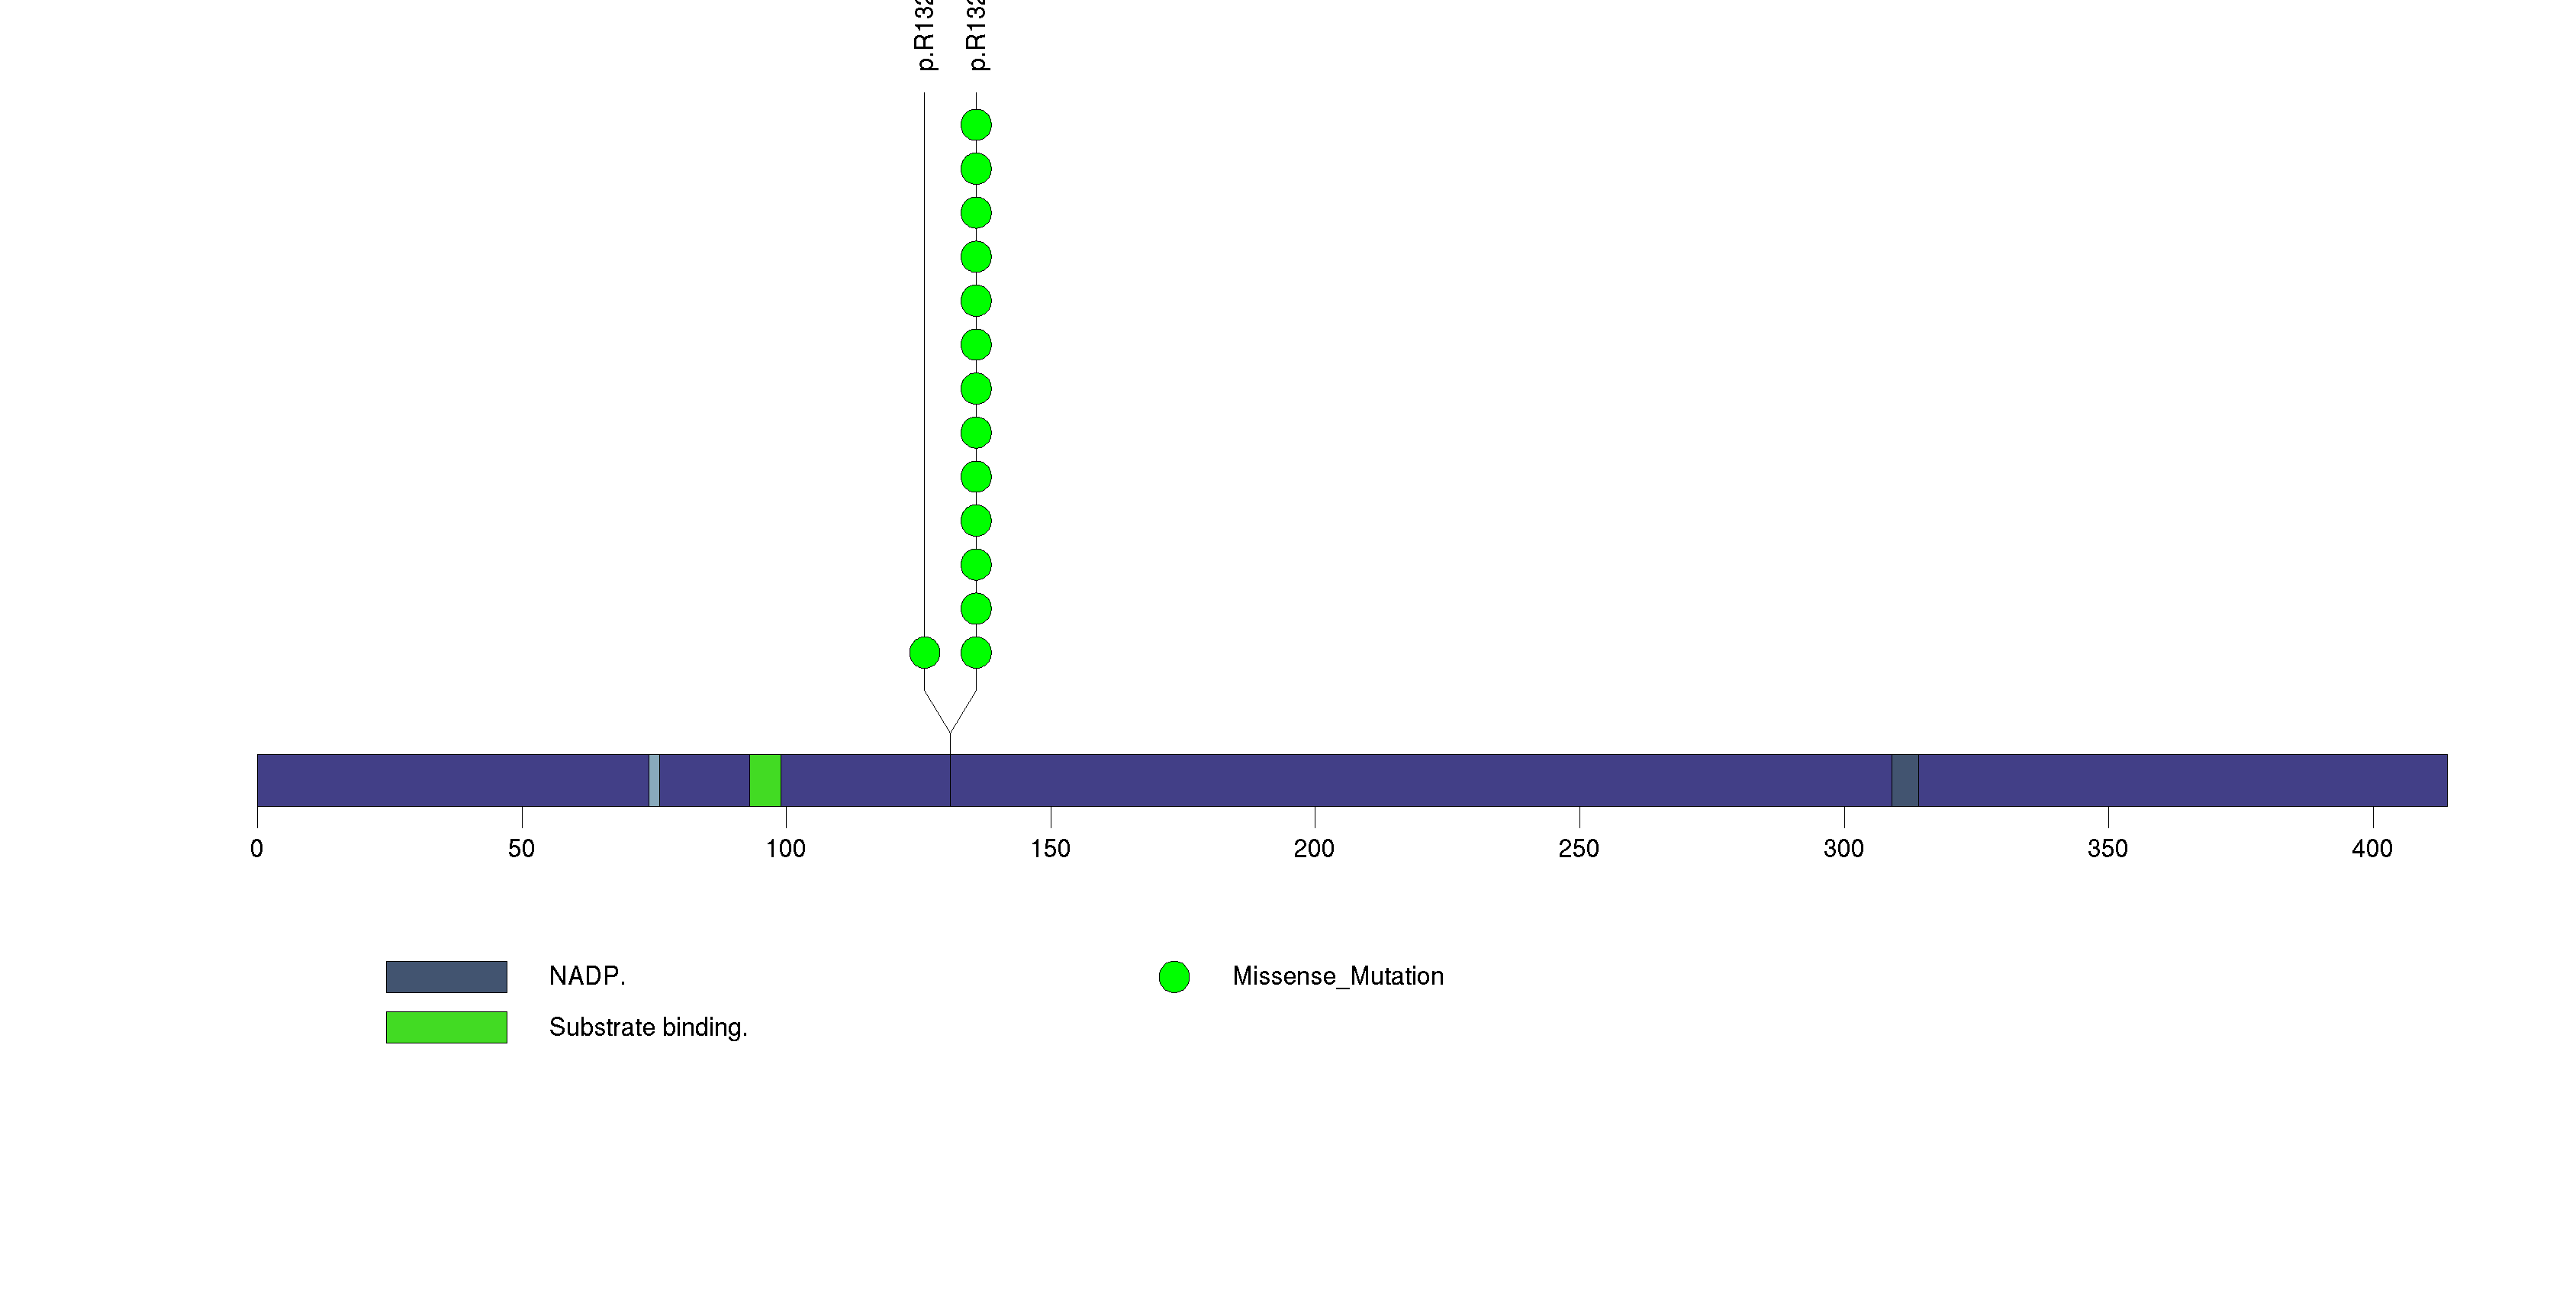
Figure S5. This figure depicts the distribution of mutations and mutation types across the TP53 significant gene.
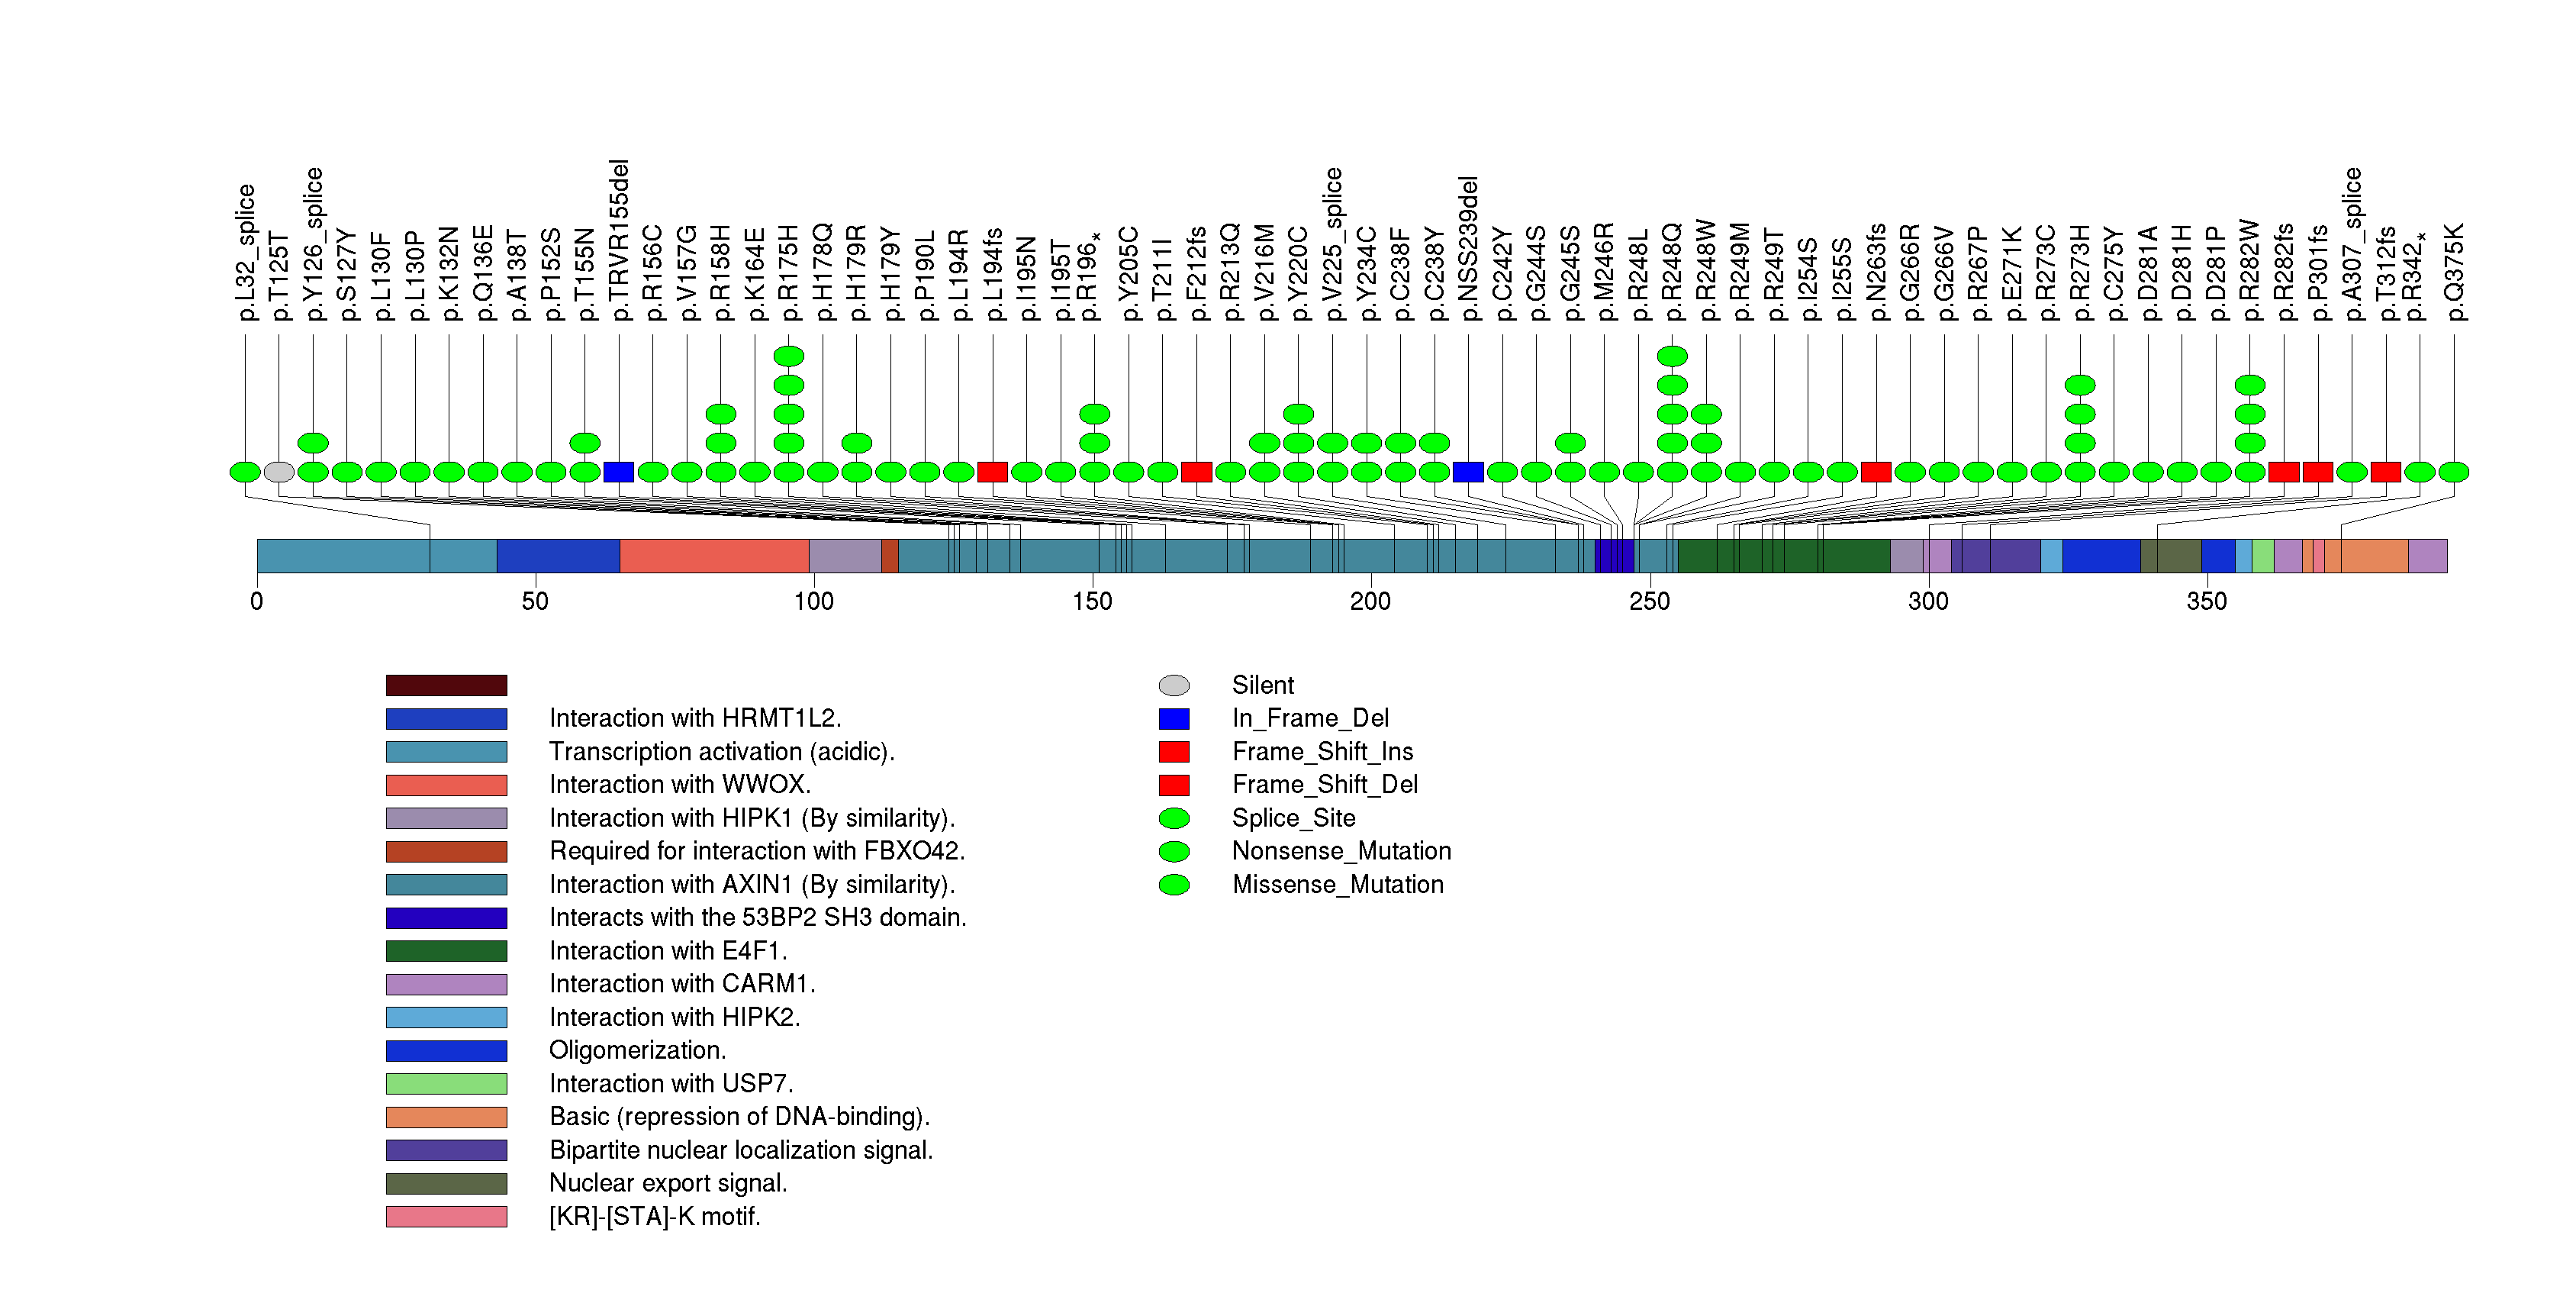
Figure S6. This figure depicts the distribution of mutations and mutation types across the PTEN significant gene.
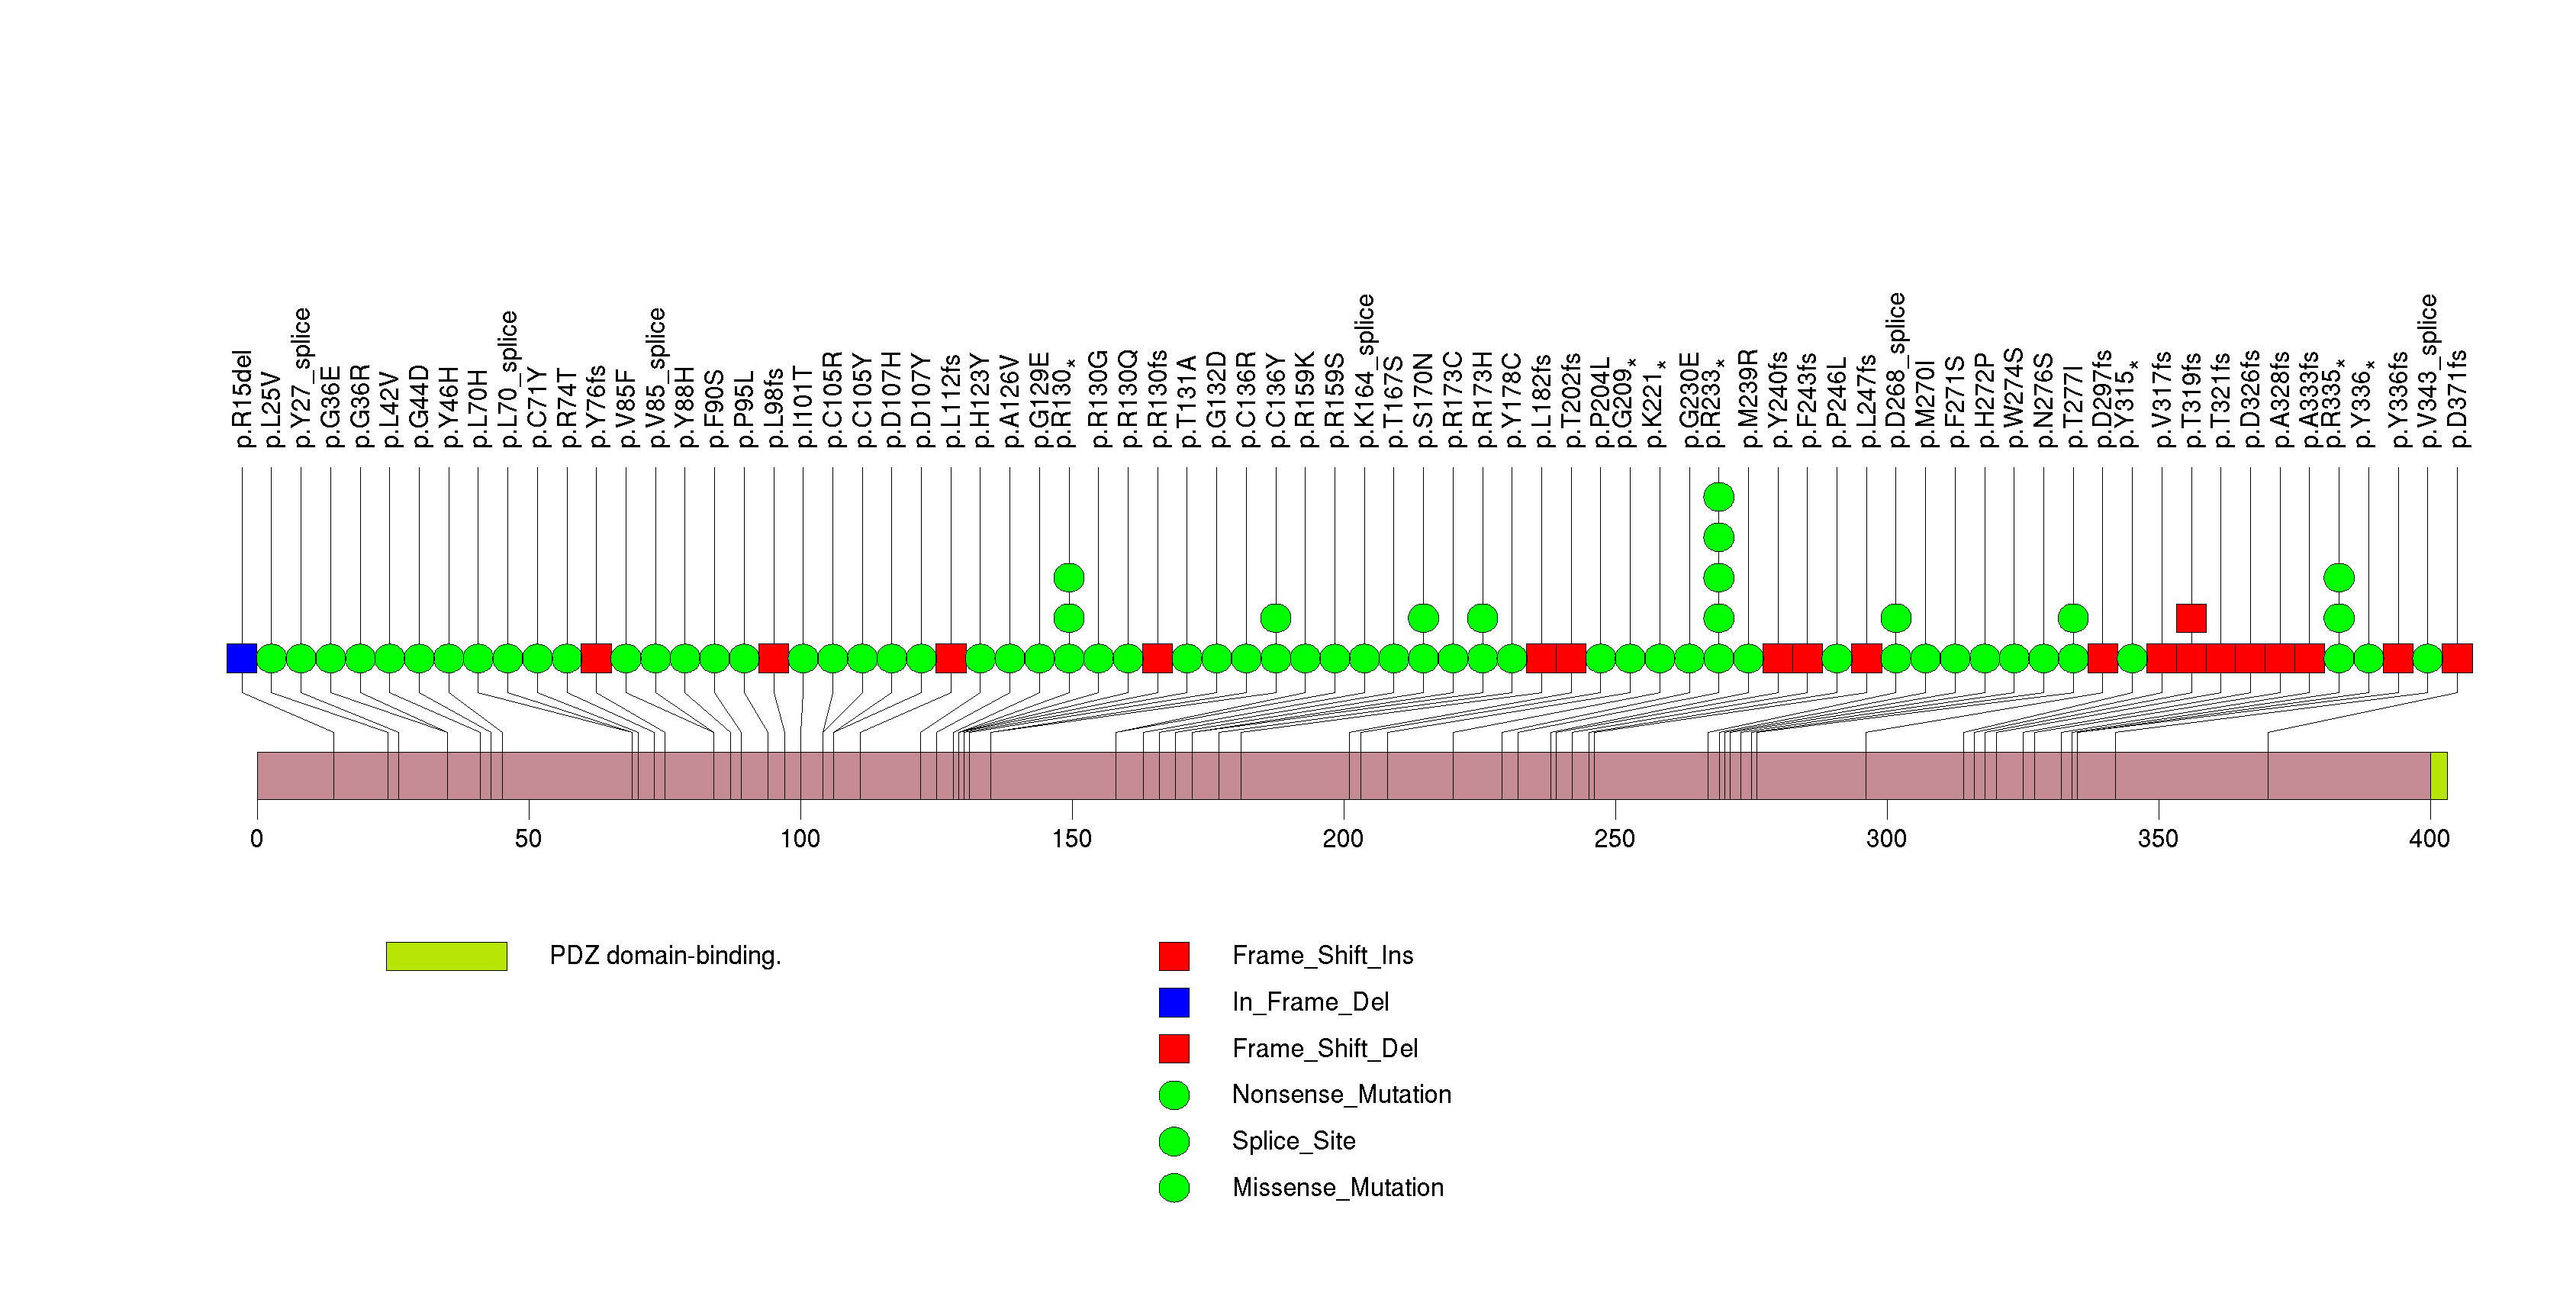
Figure S7. This figure depicts the distribution of mutations and mutation types across the PIK3CA significant gene.
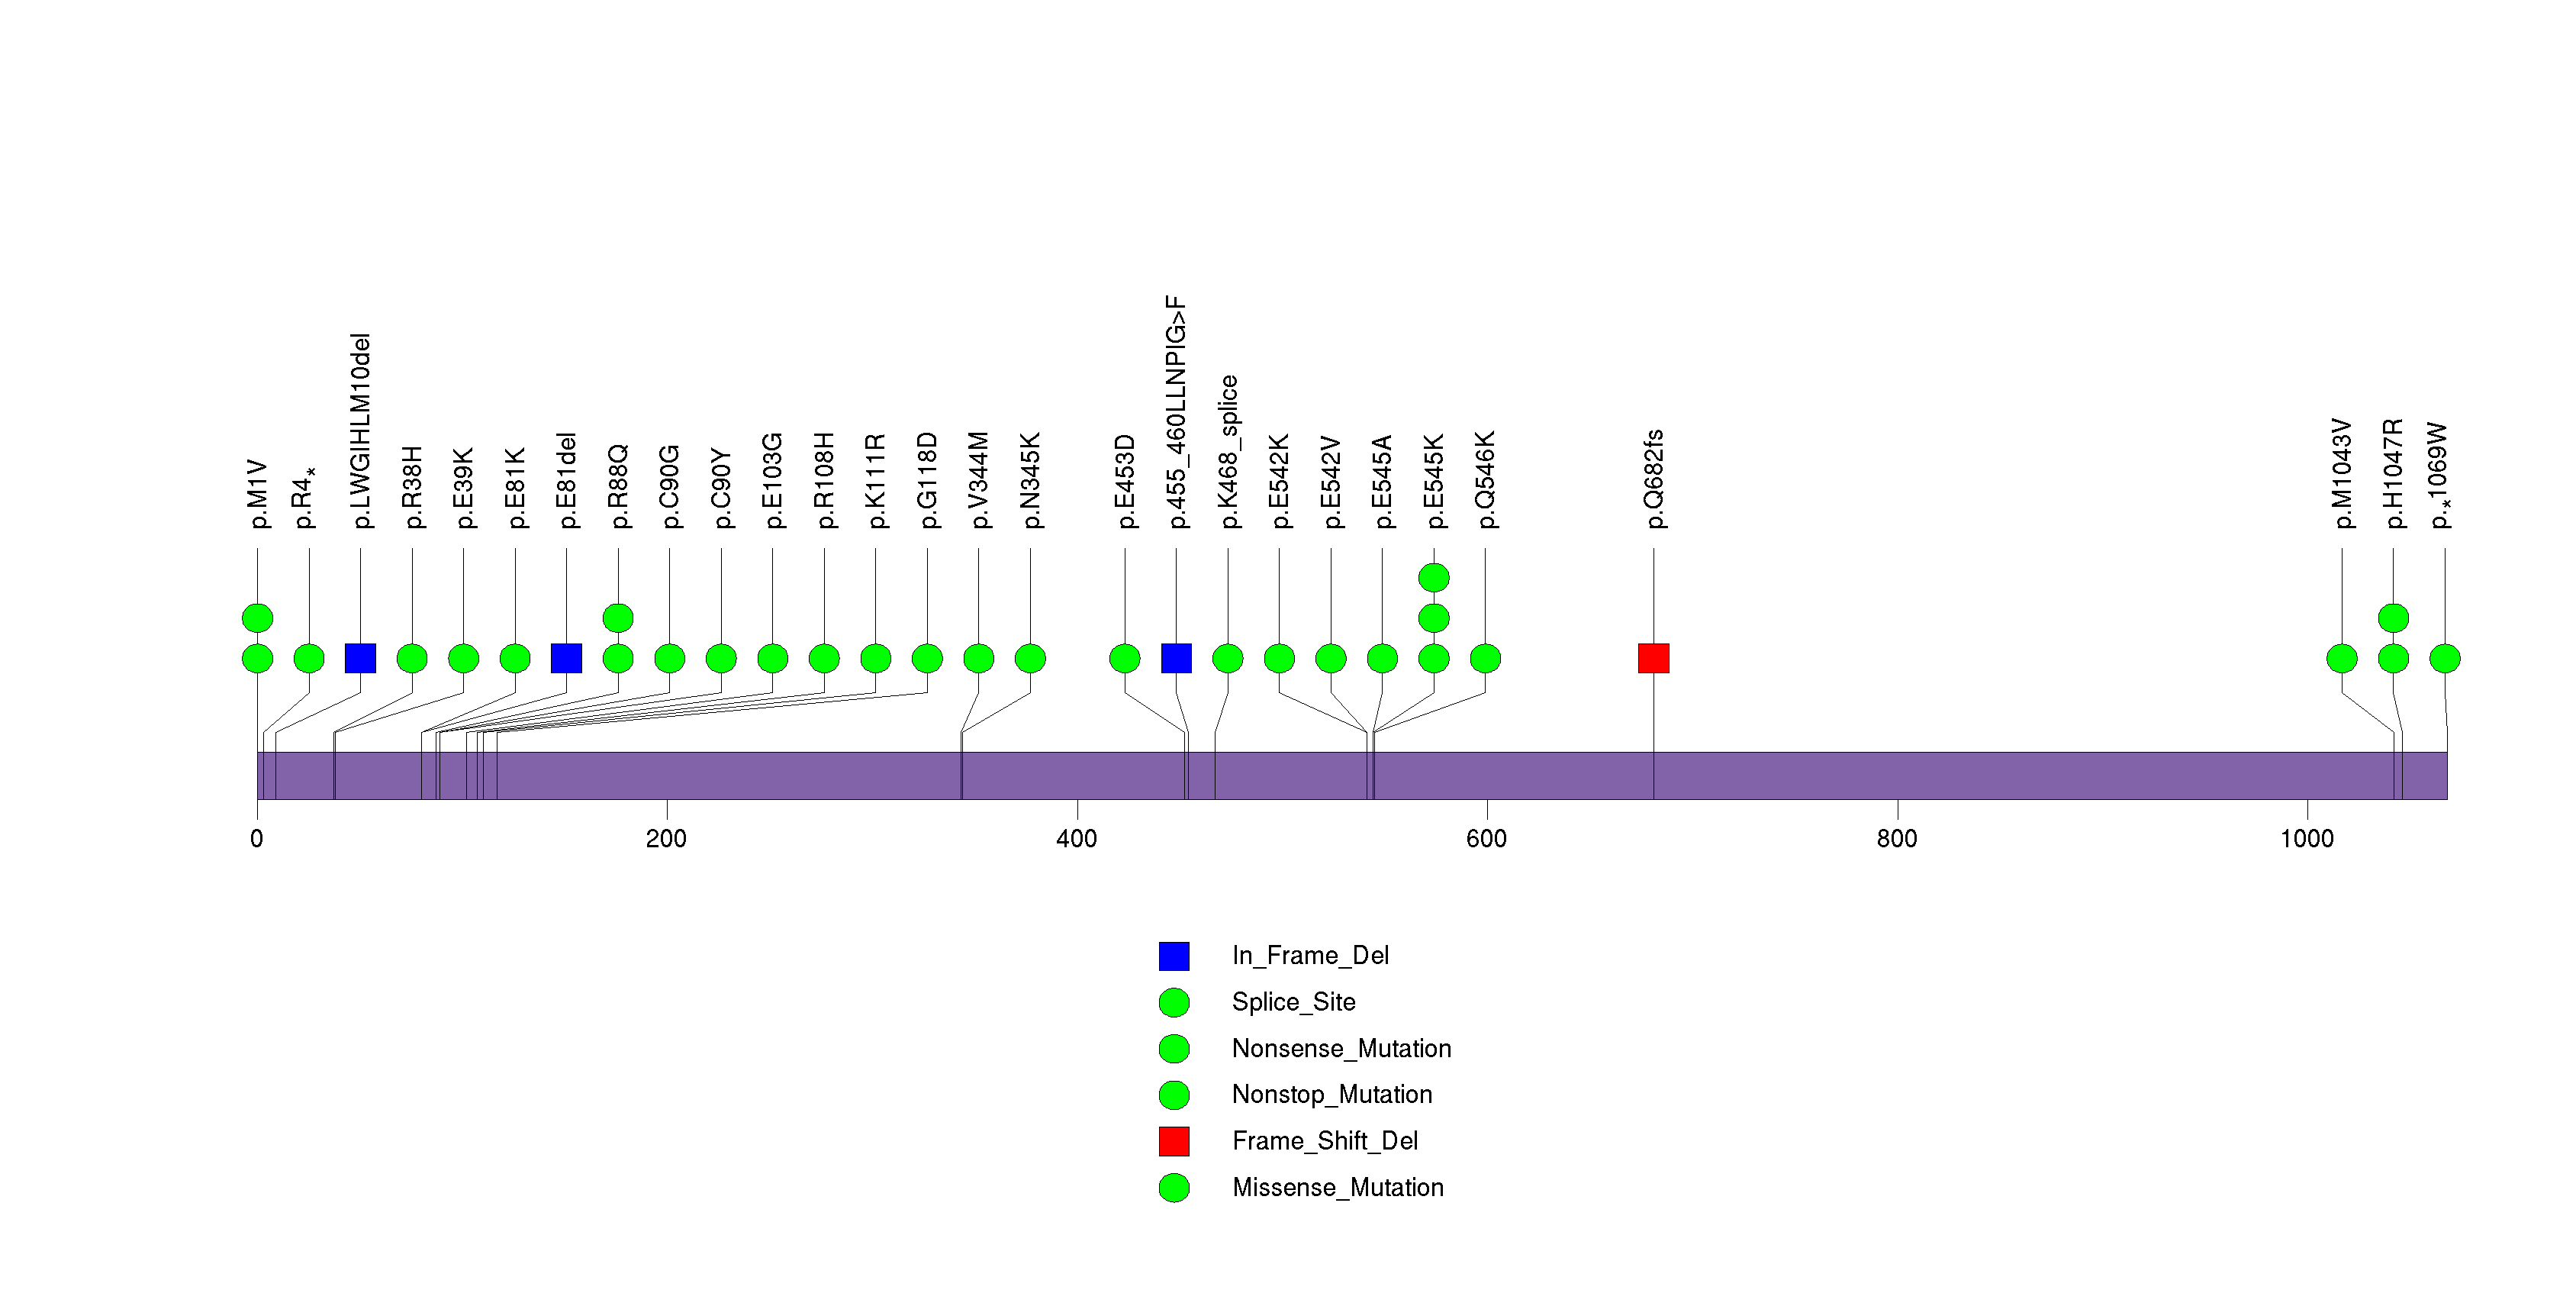
Figure S8. This figure depicts the distribution of mutations and mutation types across the RB1 significant gene.
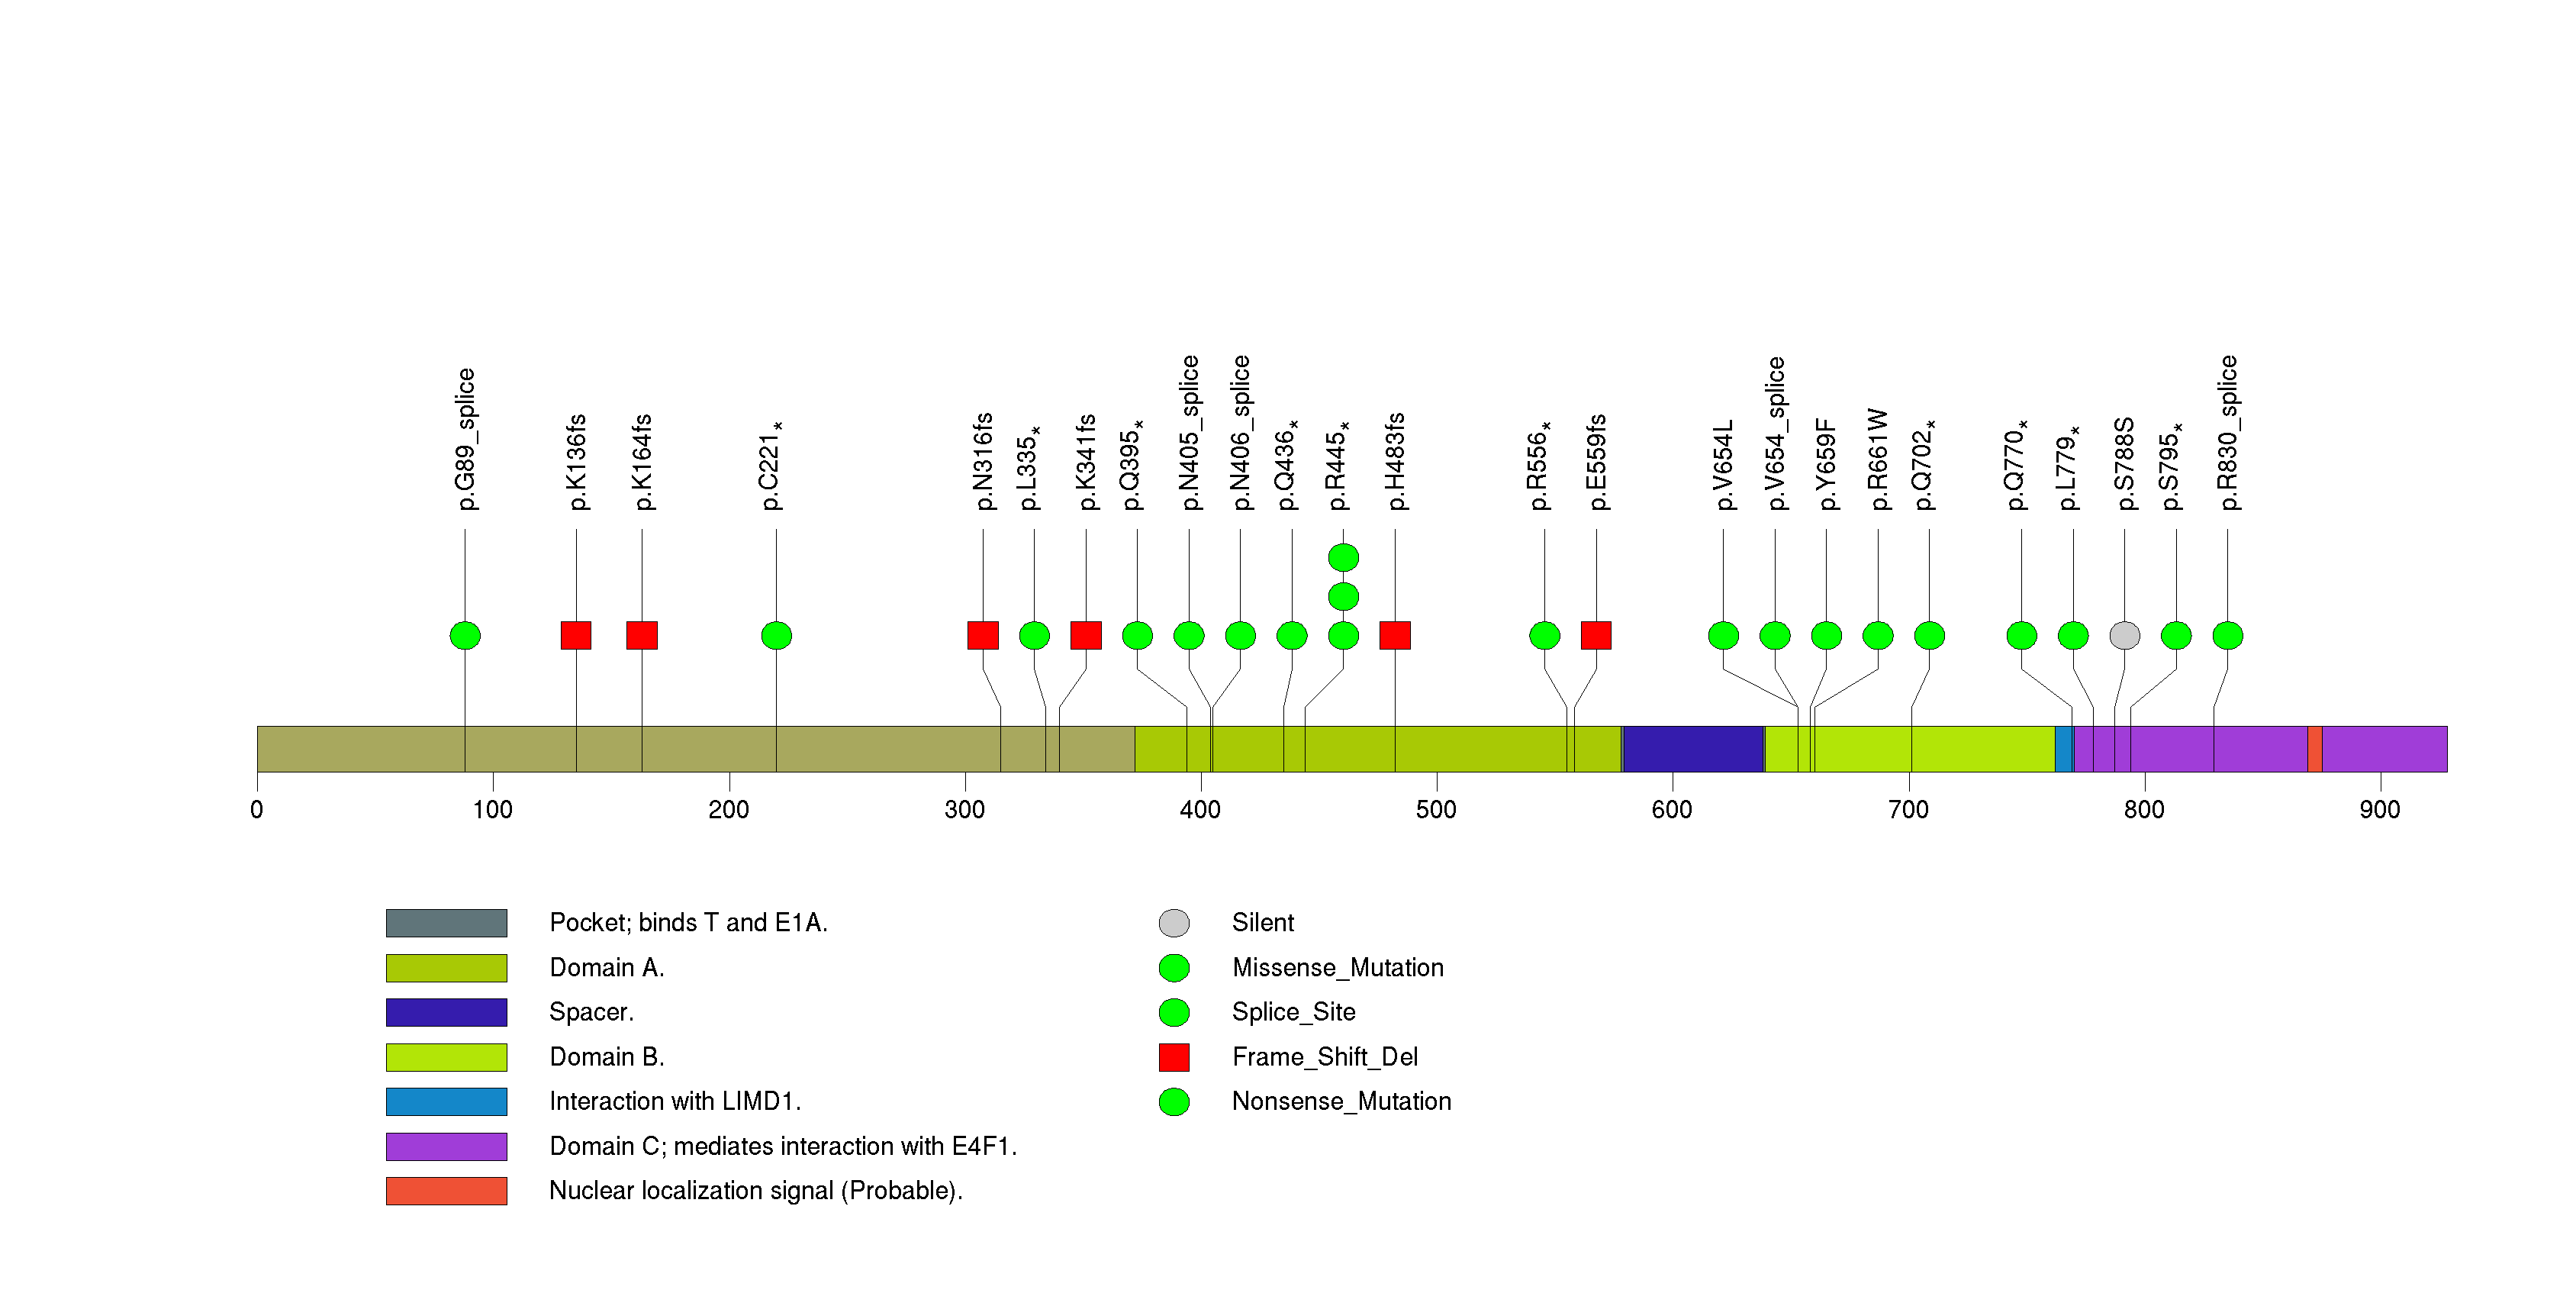
Figure S9. This figure depicts the distribution of mutations and mutation types across the NF1 significant gene.
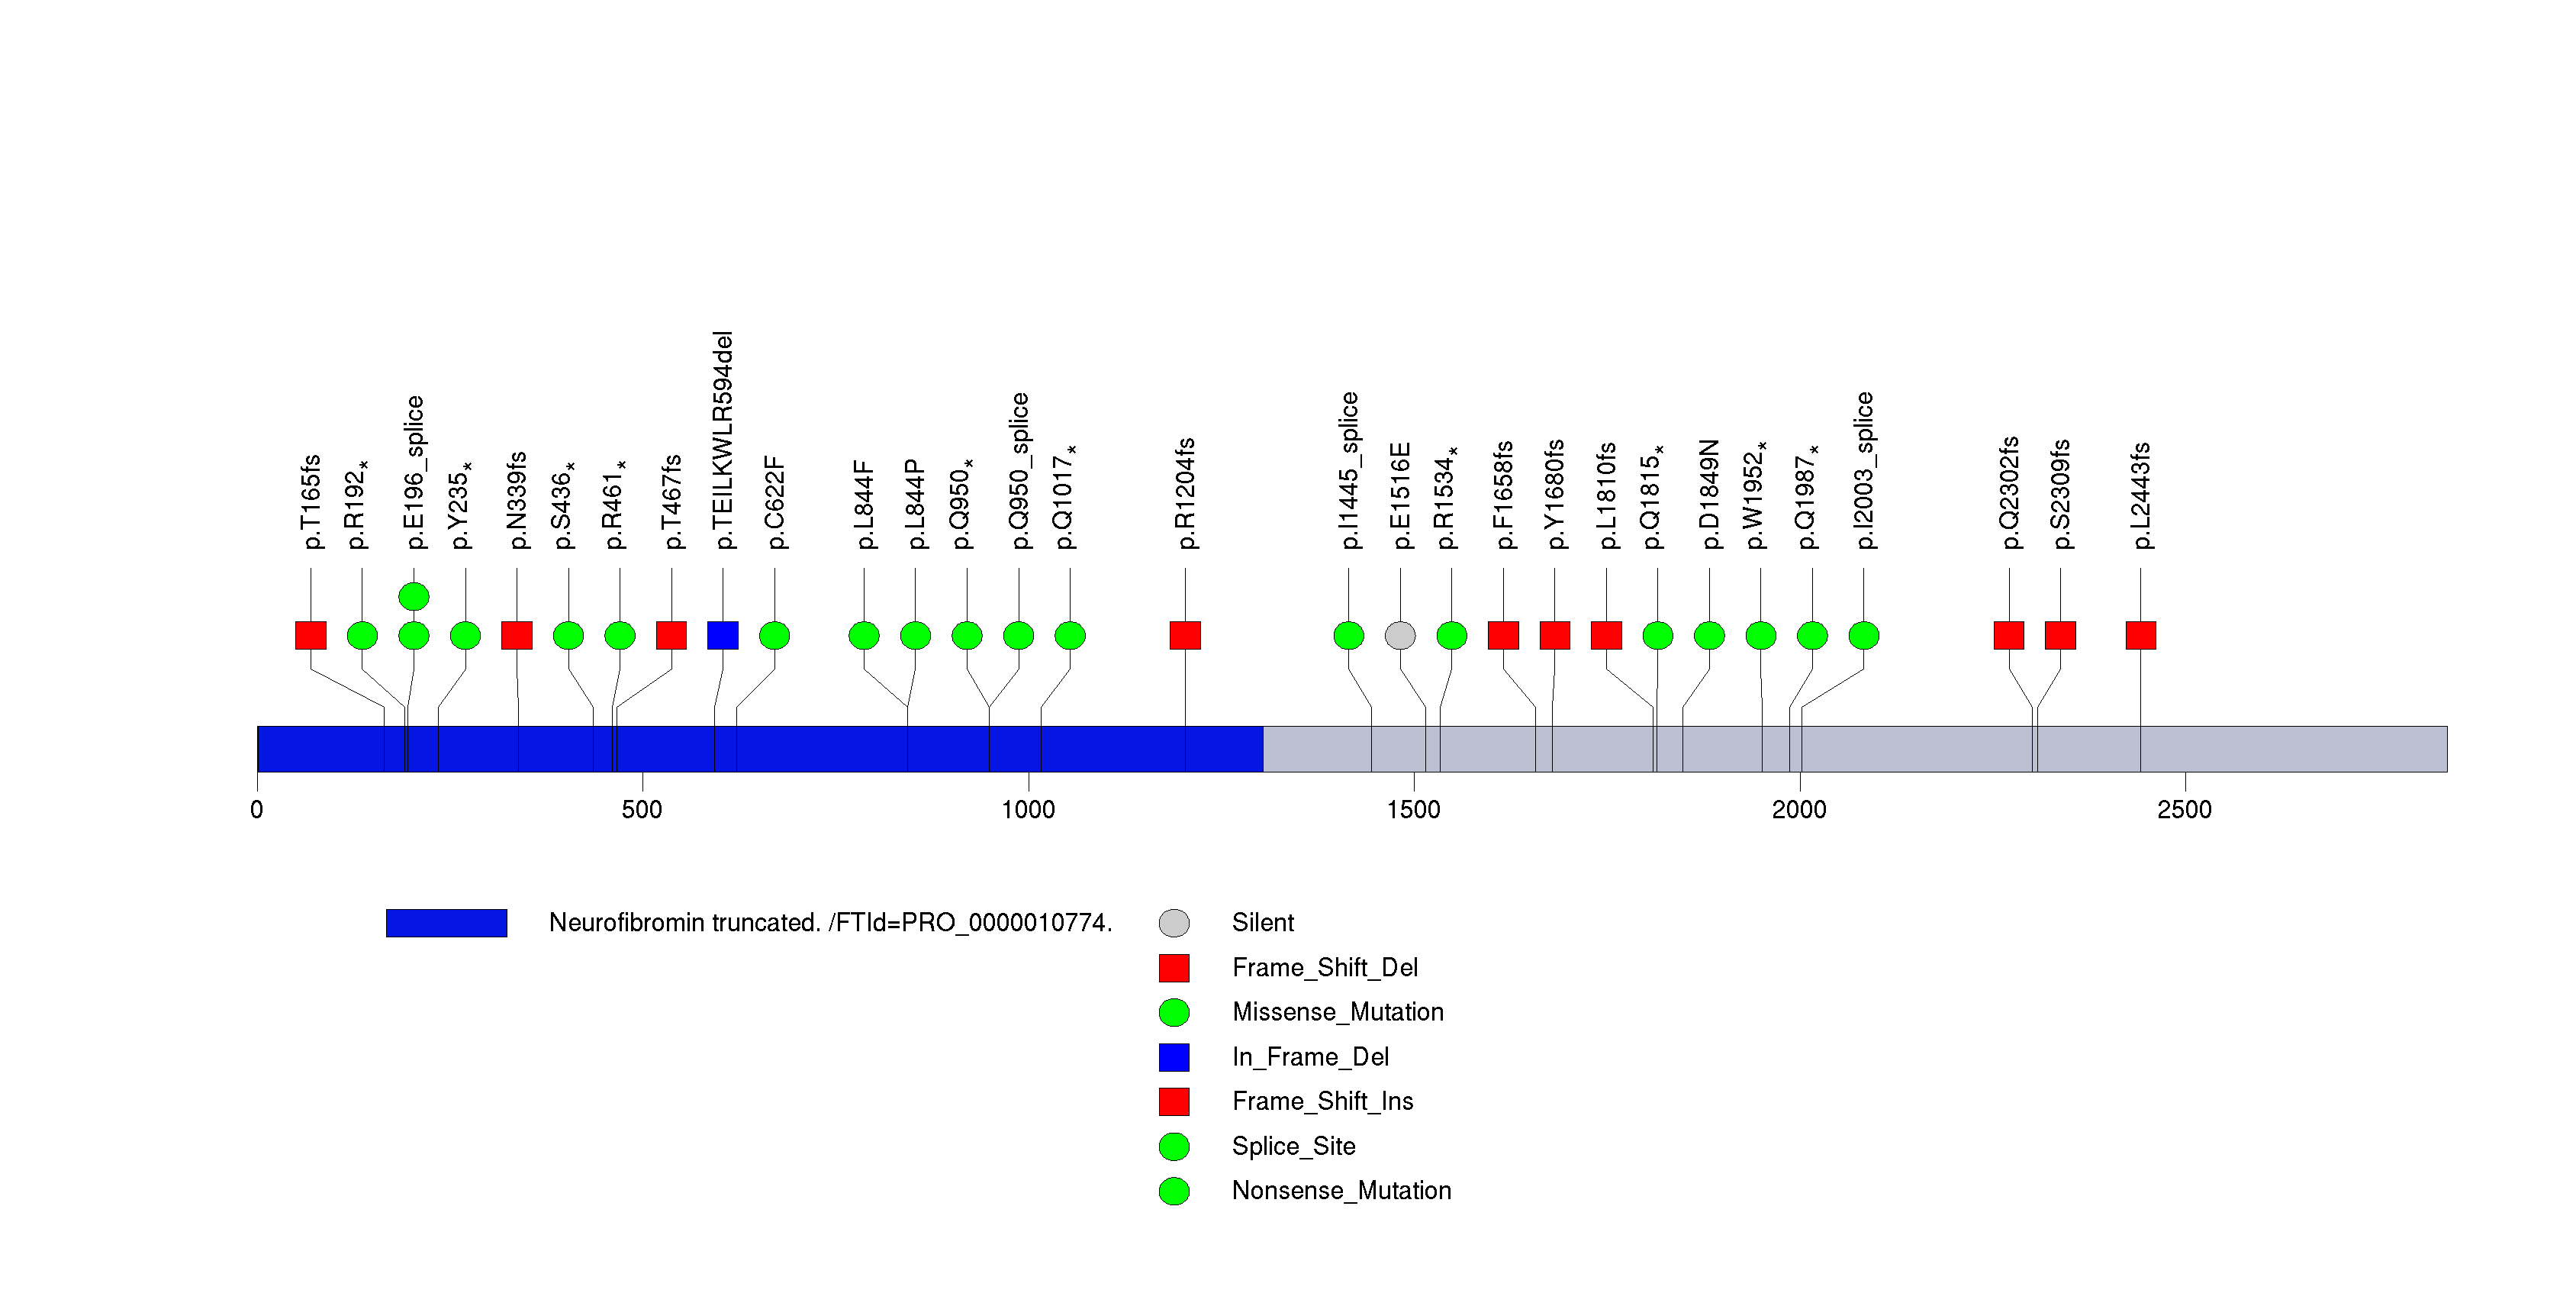
Figure S10. This figure depicts the distribution of mutations and mutation types across the STAG2 significant gene.
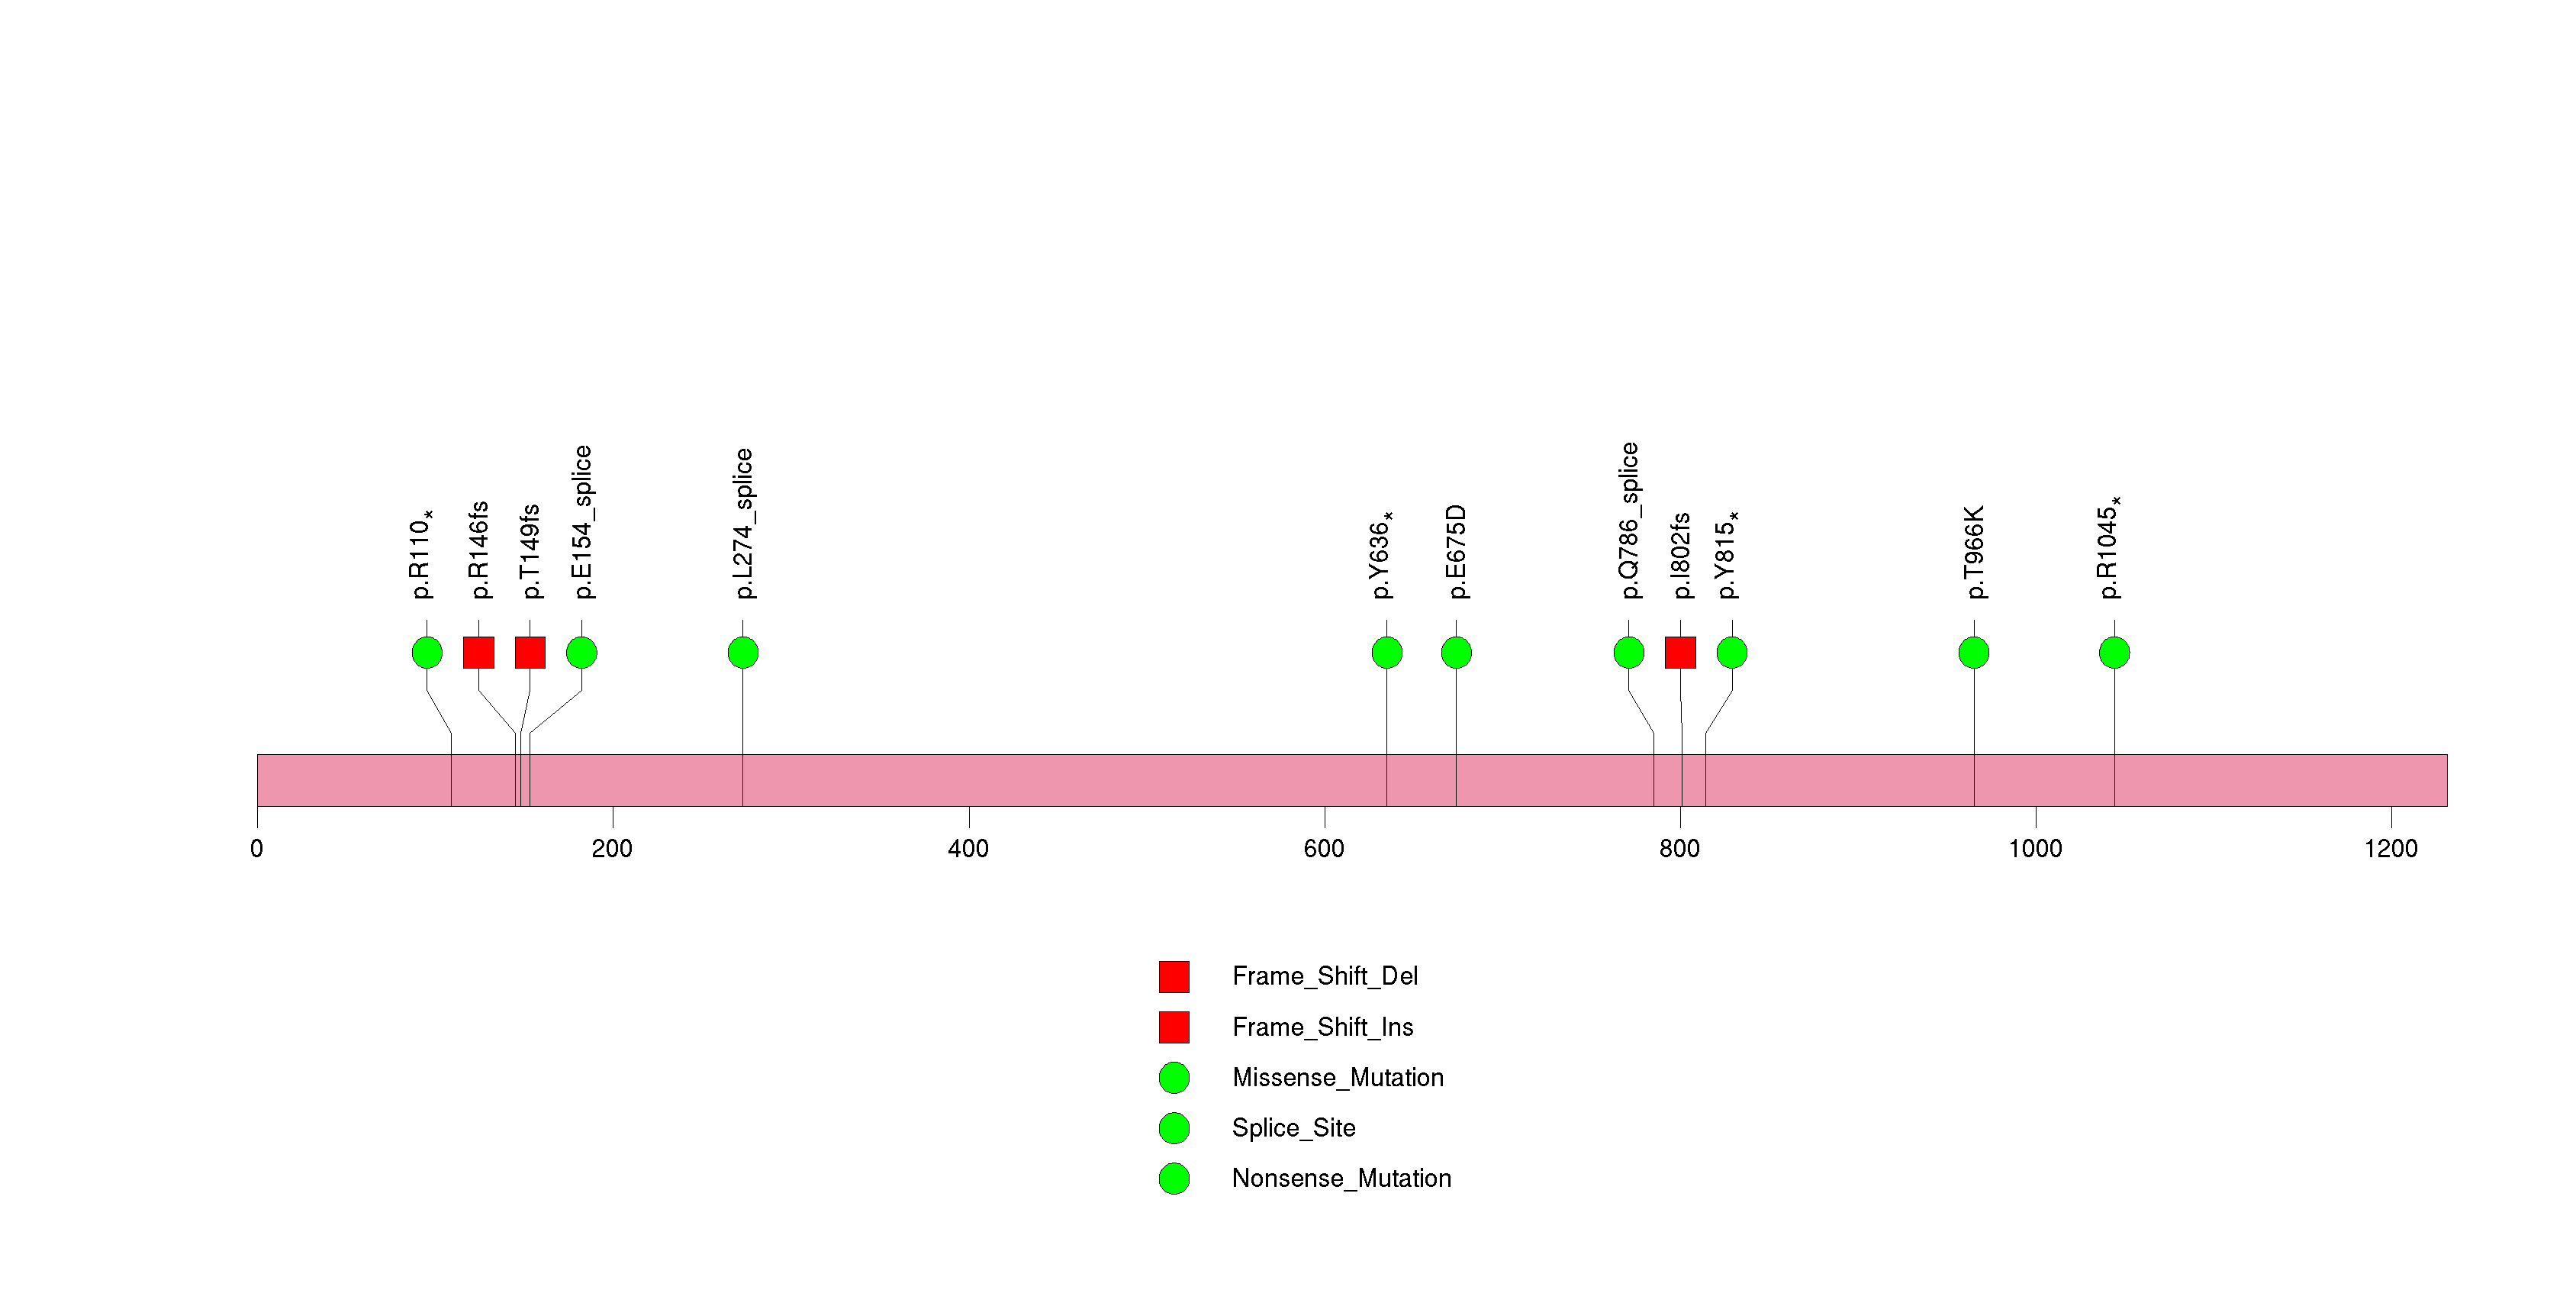
Figure S11. This figure depicts the distribution of mutations and mutation types across the CDC27 significant gene.
In this analysis, COSMIC is used as a filter to increase power by restricting the territory of each gene. Cosmic version: v48.
Table 4. Get Full Table Significantly mutated genes (COSMIC territory only). To access the database please go to: COSMIC. Number of significant genes found: 74. Number of genes displayed: 10
| rank | gene | description | n | cos | n_cos | N_cos | cos_ev | p | q |
|---|---|---|---|---|---|---|---|---|---|
| 1 | TP53 | tumor protein p53 | 96 | 356 | 92 | 100748 | 26305 | 0 | 0 |
| 2 | PTEN | phosphatase and tensin homolog (mutated in multiple advanced cancers 1) | 90 | 767 | 88 | 217061 | 3057 | 0 | 0 |
| 3 | IDH1 | isocitrate dehydrogenase 1 (NADP+), soluble | 14 | 5 | 14 | 1415 | 20888 | 5.8e-14 | 8.7e-11 |
| 4 | PIK3R1 | phosphoinositide-3-kinase, regulatory subunit 1 (alpha) | 33 | 33 | 13 | 9339 | 25 | 3.7e-13 | 4.2e-10 |
| 5 | PIK3CA | phosphoinositide-3-kinase, catalytic, alpha polypeptide | 33 | 220 | 25 | 62260 | 5654 | 2.3e-12 | 1.6e-09 |
| 6 | RB1 | retinoblastoma 1 (including osteosarcoma) | 26 | 267 | 17 | 75561 | 60 | 2.7e-12 | 1.6e-09 |
| 7 | NF1 | neurofibromin 1 (neurofibromatosis, von Recklinghausen disease, Watson disease) | 30 | 285 | 11 | 80655 | 23 | 2.8e-12 | 1.6e-09 |
| 8 | EGFR | epidermal growth factor receptor (erythroblastic leukemia viral (v-erb-b) oncogene homolog, avian) | 92 | 293 | 70 | 82919 | 1144 | 2.9e-12 | 1.6e-09 |
| 9 | BRAF | v-raf murine sarcoma viral oncogene homolog B1 | 6 | 89 | 6 | 25187 | 71896 | 1.5e-11 | 7.4e-09 |
| 10 | CHEK2 | CHK2 checkpoint homolog (S. pombe) | 4 | 2 | 3 | 566 | 3 | 1.9e-10 | 8.6e-08 |
Note:
n - number of (nonsilent) mutations in this gene across the individual set.
cos = number of unique mutated sites in this gene in COSMIC
n_cos = overlap between n and cos.
N_cos = number of individuals times cos.
cos_ev = total evidence: number of reports in COSMIC for mutations seen in this gene.
p = p-value for seeing the observed amount of overlap in this gene)
q = q-value, False Discovery Rate (Benjamini-Hochberg procedure)
Table 5. Get Full Table A Ranked List of Significantly Mutated Genesets. (Source: MSigDB GSEA Cannonical Pathway Set).Number of significant genesets found: 118. Number of genesets displayed: 10
| rank | geneset | description | genes | N_genes | mut_tally | N | n | npat | nsite | nsil | n1 | n2 | n3 | n4 | n5 | n6 | p_ns_s | p | q |
|---|---|---|---|---|---|---|---|---|---|---|---|---|---|---|---|---|---|---|---|
| 1 | MTORPATHWAY | Mammalian target of rapamycin (mTOR) senses mitogenic factors and nutrients, including ATP, and induces cell proliferation. | AKT1, EIF3S10, EIF4A1, EIF4A2, EIF4B, EIF4E, EIF4EBP1, EIF4G1, EIF4G2, EIF4G3, FKBP1A, FRAP1, MKNK1, PDK2, PDPK1, PIK3CA, PIK3R1, PPP2CA, PTEN, RPS6, RPS6KB1, TSC1, TSC2 | 21 | AKT1(1), EIF4A1(1), EIF4B(1), EIF4G1(1), EIF4G3(1), PIK3CA(33), PIK3R1(33), PTEN(90), TSC2(3) | 11773777 | 164 | 138 | 136 | 2 | 12 | 33 | 21 | 30 | 68 | 0 | 3.77e-15 | <1.00e-15 | <5.47e-14 |
| 2 | G1PATHWAY | CDK4/6-cyclin D and CDK2-cyclin E phosphorylate Rb, which allows the transcription of genes needed for the G1/S cell cycle transition. | ABL1, ATM, ATR, CCNA1, CCND1, CCNE1, CDC2, CDC25A, CDK2, CDK4, CDK6, CDKN1A, CDKN1B, CDKN2A, CDKN2B, DHFR, E2F1, GSK3B, HDAC1, MADH3, MADH4, RB1, SKP2, TFDP1, TGFB1, TGFB2, TGFB3, TP53 | 25 | ABL1(2), ATM(4), ATR(4), CCNA1(1), CCNE1(1), CDKN1A(1), CDKN1B(1), CDKN2A(2), CDKN2B(2), GSK3B(1), RB1(26), SKP2(1), TFDP1(1), TP53(96) | 12757976 | 143 | 103 | 104 | 4 | 31 | 18 | 15 | 34 | 44 | 1 | 3.44e-13 | <1.00e-15 | <5.47e-14 |
| 3 | APOPTOSIS_GENMAPP | APAF1, BAK1, BCL2L7P1, BAX, BCL2, BCL2L1, BID, BIRC2, BIRC3, BIRC4, CASP2, CASP3, CASP6, CASP7, CASP8, CASP9, CYCS, FADD, FAS, FASLG, GZMB, IKBKG, JUN, MAP2K4, MAP3K1, MAP3K14, MAPK10, MCL1, MDM2, MYC, NFKB1, NFKBIA, PARP1, PRF1, RELA, RIPK1, TNF, TNFRSF1A, TNFRSF1B, TNFSF10, TP53, TRADD, TRAF1, TRAF2 | 41 | BCL2(2), BIRC2(1), BIRC3(1), CASP9(1), GZMB(2), MAP3K1(6), MCL1(1), MDM2(2), MYC(1), NFKB1(1), NFKBIA(1), PARP1(2), RIPK1(1), TNFRSF1A(1), TNFRSF1B(1), TNFSF10(2), TP53(96), TRAF1(1) | 15966939 | 123 | 95 | 84 | 9 | 35 | 20 | 15 | 29 | 24 | 0 | 2.31e-09 | <1.00e-15 | <5.47e-14 | |
| 4 | PDGFPATHWAY | Platelet-derived growth factor (PDGF) receptor is phosphorylated on ligand binding and promotes cell proliferation. | CSNK2A1, ELK1, FOS, GRB2, HRAS, JAK1, JUN, MAP2K1, MAP2K4, MAP3K1, MAPK3, MAPK8, PDGFA, PDGFRA, PIK3CA, PIK3R1, PLCG1, PRKCA, PRKCB1, RAF1, RASA1, SHC1, SOS1, SRF, STAT1, STAT3, STAT5A | 26 | ELK1(2), FOS(1), JAK1(2), MAP2K1(1), MAP3K1(6), MAPK3(1), PDGFRA(13), PIK3CA(33), PIK3R1(33), PLCG1(6), PRKCA(1), RAF1(1), SOS1(3), SRF(1), STAT1(2), STAT3(1) | 14833818 | 107 | 91 | 93 | 6 | 10 | 24 | 17 | 24 | 32 | 0 | 3.22e-07 | <1.00e-15 | <5.47e-14 |
| 5 | CHEMICALPATHWAY | DNA damage promotes Bid cleavage, which stimulates mitochondrial cytochrome c release and consequent caspase activation, resulting in apoptosis. | ADPRT, AKT1, APAF1, ATM, BAD, BAX, BCL2, BCL2L1, BID, CASP3, CASP6, CASP7, CASP9, CYCS, EIF2S1, PRKCA, PRKCB1, PTK2, PXN, STAT1, TLN1, TP53 | 20 | AKT1(1), ATM(4), BCL2(2), CASP9(1), PRKCA(1), PXN(1), STAT1(2), TP53(96) | 11683717 | 108 | 89 | 71 | 2 | 30 | 16 | 13 | 26 | 23 | 0 | 1.18e-11 | <1.00e-15 | <5.47e-14 |
| 6 | TERTPATHWAY | hTERC, the RNA subunit of telomerase, and hTERT, the catalytic protein subunit, are required for telomerase activity and are overexpressed in many cancers. | HDAC1, MAX, MYC, SP1, SP3, TP53, WT1, ZNF42 | 7 | MAX(2), MYC(1), SP1(1), SP3(1), TP53(96), WT1(2) | 2998025 | 103 | 84 | 66 | 3 | 30 | 17 | 11 | 25 | 20 | 0 | 1.64e-11 | <1.00e-15 | <5.47e-14 |
| 7 | CREBPATHWAY | CREB is a transcription factor that binds to cAMP-responsive elements (CREs) to activate transcription in response to extracellular signaling. | ADCY1, AKT1, CAMK2A, CAMK2B, CAMK2D, CAMK2G, CREB1, GNAS, GRB2, HRAS, MAPK1, MAPK14, MAPK3, PIK3CA, PIK3R1, PRKACB, PRKACG, PRKAR1A, PRKAR1B, PRKAR2A, PRKAR2B, PRKCA, PRKCB1, RAC1, RPS6KA1, RPS6KA5, SOS1 | 26 | ADCY1(3), AKT1(1), CAMK2A(1), CREB1(1), MAPK1(2), MAPK3(1), PIK3CA(33), PIK3R1(33), PRKAR1B(1), PRKAR2B(1), PRKCA(1), RPS6KA1(1), RPS6KA5(1), SOS1(3) | 12403154 | 83 | 74 | 72 | 1 | 13 | 14 | 13 | 16 | 27 | 0 | 4.08e-08 | <1.00e-15 | <5.47e-14 |
| 8 | NGFPATHWAY | Nerve growth factor (NGF) stimulates neural survival and proliferation via the TrkA and p75 receptors, which induce DAG and IP3 production and activate Ras. | CSNK2A1, DPM2, ELK1, FOS, GRB2, HRAS, JUN, KLK2, MAP2K1, MAPK3, MAPK8, NGFB, NGFR, PIK3CA, PIK3R1, PLCG1, RAF1, SHC1, SOS1 | 18 | ELK1(2), FOS(1), MAP2K1(1), MAPK3(1), PIK3CA(33), PIK3R1(33), PLCG1(6), RAF1(1), SOS1(3) | 8135723 | 81 | 72 | 70 | 1 | 8 | 13 | 14 | 18 | 28 | 0 | 6.60e-08 | <1.00e-15 | <5.47e-14 |
| 9 | PLCPATHWAY | Phospholipase C hydrolyzes the membrane lipid PIP2 to DAG, which activates protein kinase C, and IP3, which causes calcium influx. | AKT1, PIK3CA, PIK3R1, PLCB1, PLCG1, PRKCA, PRKCB1, VAV1 | 7 | AKT1(1), PIK3CA(33), PIK3R1(33), PLCB1(1), PLCG1(6), PRKCA(1), VAV1(4) | 5434302 | 79 | 70 | 68 | 3 | 8 | 13 | 13 | 16 | 29 | 0 | 8.88e-06 | <1.00e-15 | <5.47e-14 |
| 10 | RBPATHWAY | The ATM protein kinase recognizes DNA damage and blocks cell cycle progression by phosphorylating chk1 and p53, which normally inhibits Rb to allow G1/S transitions. | ATM, CDC2, CDC25A, CDC25B, CDC25C, CDK2, CDK4, CHEK1, MYT1, RB1, TP53, WEE1, YWHAH | 12 | ATM(4), CHEK1(3), RB1(26), TP53(96), WEE1(1), YWHAH(1) | 7486740 | 131 | 95 | 92 | 2 | 31 | 15 | 14 | 28 | 42 | 1 | 6.87e-13 | 1.11e-15 | 5.47e-14 |
In brief, we tabulate the number of mutations and the number of covered bases for each gene. The counts are broken down by mutation context category: four context categories that are discovered by MutSig, and one for indel and 'null' mutations, which include indels, nonsense mutations, splice-site mutations, and non-stop (read-through) mutations. For each gene, we calculate the probability of seeing the observed constellation of mutations, i.e. the product P1 x P2 x ... x Pm, or a more extreme one, given the background mutation rates calculated across the dataset. [1]
In addition to the links below, the full results of the analysis summarized in this report can also be downloaded programmatically using firehose_get, or interactively from either the Broad GDAC website or TCGA Data Coordination Center Portal.