This pipeline computes the correlation between significantly recurrent gene mutations and selected clinical features.
Testing the association between mutation status of 2 genes and 10 clinical features across 64 patients, 2 significant findings detected with Q value < 0.25.
-
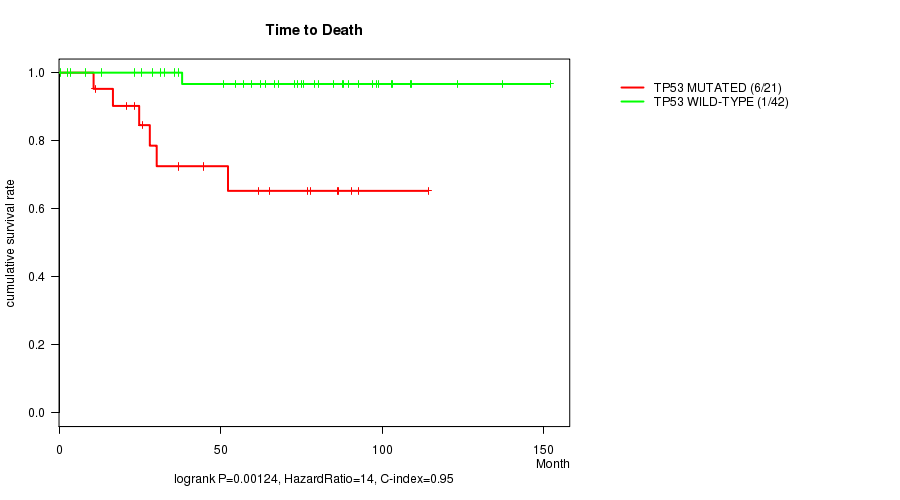
TP53 mutation correlated to 'Time to Death'.
-
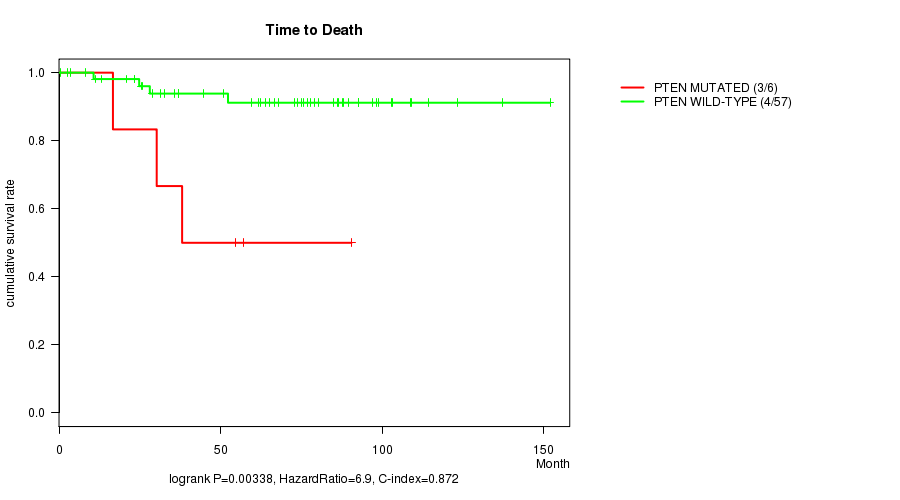
PTEN mutation correlated to 'Time to Death'.
Table 1. Get Full Table Overview of the association between mutation status of 2 genes and 10 clinical features. Shown in the table are P values (Q values). Thresholded by Q value < 0.25, 2 significant findings detected.
|
Clinical Features |
Time to Death |
AGE |
NEOPLASM DISEASESTAGE |
PATHOLOGY T STAGE |
PATHOLOGY N STAGE |
PATHOLOGY M STAGE |
GENDER |
KARNOFSKY PERFORMANCE SCORE |
NUMBERPACKYEARSSMOKED | YEAROFTOBACCOSMOKINGONSET | ||
| nMutated (%) | nWild-Type | logrank test | t-test | Fisher's exact test | Fisher's exact test | Fisher's exact test | Fisher's exact test | Fisher's exact test | t-test | t-test | t-test | |
| TP53 | 21 (33%) | 43 |
0.00124 (0.0198) |
0.973 (1.00) |
0.29 (1.00) |
0.359 (1.00) |
0.036 (0.504) |
0.126 (1.00) |
1 (1.00) |
0.146 (1.00) |
0.777 (1.00) |
|
| PTEN | 6 (9%) | 58 |
0.00338 (0.0508) |
0.402 (1.00) |
0.0594 (0.719) |
0.0553 (0.719) |
0.0874 (0.962) |
0.664 (1.00) |
0.199 (1.00) |
P value = 0.00124 (logrank test), Q value = 0.02
Table S1. Gene #1: 'TP53 MUTATION STATUS' versus Clinical Feature #1: 'Time to Death'
| nPatients | nDeath | Duration Range (Median), Month | |
|---|---|---|---|
| ALL | 63 | 7 | 0.6 - 151.9 (63.9) |
| TP53 MUTATED | 21 | 6 | 10.7 - 114.2 (44.8) |
| TP53 WILD-TYPE | 42 | 1 | 0.6 - 151.9 (70.3) |
Figure S1. Get High-res Image Gene #1: 'TP53 MUTATION STATUS' versus Clinical Feature #1: 'Time to Death'
P value = 0.00338 (logrank test), Q value = 0.051
Table S2. Gene #2: 'PTEN MUTATION STATUS' versus Clinical Feature #1: 'Time to Death'
| nPatients | nDeath | Duration Range (Median), Month | |
|---|---|---|---|
| ALL | 63 | 7 | 0.6 - 151.9 (63.9) |
| PTEN MUTATED | 6 | 3 | 16.7 - 90.5 (46.4) |
| PTEN WILD-TYPE | 57 | 4 | 0.6 - 151.9 (66.5) |
Figure S2. Get High-res Image Gene #2: 'PTEN MUTATION STATUS' versus Clinical Feature #1: 'Time to Death'
-
Mutation data file = KICH-TP.mutsig.cluster.txt
-
Clinical data file = KICH-TP.clin.merged.picked.txt
-
Number of patients = 64
-
Number of significantly mutated genes = 2
-
Number of selected clinical features = 10
-
Exclude genes that fewer than K tumors have mutations, K = 3
For survival clinical features, the Kaplan-Meier survival curves of tumors with and without gene mutations were plotted and the statistical significance P values were estimated by logrank test (Bland and Altman 2004) using the 'survdiff' function in R
For continuous numerical clinical features, two-tailed Student's t test with unequal variance (Lehmann and Romano 2005) was applied to compare the clinical values between tumors with and without gene mutations using 't.test' function in R
For binary or multi-class clinical features (nominal or ordinal), two-tailed Fisher's exact tests (Fisher 1922) were used to estimate the P values using the 'fisher.test' function in R
For multiple hypothesis correction, Q value is the False Discovery Rate (FDR) analogue of the P value (Benjamini and Hochberg 1995), defined as the minimum FDR at which the test may be called significant. We used the 'Benjamini and Hochberg' method of 'p.adjust' function in R to convert P values into Q values.
In addition to the links below, the full results of the analysis summarized in this report can also be downloaded programmatically using firehose_get, or interactively from either the Broad GDAC website or TCGA Data Coordination Center Portal.