This pipeline computes the correlation between significantly recurrent gene mutations and molecular subtypes.
Testing the association between mutation status of 2 genes and 8 molecular subtypes across 66 patients, one significant finding detected with P value < 0.05 and Q value < 0.25.
-
PTEN mutation correlated to 'MIRSEQ_MATURE_CNMF'.
Table 1. Get Full Table Overview of the association between mutation status of 2 genes and 8 molecular subtypes. Shown in the table are P values (Q values). Thresholded by P value < 0.05 and Q value < 0.25, one significant finding detected.
|
Clinical Features |
CN CNMF |
METHLYATION CNMF |
MRNASEQ CNMF |
MRNASEQ CHIERARCHICAL |
MIRSEQ CNMF |
MIRSEQ CHIERARCHICAL |
MIRSEQ MATURE CNMF |
MIRSEQ MATURE CHIERARCHICAL |
||
| nMutated (%) | nWild-Type | Fisher's exact test | Fisher's exact test | Fisher's exact test | Chi-square test | Fisher's exact test | Fisher's exact test | Chi-square test | Fisher's exact test | |
| PTEN | 6 (9%) | 60 |
0.0988 (1.00) |
0.321 (1.00) |
0.351 (1.00) |
0.13 (1.00) |
0.354 (1.00) |
0.585 (1.00) |
0.00617 (0.0988) |
0.0812 (1.00) |
| TP53 | 22 (33%) | 44 |
0.615 (1.00) |
0.0882 (1.00) |
0.0646 (0.904) |
0.0593 (0.89) |
0.645 (1.00) |
0.706 (1.00) |
0.76 (1.00) |
0.898 (1.00) |
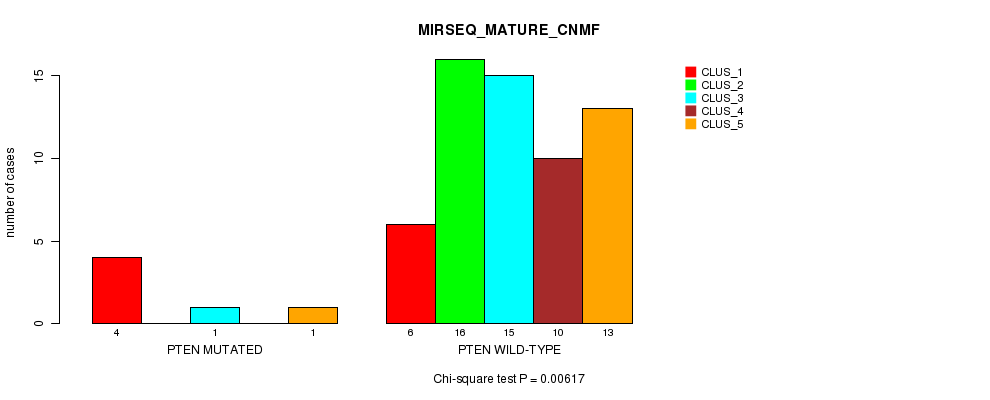
P value = 0.00617 (Chi-square test), Q value = 0.099
Table S1. Gene #2: 'PTEN MUTATION STATUS' versus Clinical Feature #7: 'MIRSEQ_MATURE_CNMF'
| nPatients | CLUS_1 | CLUS_2 | CLUS_3 | CLUS_4 | CLUS_5 |
|---|---|---|---|---|---|
| ALL | 10 | 16 | 16 | 10 | 14 |
| PTEN MUTATED | 4 | 0 | 1 | 0 | 1 |
| PTEN WILD-TYPE | 6 | 16 | 15 | 10 | 13 |
Figure S1. Get High-res Image Gene #2: 'PTEN MUTATION STATUS' versus Clinical Feature #7: 'MIRSEQ_MATURE_CNMF'
-
Mutation data file = KICH-TP.mutsig.cluster.txt
-
Molecular subtypes file = KICH-TP.transferedmergedcluster.txt
-
Number of patients = 66
-
Number of significantly mutated genes = 2
-
Number of Molecular subtypes = 8
-
Exclude genes that fewer than K tumors have mutations, K = 3
For binary or multi-class clinical features (nominal or ordinal), two-tailed Fisher's exact tests (Fisher 1922) were used to estimate the P values using the 'fisher.test' function in R
For multi-class clinical features (nominal or ordinal), Chi-square tests (Greenwood and Nikulin 1996) were used to estimate the P values using the 'chisq.test' function in R
For multiple hypothesis correction, Q value is the False Discovery Rate (FDR) analogue of the P value (Benjamini and Hochberg 1995), defined as the minimum FDR at which the test may be called significant. We used the 'Benjamini and Hochberg' method of 'p.adjust' function in R to convert P values into Q values.
In addition to the links below, the full results of the analysis summarized in this report can also be downloaded programmatically using firehose_get, or interactively from either the Broad GDAC website or TCGA Data Coordination Center Portal.