This pipeline uses various statistical tests to identify genes whose promoter methylation levels correlated to selected clinical features.
Testing the association between 20201 genes and 9 clinical features across 285 samples, statistically thresholded by Q value < 0.05, 7 clinical features related to at least one genes.
-
481 genes correlated to 'Time to Death'.
-
RIOK3 , FLJ42289 , TLL2 , RPRD2 , CCL26 , ...
-
21 genes correlated to 'AGE'.
-
ELOVL2 , MRPS33 , TSPYL5 , DOK6 , ZYG11A , ...
-
544 genes correlated to 'NEOPLASM.DISEASESTAGE'.
-
KDR , OPRK1 , FAM38B , CDH8 , CRHBP , ...
-
837 genes correlated to 'PATHOLOGY.T.STAGE'.
-
KDR , OPRK1 , ACTA1 , DBX2 , SYN2 , ...
-
9 genes correlated to 'PATHOLOGY.N.STAGE'.
-
CARD16 , CASP1 , ZFP64 , TSPO , SFXN5 , ...
-
91 genes correlated to 'PATHOLOGY.M.STAGE'.
-
C20ORF112 , PLCD1 , HTR6 , OPRK1 , MUSK , ...
-
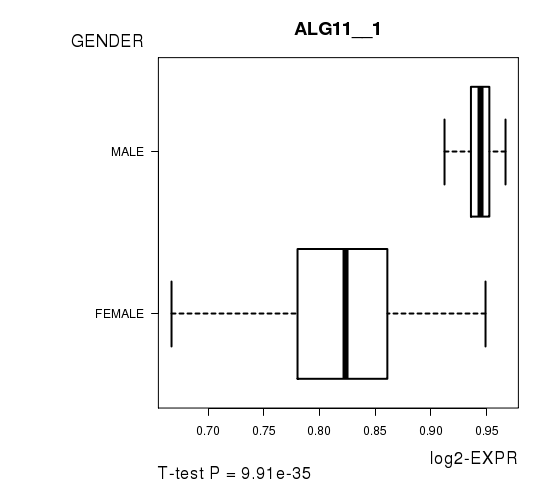
91 genes correlated to 'GENDER'.
-
ALG11__1 , UTP14C , CCBL2 , RBMXL1 , KIF4B , ...
-
No genes correlated to 'KARNOFSKY.PERFORMANCE.SCORE', and 'NUMBERPACKYEARSSMOKED'.
Complete statistical result table is provided in Supplement Table 1
Table 1. Get Full Table This table shows the clinical features, statistical methods used, and the number of genes that are significantly associated with each clinical feature at Q value < 0.05.
| Clinical feature | Statistical test | Significant genes | Associated with | Associated with | ||
|---|---|---|---|---|---|---|
| Time to Death | Cox regression test | N=481 | shorter survival | N=285 | longer survival | N=196 |
| AGE | Spearman correlation test | N=21 | older | N=17 | younger | N=4 |
| NEOPLASM DISEASESTAGE | ANOVA test | N=544 | ||||
| PATHOLOGY T STAGE | Spearman correlation test | N=837 | higher stage | N=388 | lower stage | N=449 |
| PATHOLOGY N STAGE | t test | N=9 | class1 | N=1 | class0 | N=8 |
| PATHOLOGY M STAGE | t test | N=91 | m1 | N=83 | m0 | N=8 |
| GENDER | t test | N=91 | male | N=10 | female | N=81 |
| KARNOFSKY PERFORMANCE SCORE | Spearman correlation test | N=0 | ||||
| NUMBERPACKYEARSSMOKED | Spearman correlation test | N=0 |
Table S1. Basic characteristics of clinical feature: 'Time to Death'
| Time to Death | Duration (Months) | 0.1-120.6 (median=29.1) |
| censored | N = 190 | |
| death | N = 95 | |
| Significant markers | N = 481 | |
| associated with shorter survival | 285 | |
| associated with longer survival | 196 |
Table S2. Get Full Table List of top 10 genes significantly associated with 'Time to Death' by Cox regression test
| HazardRatio | Wald_P | Q | C_index | |
|---|---|---|---|---|
| RIOK3 | 15001 | 2.793e-13 | 5.6e-09 | 0.676 |
| FLJ42289 | 0.03 | 6.262e-13 | 1.3e-08 | 0.312 |
| TLL2 | 0.02 | 2.306e-12 | 4.7e-08 | 0.316 |
| RPRD2 | 60 | 5.609e-12 | 1.1e-07 | 0.683 |
| CCL26 | 0.06 | 1.934e-11 | 3.9e-07 | 0.351 |
| GRIN2D | 0 | 3.216e-11 | 6.5e-07 | 0.318 |
| EVI2A | 0.04 | 4.242e-11 | 8.6e-07 | 0.346 |
| NF1__3 | 0.04 | 4.242e-11 | 8.6e-07 | 0.346 |
| ARHGEF12 | 44 | 4.264e-11 | 8.6e-07 | 0.641 |
| IGLL1 | 0.01 | 9.025e-11 | 1.8e-06 | 0.312 |
Figure S1. Get High-res Image As an example, this figure shows the association of RIOK3 to 'Time to Death'. four curves present the cumulative survival rates of 4 quartile subsets of patients. P value = 2.79e-13 with univariate Cox regression analysis using continuous log-2 expression values.
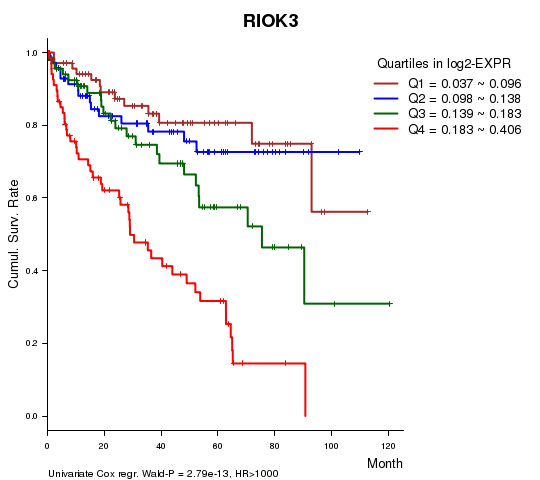
Table S3. Basic characteristics of clinical feature: 'AGE'
| AGE | Mean (SD) | 61.53 (12) |
| Significant markers | N = 21 | |
| pos. correlated | 17 | |
| neg. correlated | 4 |
Table S4. Get Full Table List of top 10 genes significantly correlated to 'AGE' by Spearman correlation test
| SpearmanCorr | corrP | Q | |
|---|---|---|---|
| ELOVL2 | 0.4638 | 1.31e-16 | 2.65e-12 |
| MRPS33 | 0.3371 | 5.272e-09 | 0.000106 |
| TSPYL5 | 0.3261 | 1.746e-08 | 0.000353 |
| DOK6 | 0.322 | 2.691e-08 | 0.000544 |
| ZYG11A | 0.3163 | 4.844e-08 | 0.000978 |
| ME3 | -0.3131 | 6.727e-08 | 0.00136 |
| PVT1 | -0.3063 | 1.319e-07 | 0.00266 |
| RANBP17 | 0.3052 | 1.48e-07 | 0.00299 |
| ADAMTS17 | 0.3034 | 1.765e-07 | 0.00356 |
| PCOLCE2 | -0.2952 | 3.882e-07 | 0.00784 |
Figure S2. Get High-res Image As an example, this figure shows the association of ELOVL2 to 'AGE'. P value = 1.31e-16 with Spearman correlation analysis. The straight line presents the best linear regression.
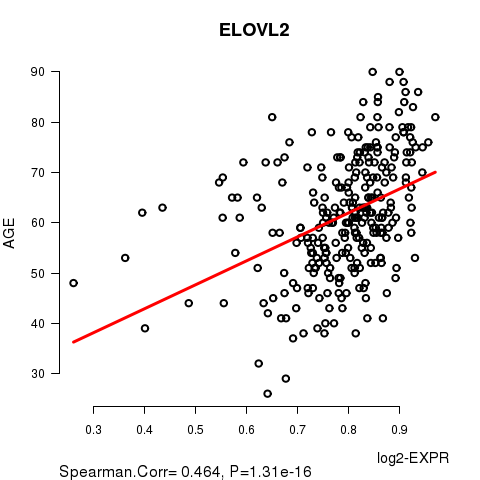
Table S5. Basic characteristics of clinical feature: 'NEOPLASM.DISEASESTAGE'
| NEOPLASM.DISEASESTAGE | Labels | N |
| STAGE I | 130 | |
| STAGE II | 28 | |
| STAGE III | 73 | |
| STAGE IV | 54 | |
| Significant markers | N = 544 |
Table S6. Get Full Table List of top 10 genes differentially expressed by 'NEOPLASM.DISEASESTAGE'
| ANOVA_P | Q | |
|---|---|---|
| KDR | 9.363e-20 | 1.89e-15 |
| OPRK1 | 1.514e-18 | 3.06e-14 |
| FAM38B | 8.657e-16 | 1.75e-11 |
| CDH8 | 5.007e-14 | 1.01e-09 |
| CRHBP | 8.798e-14 | 1.78e-09 |
| FAM162B | 1.105e-13 | 2.23e-09 |
| PCDHGA1__6 | 1.348e-13 | 2.72e-09 |
| PCDHGA10__4 | 1.348e-13 | 2.72e-09 |
| PCDHGA11__3 | 1.348e-13 | 2.72e-09 |
| PCDHGA2__6 | 1.348e-13 | 2.72e-09 |
Figure S3. Get High-res Image As an example, this figure shows the association of KDR to 'NEOPLASM.DISEASESTAGE'. P value = 9.36e-20 with ANOVA analysis.
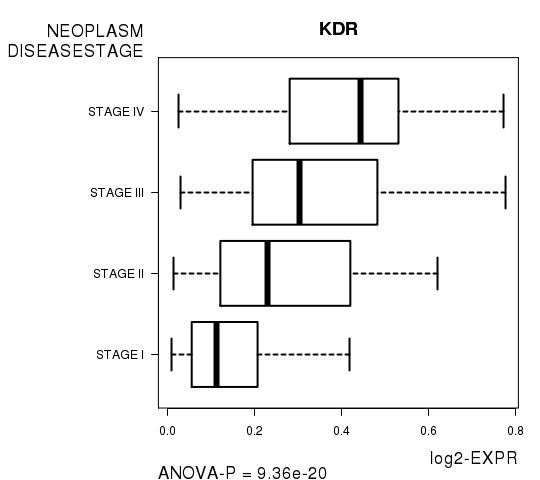
Table S7. Basic characteristics of clinical feature: 'PATHOLOGY.T.STAGE'
| PATHOLOGY.T.STAGE | Mean (SD) | 1.96 (0.98) |
| N | ||
| 1 | 133 | |
| 2 | 37 | |
| 3 | 107 | |
| 4 | 8 | |
| Significant markers | N = 837 | |
| pos. correlated | 388 | |
| neg. correlated | 449 |
Table S8. Get Full Table List of top 10 genes significantly correlated to 'PATHOLOGY.T.STAGE' by Spearman correlation test
| SpearmanCorr | corrP | Q | |
|---|---|---|---|
| KDR | 0.4997 | 2.097e-19 | 4.24e-15 |
| OPRK1 | 0.4724 | 3.011e-17 | 6.08e-13 |
| ACTA1 | 0.4688 | 5.581e-17 | 1.13e-12 |
| DBX2 | 0.445 | 2.877e-15 | 5.81e-11 |
| SYN2 | 0.4436 | 3.609e-15 | 7.29e-11 |
| SLC35F1 | 0.4432 | 3.834e-15 | 7.74e-11 |
| NEUROD2 | 0.4418 | 4.795e-15 | 9.68e-11 |
| RRM2 | -0.4303 | 2.844e-14 | 5.74e-10 |
| SOX17 | 0.4189 | 1.543e-13 | 3.11e-09 |
| FAM38B | 0.4187 | 1.583e-13 | 3.2e-09 |
Figure S4. Get High-res Image As an example, this figure shows the association of KDR to 'PATHOLOGY.T.STAGE'. P value = 2.1e-19 with Spearman correlation analysis.
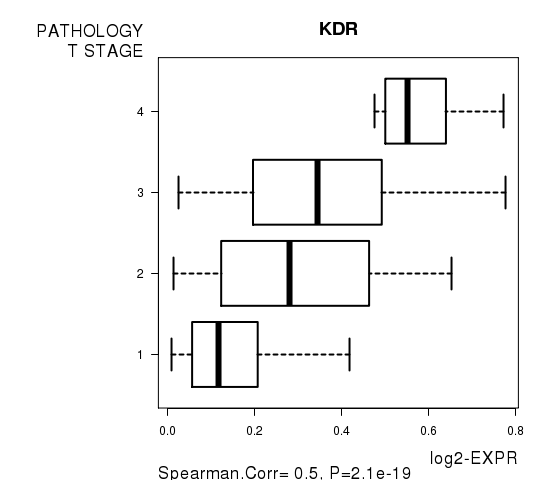
Table S9. Basic characteristics of clinical feature: 'PATHOLOGY.N.STAGE'
| PATHOLOGY.N.STAGE | Labels | N |
| class0 | 127 | |
| class1 | 9 | |
| Significant markers | N = 9 | |
| Higher in class1 | 1 | |
| Higher in class0 | 8 |
Table S10. Get Full Table List of 9 genes differentially expressed by 'PATHOLOGY.N.STAGE'
| T(pos if higher in 'class1') | ttestP | Q | AUC | |
|---|---|---|---|---|
| CARD16 | -6.6 | 3.144e-09 | 6.35e-05 | 0.6745 |
| CASP1 | -6.6 | 3.144e-09 | 6.35e-05 | 0.6745 |
| ZFP64 | -5.43 | 3.028e-07 | 0.00612 | 0.629 |
| TSPO | -5.59 | 4.472e-07 | 0.00903 | 0.6325 |
| SFXN5 | -6.12 | 5.343e-07 | 0.0108 | 0.7019 |
| VGF | -5.2 | 7.459e-07 | 0.0151 | 0.6527 |
| CHCHD7__1 | -5.09 | 1.193e-06 | 0.0241 | 0.776 |
| PLAG1__1 | -5.09 | 1.193e-06 | 0.0241 | 0.776 |
| LOC150568 | 5.59 | 1.315e-06 | 0.0266 | 0.7434 |
Figure S5. Get High-res Image As an example, this figure shows the association of CARD16 to 'PATHOLOGY.N.STAGE'. P value = 3.14e-09 with T-test analysis.
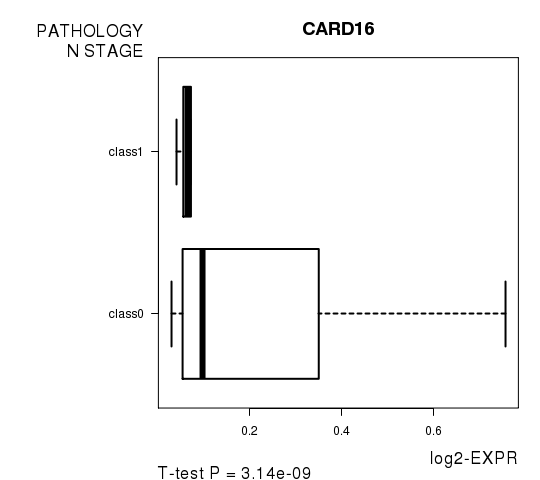
Table S11. Basic characteristics of clinical feature: 'PATHOLOGY.M.STAGE'
| PATHOLOGY.M.STAGE | Labels | N |
| M0 | 233 | |
| M1 | 52 | |
| Significant markers | N = 91 | |
| Higher in M1 | 83 | |
| Higher in M0 | 8 |
Table S12. Get Full Table List of top 10 genes differentially expressed by 'PATHOLOGY.M.STAGE'
| T(pos if higher in 'M1') | ttestP | Q | AUC | |
|---|---|---|---|---|
| C20ORF112 | 7.96 | 3.528e-13 | 7.13e-09 | 0.7739 |
| PLCD1 | 6.73 | 2.361e-10 | 4.77e-06 | 0.7195 |
| HTR6 | 7.05 | 4.663e-10 | 9.42e-06 | 0.7646 |
| OPRK1 | 6.93 | 6.028e-10 | 1.22e-05 | 0.7524 |
| MUSK | 6.52 | 1.426e-09 | 2.88e-05 | 0.7216 |
| SESN1__1 | 6.47 | 1.647e-09 | 3.33e-05 | 0.7147 |
| STK24 | 6.52 | 3.172e-09 | 6.41e-05 | 0.754 |
| PDGFB | 6.28 | 3.259e-09 | 6.58e-05 | 0.7221 |
| CSDC2 | 6.59 | 3.618e-09 | 7.31e-05 | 0.7508 |
| ASB4 | 6.25 | 4.217e-09 | 8.52e-05 | 0.6966 |
Figure S6. Get High-res Image As an example, this figure shows the association of C20ORF112 to 'PATHOLOGY.M.STAGE'. P value = 3.53e-13 with T-test analysis.
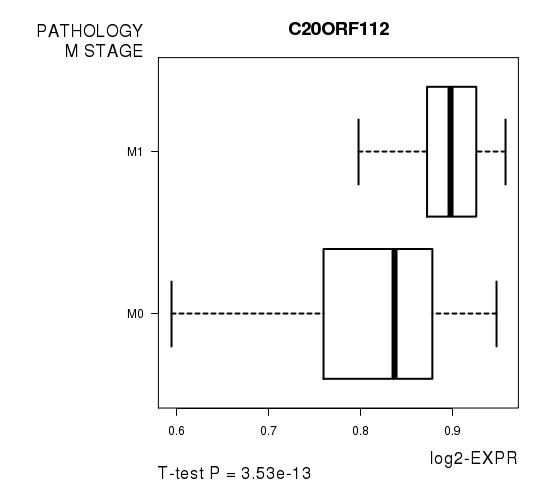
Table S13. Basic characteristics of clinical feature: 'GENDER'
| GENDER | Labels | N |
| FEMALE | 96 | |
| MALE | 189 | |
| Significant markers | N = 91 | |
| Higher in MALE | 10 | |
| Higher in FEMALE | 81 |
Table S14. Get Full Table List of top 10 genes differentially expressed by 'GENDER'
| T(pos if higher in 'MALE') | ttestP | Q | AUC | |
|---|---|---|---|---|
| ALG11__1 | 18.71 | 9.907e-35 | 2e-30 | 0.9804 |
| UTP14C | 18.71 | 9.907e-35 | 2e-30 | 0.9804 |
| CCBL2 | 13.68 | 3.031e-31 | 6.12e-27 | 0.8779 |
| RBMXL1 | 13.68 | 3.031e-31 | 6.12e-27 | 0.8779 |
| KIF4B | -11.76 | 5.928e-25 | 1.2e-20 | 0.8729 |
| CCDC146__1 | -10.91 | 3.153e-23 | 6.37e-19 | 0.8083 |
| C5ORF27 | -10.37 | 1.125e-20 | 2.27e-16 | 0.8165 |
| LRRC41 | 10.26 | 1.547e-20 | 3.13e-16 | 0.7615 |
| UQCRH | 10.26 | 1.547e-20 | 3.13e-16 | 0.7615 |
| DNAJB13 | -10.1 | 1.567e-20 | 3.16e-16 | 0.794 |
Figure S7. Get High-res Image As an example, this figure shows the association of ALG11__1 to 'GENDER'. P value = 9.91e-35 with T-test analysis.
No gene related to 'KARNOFSKY.PERFORMANCE.SCORE'.
Table S15. Basic characteristics of clinical feature: 'KARNOFSKY.PERFORMANCE.SCORE'
| KARNOFSKY.PERFORMANCE.SCORE | Mean (SD) | 92.5 (8) |
| Score | N | |
| 70 | 1 | |
| 80 | 3 | |
| 90 | 12 | |
| 100 | 12 | |
| Significant markers | N = 0 |
-
Expresson data file = KIRC-TP.meth.by_min_expr_corr.data.txt
-
Clinical data file = KIRC-TP.clin.merged.picked.txt
-
Number of patients = 285
-
Number of genes = 20201
-
Number of clinical features = 9
For survival clinical features, Wald's test in univariate Cox regression analysis with proportional hazards model (Andersen and Gill 1982) was used to estimate the P values using the 'coxph' function in R. Kaplan-Meier survival curves were plot using the four quartile subgroups of patients based on expression levels
For continuous numerical clinical features, Spearman's rank correlation coefficients (Spearman 1904) and two-tailed P values were estimated using 'cor.test' function in R
For multi-class clinical features (ordinal or nominal), one-way analysis of variance (Howell 2002) was applied to compare the log2-expression levels between different clinical classes using 'anova' function in R
For two-class clinical features, two-tailed Student's t test with unequal variance (Lehmann and Romano 2005) was applied to compare the log2-expression levels between the two clinical classes using 't.test' function in R
For multiple hypothesis correction, Q value is the False Discovery Rate (FDR) analogue of the P value (Benjamini and Hochberg 1995), defined as the minimum FDR at which the test may be called significant. We used the 'Benjamini and Hochberg' method of 'p.adjust' function in R to convert P values into Q values.
In addition to the links below, the full results of the analysis summarized in this report can also be downloaded programmatically using firehose_get, or interactively from either the Broad GDAC website or TCGA Data Coordination Center Portal.