This pipeline uses various statistical tests to identify miRs whose expression levels correlated to selected clinical features.
Testing the association between 455 genes and 9 clinical features across 482 samples, statistically thresholded by Q value < 0.05, 6 clinical features related to at least one genes.
-
67 genes correlated to 'Time to Death'.
-
HSA-MIR-223 , HSA-MIR-130B , HSA-MIR-34C , HSA-MIR-21 , HSA-MIR-365-2 , ...
-
1 gene correlated to 'AGE'.
-
HSA-MIR-590
-
41 genes correlated to 'NEOPLASM.DISEASESTAGE'.
-
HSA-MIR-139 , HSA-MIR-625 , HSA-MIR-28 , HSA-LET-7I , HSA-MIR-155 , ...
-
32 genes correlated to 'PATHOLOGY.T.STAGE'.
-
HSA-MIR-139 , HSA-MIR-21 , HSA-MIR-625 , HSA-MIR-486 , HSA-MIR-144 , ...
-
20 genes correlated to 'PATHOLOGY.M.STAGE'.
-
HSA-MIR-106B , HSA-MIR-193A , HSA-MIR-625 , HSA-MIR-28 , HSA-MIR-155 , ...
-
12 genes correlated to 'GENDER'.
-
HSA-MIR-100 , HSA-MIR-455 , HSA-MIR-708 , HSA-MIR-599 , HSA-MIR-30A , ...
-
No genes correlated to 'PATHOLOGY.N.STAGE', 'KARNOFSKY.PERFORMANCE.SCORE', and 'NUMBERPACKYEARSSMOKED'.
Complete statistical result table is provided in Supplement Table 1
Table 1. Get Full Table This table shows the clinical features, statistical methods used, and the number of genes that are significantly associated with each clinical feature at Q value < 0.05.
| Clinical feature | Statistical test | Significant genes | Associated with | Associated with | ||
|---|---|---|---|---|---|---|
| Time to Death | Cox regression test | N=67 | shorter survival | N=57 | longer survival | N=10 |
| AGE | Spearman correlation test | N=1 | older | N=1 | younger | N=0 |
| NEOPLASM DISEASESTAGE | ANOVA test | N=41 | ||||
| PATHOLOGY T STAGE | Spearman correlation test | N=32 | higher stage | N=24 | lower stage | N=8 |
| PATHOLOGY N STAGE | t test | N=0 | ||||
| PATHOLOGY M STAGE | t test | N=20 | m1 | N=16 | m0 | N=4 |
| GENDER | t test | N=12 | male | N=3 | female | N=9 |
| KARNOFSKY PERFORMANCE SCORE | Spearman correlation test | N=0 | ||||
| NUMBERPACKYEARSSMOKED | Spearman correlation test | N=0 |
Table S1. Basic characteristics of clinical feature: 'Time to Death'
| Time to Death | Duration (Months) | 0.1-120.6 (median=36.4) |
| censored | N = 321 | |
| death | N = 161 | |
| Significant markers | N = 67 | |
| associated with shorter survival | 57 | |
| associated with longer survival | 10 |
Table S2. Get Full Table List of top 10 genes significantly associated with 'Time to Death' by Cox regression test
| HazardRatio | Wald_P | Q | C_index | |
|---|---|---|---|---|
| HSA-MIR-223 | 1.62 | 8.971e-13 | 4.1e-10 | 0.645 |
| HSA-MIR-130B | 2 | 3.007e-12 | 1.4e-09 | 0.648 |
| HSA-MIR-34C | 1.29 | 1.07e-10 | 4.8e-08 | 0.642 |
| HSA-MIR-21 | 2.1 | 9.936e-10 | 4.5e-07 | 0.66 |
| HSA-MIR-365-2 | 1.7 | 1.049e-08 | 4.7e-06 | 0.623 |
| HSA-MIR-10B | 0.57 | 1.449e-08 | 6.5e-06 | 0.37 |
| HSA-MIR-365-1 | 1.67 | 2.191e-08 | 9.8e-06 | 0.621 |
| HSA-MIR-18A | 1.55 | 2.787e-08 | 1.2e-05 | 0.62 |
| HSA-MIR-1248 | 1.4 | 3.678e-08 | 1.6e-05 | 0.611 |
| HSA-MIR-101-1 | 0.57 | 3.833e-08 | 1.7e-05 | 0.4 |
Figure S1. Get High-res Image As an example, this figure shows the association of HSA-MIR-223 to 'Time to Death'. four curves present the cumulative survival rates of 4 quartile subsets of patients. P value = 8.97e-13 with univariate Cox regression analysis using continuous log-2 expression values.
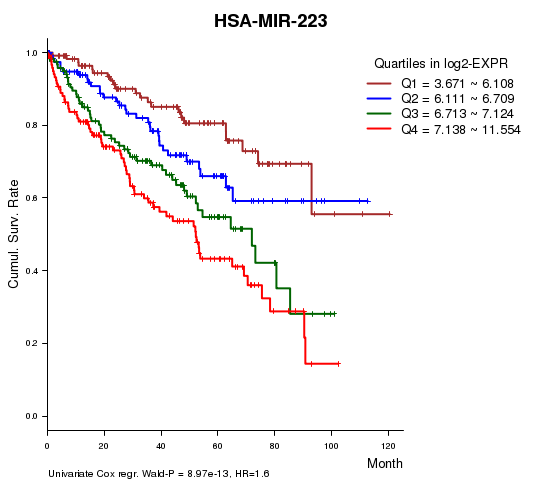
Table S3. Basic characteristics of clinical feature: 'AGE'
| AGE | Mean (SD) | 60.58 (12) |
| Significant markers | N = 1 | |
| pos. correlated | 1 | |
| neg. correlated | 0 |
Table S4. Get Full Table List of one gene significantly correlated to 'AGE' by Spearman correlation test
| SpearmanCorr | corrP | Q | |
|---|---|---|---|
| HSA-MIR-590 | 0.1846 | 4.571e-05 | 0.0208 |
Figure S2. Get High-res Image As an example, this figure shows the association of HSA-MIR-590 to 'AGE'. P value = 4.57e-05 with Spearman correlation analysis. The straight line presents the best linear regression.
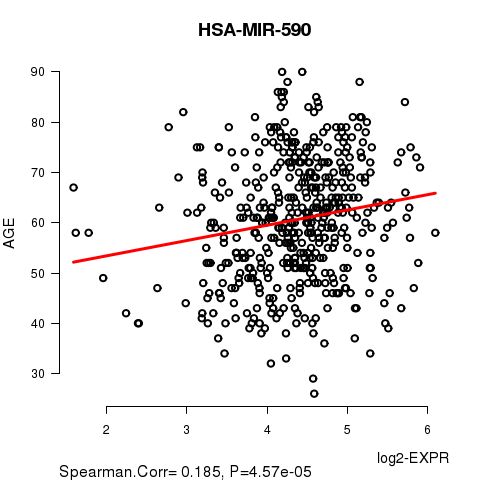
Table S5. Basic characteristics of clinical feature: 'NEOPLASM.DISEASESTAGE'
| NEOPLASM.DISEASESTAGE | Labels | N |
| STAGE I | 228 | |
| STAGE II | 52 | |
| STAGE III | 124 | |
| STAGE IV | 78 | |
| Significant markers | N = 41 |
Table S6. Get Full Table List of top 10 genes differentially expressed by 'NEOPLASM.DISEASESTAGE'
| ANOVA_P | Q | |
|---|---|---|
| HSA-MIR-139 | 9.883e-13 | 4.5e-10 |
| HSA-MIR-625 | 3.384e-11 | 1.54e-08 |
| HSA-MIR-28 | 1.767e-09 | 8e-07 |
| HSA-LET-7I | 4.231e-09 | 1.91e-06 |
| HSA-MIR-155 | 4.715e-09 | 2.13e-06 |
| HSA-MIR-21 | 7.142e-09 | 3.21e-06 |
| HSA-MIR-130B | 7.918e-09 | 3.56e-06 |
| HSA-MIR-144 | 1.145e-08 | 5.13e-06 |
| HSA-MIR-486 | 1.761e-08 | 7.87e-06 |
| HSA-MIR-130A | 3.951e-08 | 1.76e-05 |
Figure S3. Get High-res Image As an example, this figure shows the association of HSA-MIR-139 to 'NEOPLASM.DISEASESTAGE'. P value = 9.88e-13 with ANOVA analysis.
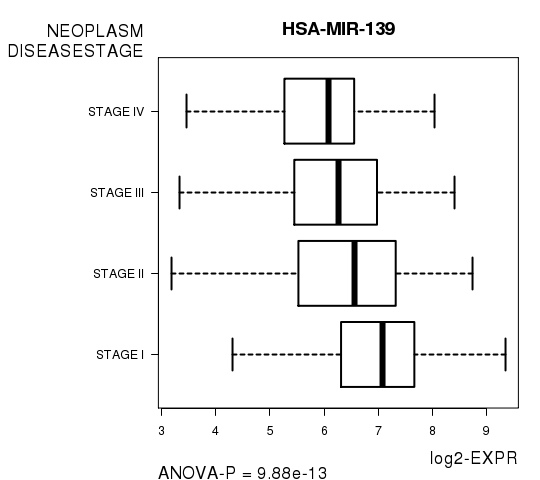
Table S7. Basic characteristics of clinical feature: 'PATHOLOGY.T.STAGE'
| PATHOLOGY.T.STAGE | Mean (SD) | 1.93 (0.97) |
| N | ||
| 1 | 233 | |
| 2 | 63 | |
| 3 | 175 | |
| 4 | 11 | |
| Significant markers | N = 32 | |
| pos. correlated | 24 | |
| neg. correlated | 8 |
Table S8. Get Full Table List of top 10 genes significantly correlated to 'PATHOLOGY.T.STAGE' by Spearman correlation test
| SpearmanCorr | corrP | Q | |
|---|---|---|---|
| HSA-MIR-139 | -0.3307 | 9.235e-14 | 4.2e-11 |
| HSA-MIR-21 | 0.2773 | 5.827e-10 | 2.65e-07 |
| HSA-MIR-625 | 0.2736 | 1.004e-09 | 4.55e-07 |
| HSA-MIR-486 | -0.2681 | 2.229e-09 | 1.01e-06 |
| HSA-MIR-144 | -0.254 | 1.555e-08 | 7.01e-06 |
| HSA-MIR-155 | 0.2525 | 1.908e-08 | 8.59e-06 |
| HSA-MIR-130B | 0.2436 | 6.071e-08 | 2.73e-05 |
| HSA-MIR-451 | -0.2317 | 2.685e-07 | 0.00012 |
| HSA-MIR-9-1 | 0.2313 | 2.815e-07 | 0.000126 |
| HSA-LET-7I | 0.2246 | 6.265e-07 | 0.000279 |
Figure S4. Get High-res Image As an example, this figure shows the association of HSA-MIR-139 to 'PATHOLOGY.T.STAGE'. P value = 9.24e-14 with Spearman correlation analysis.
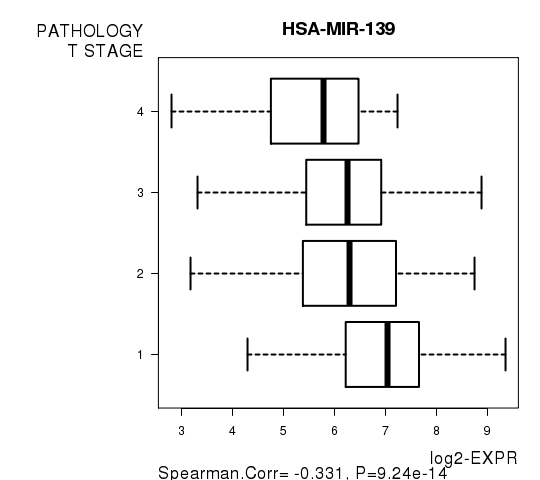
Table S9. Basic characteristics of clinical feature: 'PATHOLOGY.N.STAGE'
| PATHOLOGY.N.STAGE | Labels | N |
| class0 | 222 | |
| class1 | 18 | |
| Significant markers | N = 0 |
Table S10. Basic characteristics of clinical feature: 'PATHOLOGY.M.STAGE'
| PATHOLOGY.M.STAGE | Labels | N |
| M0 | 405 | |
| M1 | 77 | |
| Significant markers | N = 20 | |
| Higher in M1 | 16 | |
| Higher in M0 | 4 |
Table S11. Get Full Table List of top 10 genes differentially expressed by 'PATHOLOGY.M.STAGE'
| T(pos if higher in 'M1') | ttestP | Q | AUC | |
|---|---|---|---|---|
| HSA-MIR-106B | 5.92 | 2.306e-08 | 1.05e-05 | 0.6802 |
| HSA-MIR-193A | 5.73 | 4.365e-08 | 1.98e-05 | 0.6454 |
| HSA-MIR-625 | 5.47 | 3.002e-07 | 0.000136 | 0.6909 |
| HSA-MIR-28 | 5.43 | 3.122e-07 | 0.000141 | 0.6654 |
| HSA-MIR-155 | 5.42 | 3.446e-07 | 0.000155 | 0.686 |
| HSA-LET-7I | 5.19 | 8.39e-07 | 0.000378 | 0.667 |
| HSA-MIR-130B | 5.17 | 9.361e-07 | 0.00042 | 0.6722 |
| HSA-MIR-144 | -5.09 | 1.642e-06 | 0.000736 | 0.6794 |
| HSA-MIR-27A | 4.9 | 2.72e-06 | 0.00122 | 0.632 |
| HSA-MIR-139 | -4.71 | 7.475e-06 | 0.00333 | 0.6667 |
Figure S5. Get High-res Image As an example, this figure shows the association of HSA-MIR-106B to 'PATHOLOGY.M.STAGE'. P value = 2.31e-08 with T-test analysis.
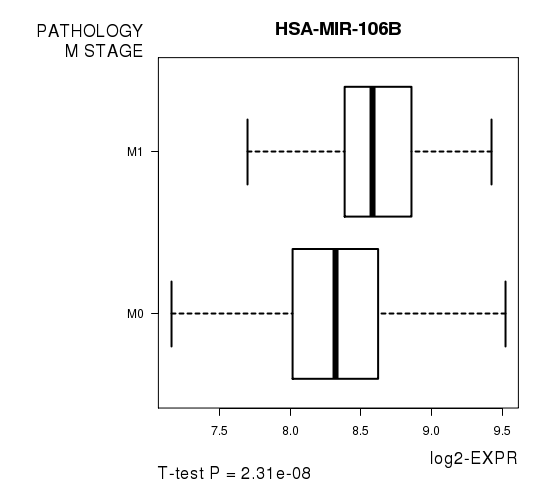
Table S12. Basic characteristics of clinical feature: 'GENDER'
| GENDER | Labels | N |
| FEMALE | 163 | |
| MALE | 319 | |
| Significant markers | N = 12 | |
| Higher in MALE | 3 | |
| Higher in FEMALE | 9 |
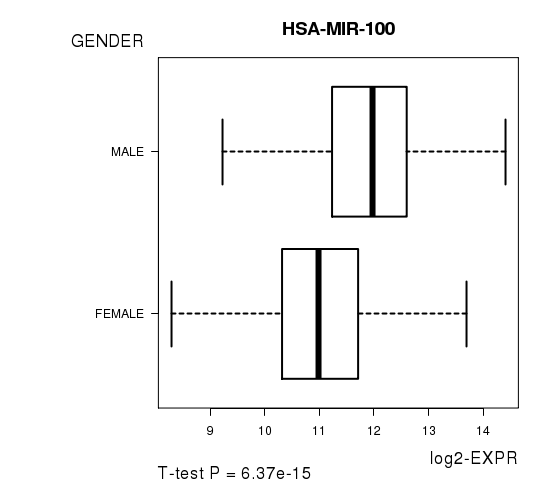
Table S13. Get Full Table List of top 10 genes differentially expressed by 'GENDER'
| T(pos if higher in 'MALE') | ttestP | Q | AUC | |
|---|---|---|---|---|
| HSA-MIR-100 | 8.2 | 6.371e-15 | 2.9e-12 | 0.7308 |
| HSA-MIR-455 | -5.4 | 1.186e-07 | 5.38e-05 | 0.6603 |
| HSA-MIR-708 | 5.4 | 1.341e-07 | 6.07e-05 | 0.6571 |
| HSA-MIR-599 | -5.12 | 6.089e-07 | 0.000275 | 0.6766 |
| HSA-MIR-30A | -4.38 | 1.512e-05 | 0.00682 | 0.6152 |
| HSA-MIR-30C-2 | -4.37 | 1.701e-05 | 0.00766 | 0.6152 |
| HSA-MIR-31 | 4.34 | 1.967e-05 | 0.00883 | 0.6288 |
| HSA-MIR-500B | -4.19 | 3.561e-05 | 0.016 | 0.6117 |
| HSA-MIR-204 | -4.1 | 5.229e-05 | 0.0234 | 0.6393 |
| HSA-MIR-328 | -4.02 | 7.008e-05 | 0.0313 | 0.6086 |
Figure S6. Get High-res Image As an example, this figure shows the association of HSA-MIR-100 to 'GENDER'. P value = 6.37e-15 with T-test analysis.
No gene related to 'KARNOFSKY.PERFORMANCE.SCORE'.
Table S14. Basic characteristics of clinical feature: 'KARNOFSKY.PERFORMANCE.SCORE'
| KARNOFSKY.PERFORMANCE.SCORE | Mean (SD) | 88.33 (23) |
| Score | N | |
| 0 | 2 | |
| 70 | 1 | |
| 80 | 3 | |
| 90 | 13 | |
| 100 | 17 | |
| Significant markers | N = 0 |
-
Expresson data file = KIRC-TP.miRseq_RPKM_log2.txt
-
Clinical data file = KIRC-TP.clin.merged.picked.txt
-
Number of patients = 482
-
Number of genes = 455
-
Number of clinical features = 9
For survival clinical features, Wald's test in univariate Cox regression analysis with proportional hazards model (Andersen and Gill 1982) was used to estimate the P values using the 'coxph' function in R. Kaplan-Meier survival curves were plot using the four quartile subgroups of patients based on expression levels
For continuous numerical clinical features, Spearman's rank correlation coefficients (Spearman 1904) and two-tailed P values were estimated using 'cor.test' function in R
For multi-class clinical features (ordinal or nominal), one-way analysis of variance (Howell 2002) was applied to compare the log2-expression levels between different clinical classes using 'anova' function in R
For two-class clinical features, two-tailed Student's t test with unequal variance (Lehmann and Romano 2005) was applied to compare the log2-expression levels between the two clinical classes using 't.test' function in R
For multiple hypothesis correction, Q value is the False Discovery Rate (FDR) analogue of the P value (Benjamini and Hochberg 1995), defined as the minimum FDR at which the test may be called significant. We used the 'Benjamini and Hochberg' method of 'p.adjust' function in R to convert P values into Q values.
In addition to the links below, the full results of the analysis summarized in this report can also be downloaded programmatically using firehose_get, or interactively from either the Broad GDAC website or TCGA Data Coordination Center Portal.