This pipeline uses various statistical tests to identify genes whose promoter methylation levels correlated to selected clinical features.
Testing the association between 19964 genes and 9 clinical features across 110 samples, statistically thresholded by Q value < 0.05, 6 clinical features related to at least one genes.
-
61 genes correlated to 'Time to Death'.
-
ADRA1A , PACSIN1 , KRTCAP2 , TRIM46 , C3ORF72 , ...
-
1 gene correlated to 'AGE'.
-
WDR81__1
-
157 genes correlated to 'NEOPLASM.DISEASESTAGE'.
-
C17ORF93 , PRAC , DLX6AS__1 , TMEM132B , PCDHA1__8 , ...
-
92 genes correlated to 'PATHOLOGY.T.STAGE'.
-
DLX6AS__1 , DLX6 , DLX6AS , OTP , CDO1 , ...
-
159 genes correlated to 'PATHOLOGY.M.STAGE'.
-
BAHD1 , LPPR2 , SCN4A , THAP2__1 , ZFC3H1__1 , ...
-
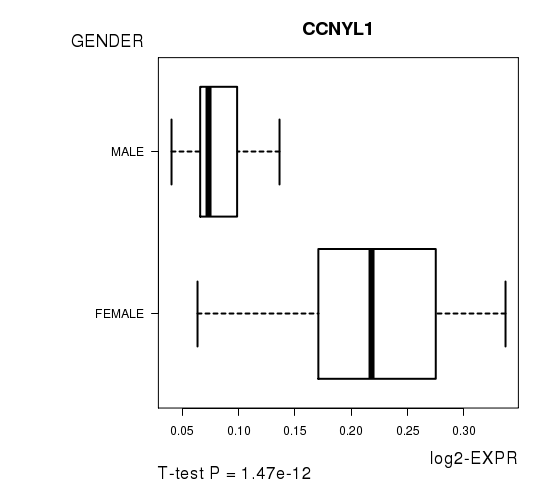
8 genes correlated to 'GENDER'.
-
CCNYL1 , NARFL , PRKRIR , HNRNPD , FDPS , ...
-
No genes correlated to 'PATHOLOGY.N.STAGE', 'KARNOFSKY.PERFORMANCE.SCORE', and 'NUMBERPACKYEARSSMOKED'.
Complete statistical result table is provided in Supplement Table 1
Table 1. Get Full Table This table shows the clinical features, statistical methods used, and the number of genes that are significantly associated with each clinical feature at Q value < 0.05.
| Clinical feature | Statistical test | Significant genes | Associated with | Associated with | ||
|---|---|---|---|---|---|---|
| Time to Death | Cox regression test | N=61 | shorter survival | N=59 | longer survival | N=2 |
| AGE | Spearman correlation test | N=1 | older | N=1 | younger | N=0 |
| NEOPLASM DISEASESTAGE | ANOVA test | N=157 | ||||
| PATHOLOGY T STAGE | Spearman correlation test | N=92 | higher stage | N=82 | lower stage | N=10 |
| PATHOLOGY N STAGE | Spearman correlation test | N=0 | ||||
| PATHOLOGY M STAGE | ANOVA test | N=159 | ||||
| GENDER | t test | N=8 | male | N=5 | female | N=3 |
| KARNOFSKY PERFORMANCE SCORE | Spearman correlation test | N=0 | ||||
| NUMBERPACKYEARSSMOKED | Spearman correlation test | N=0 |
Table S1. Basic characteristics of clinical feature: 'Time to Death'
| Time to Death | Duration (Months) | 0-194.8 (median=13.7) |
| censored | N = 87 | |
| death | N = 13 | |
| Significant markers | N = 61 | |
| associated with shorter survival | 59 | |
| associated with longer survival | 2 |
Table S2. Get Full Table List of top 10 genes significantly associated with 'Time to Death' by Cox regression test
| HazardRatio | Wald_P | Q | C_index | |
|---|---|---|---|---|
| ADRA1A | 7801 | 5.51e-09 | 0.00011 | 0.823 |
| PACSIN1 | 411 | 4.248e-08 | 0.00085 | 0.821 |
| KRTCAP2 | 10000001 | 4.924e-08 | 0.00098 | 0.618 |
| TRIM46 | 10000001 | 4.924e-08 | 0.00098 | 0.618 |
| C3ORF72 | 951 | 6.595e-08 | 0.0013 | 0.711 |
| FOXL2 | 951 | 6.595e-08 | 0.0013 | 0.711 |
| PLIN5 | 1501 | 7.621e-08 | 0.0015 | 0.848 |
| NHLH2 | 1901 | 1.28e-07 | 0.0026 | 0.903 |
| MT1G__1 | 2801 | 1.282e-07 | 0.0026 | 0.869 |
| C10ORF67 | 4301 | 1.345e-07 | 0.0027 | 0.789 |
Figure S1. Get High-res Image As an example, this figure shows the association of ADRA1A to 'Time to Death'. four curves present the cumulative survival rates of 4 quartile subsets of patients. P value = 5.51e-09 with univariate Cox regression analysis using continuous log-2 expression values.
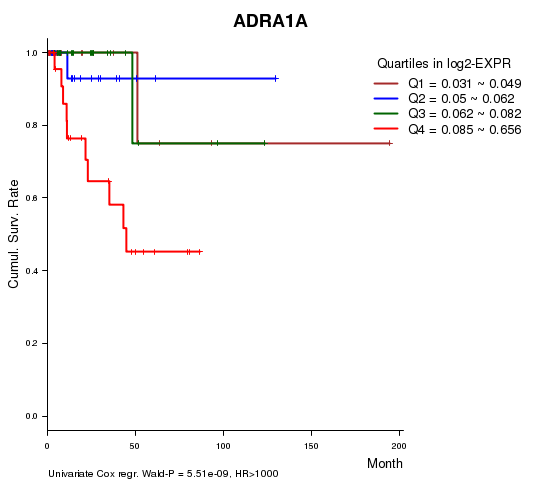
Table S3. Basic characteristics of clinical feature: 'AGE'
| AGE | Mean (SD) | 59.98 (12) |
| Significant markers | N = 1 | |
| pos. correlated | 1 | |
| neg. correlated | 0 |
Table S4. Get Full Table List of one gene significantly correlated to 'AGE' by Spearman correlation test
| SpearmanCorr | corrP | Q | |
|---|---|---|---|
| WDR81__1 | 0.4375 | 2.454e-06 | 0.049 |
Figure S2. Get High-res Image As an example, this figure shows the association of WDR81__1 to 'AGE'. P value = 2.45e-06 with Spearman correlation analysis. The straight line presents the best linear regression.
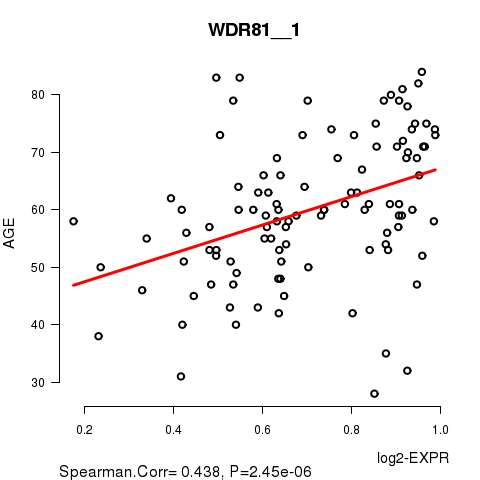
Table S5. Basic characteristics of clinical feature: 'NEOPLASM.DISEASESTAGE'
| NEOPLASM.DISEASESTAGE | Labels | N |
| STAGE I | 63 | |
| STAGE II | 7 | |
| STAGE III | 29 | |
| STAGE IV | 9 | |
| Significant markers | N = 157 |
Table S6. Get Full Table List of top 10 genes differentially expressed by 'NEOPLASM.DISEASESTAGE'
| ANOVA_P | Q | |
|---|---|---|
| C17ORF93 | 2.999e-11 | 5.99e-07 |
| PRAC | 2.999e-11 | 5.99e-07 |
| DLX6AS__1 | 6.384e-11 | 1.27e-06 |
| TMEM132B | 3.12e-10 | 6.23e-06 |
| PCDHA1__8 | 6.082e-10 | 1.21e-05 |
| PCDHA10__5 | 6.082e-10 | 1.21e-05 |
| PCDHA11__3 | 6.082e-10 | 1.21e-05 |
| PCDHA12__3 | 6.082e-10 | 1.21e-05 |
| PCDHA13__2 | 6.082e-10 | 1.21e-05 |
| PCDHA2__8 | 6.082e-10 | 1.21e-05 |
Figure S3. Get High-res Image As an example, this figure shows the association of C17ORF93 to 'NEOPLASM.DISEASESTAGE'. P value = 3e-11 with ANOVA analysis.
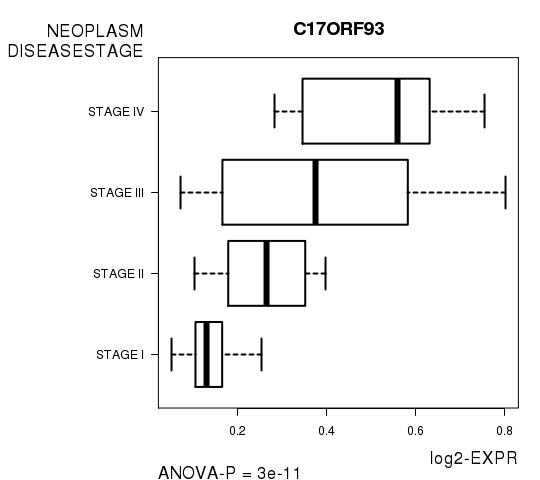
Table S7. Basic characteristics of clinical feature: 'PATHOLOGY.T.STAGE'
| PATHOLOGY.T.STAGE | Mean (SD) | 1.75 (0.94) |
| N | ||
| 1 | 65 | |
| 2 | 9 | |
| 3 | 35 | |
| 4 | 1 | |
| Significant markers | N = 92 | |
| pos. correlated | 82 | |
| neg. correlated | 10 |
Table S8. Get Full Table List of top 10 genes significantly correlated to 'PATHOLOGY.T.STAGE' by Spearman correlation test
| SpearmanCorr | corrP | Q | |
|---|---|---|---|
| DLX6AS__1 | 0.58 | 3.138e-11 | 6.26e-07 |
| DLX6 | 0.5683 | 9.469e-11 | 1.89e-06 |
| DLX6AS | 0.5683 | 9.469e-11 | 1.89e-06 |
| OTP | 0.539 | 1.242e-09 | 2.48e-05 |
| CDO1 | 0.5316 | 2.295e-09 | 4.58e-05 |
| C17ORF93 | 0.5265 | 3.455e-09 | 6.9e-05 |
| PRAC | 0.5265 | 3.455e-09 | 6.9e-05 |
| GPR150 | 0.5264 | 3.501e-09 | 6.99e-05 |
| TBX4 | 0.5237 | 4.342e-09 | 8.66e-05 |
| LEFTY2 | 0.5233 | 4.487e-09 | 8.95e-05 |
Figure S4. Get High-res Image As an example, this figure shows the association of DLX6AS__1 to 'PATHOLOGY.T.STAGE'. P value = 3.14e-11 with Spearman correlation analysis.
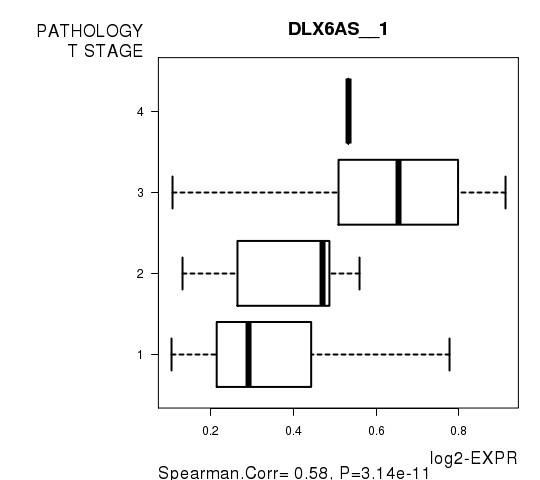
Table S9. Basic characteristics of clinical feature: 'PATHOLOGY.N.STAGE'
| PATHOLOGY.N.STAGE | Mean (SD) | 0.49 (0.68) |
| N | ||
| 0 | 24 | |
| 1 | 11 | |
| 2 | 4 | |
| Significant markers | N = 0 |
Table S10. Basic characteristics of clinical feature: 'PATHOLOGY.M.STAGE'
| PATHOLOGY.M.STAGE | Labels | N |
| M0 | 47 | |
| M1 | 5 | |
| MX | 55 | |
| Significant markers | N = 159 |
Table S11. Get Full Table List of top 10 genes differentially expressed by 'PATHOLOGY.M.STAGE'
| ANOVA_P | Q | |
|---|---|---|
| BAHD1 | 1e-12 | 2e-08 |
| LPPR2 | 2.281e-11 | 4.55e-07 |
| SCN4A | 1.533e-10 | 3.06e-06 |
| THAP2__1 | 1.751e-10 | 3.49e-06 |
| ZFC3H1__1 | 1.751e-10 | 3.49e-06 |
| PCDHA1__8 | 1.893e-10 | 3.78e-06 |
| PCDHA10__5 | 1.893e-10 | 3.78e-06 |
| PCDHA11__3 | 1.893e-10 | 3.78e-06 |
| PCDHA12__3 | 1.893e-10 | 3.78e-06 |
| PCDHA13__2 | 1.893e-10 | 3.78e-06 |
Figure S5. Get High-res Image As an example, this figure shows the association of BAHD1 to 'PATHOLOGY.M.STAGE'. P value = 1e-12 with ANOVA analysis.
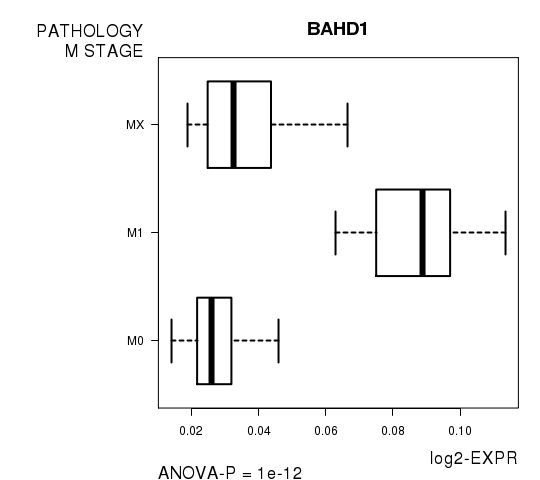
Table S12. Basic characteristics of clinical feature: 'GENDER'
| GENDER | Labels | N |
| FEMALE | 34 | |
| MALE | 76 | |
| Significant markers | N = 8 | |
| Higher in MALE | 5 | |
| Higher in FEMALE | 3 |
Table S13. Get Full Table List of 8 genes differentially expressed by 'GENDER'
| T(pos if higher in 'MALE') | ttestP | Q | AUC | |
|---|---|---|---|---|
| CCNYL1 | -9.6 | 1.468e-12 | 2.93e-08 | 0.9211 |
| NARFL | -7.41 | 3.988e-11 | 7.96e-07 | 0.8231 |
| PRKRIR | 7.71 | 9.936e-10 | 1.98e-05 | 0.9172 |
| HNRNPD | 7.06 | 8.319e-09 | 0.000166 | 0.8599 |
| FDPS | 5.88 | 5.483e-07 | 0.0109 | 0.8897 |
| RUSC1__1 | 5.88 | 5.483e-07 | 0.0109 | 0.8897 |
| KIF4B | -5.51 | 1.013e-06 | 0.0202 | 0.7988 |
| WBP11P1 | 5.5 | 1.528e-06 | 0.0305 | 0.8216 |
Figure S6. Get High-res Image As an example, this figure shows the association of CCNYL1 to 'GENDER'. P value = 1.47e-12 with T-test analysis.
No gene related to 'KARNOFSKY.PERFORMANCE.SCORE'.
Table S14. Basic characteristics of clinical feature: 'KARNOFSKY.PERFORMANCE.SCORE'
| KARNOFSKY.PERFORMANCE.SCORE | Mean (SD) | 92 (13) |
| Score | N | |
| 40 | 1 | |
| 90 | 10 | |
| 100 | 9 | |
| Significant markers | N = 0 |
-
Expresson data file = KIRP-TP.meth.by_min_expr_corr.data.txt
-
Clinical data file = KIRP-TP.clin.merged.picked.txt
-
Number of patients = 110
-
Number of genes = 19964
-
Number of clinical features = 9
For survival clinical features, Wald's test in univariate Cox regression analysis with proportional hazards model (Andersen and Gill 1982) was used to estimate the P values using the 'coxph' function in R. Kaplan-Meier survival curves were plot using the four quartile subgroups of patients based on expression levels
For continuous numerical clinical features, Spearman's rank correlation coefficients (Spearman 1904) and two-tailed P values were estimated using 'cor.test' function in R
For multi-class clinical features (ordinal or nominal), one-way analysis of variance (Howell 2002) was applied to compare the log2-expression levels between different clinical classes using 'anova' function in R
For two-class clinical features, two-tailed Student's t test with unequal variance (Lehmann and Romano 2005) was applied to compare the log2-expression levels between the two clinical classes using 't.test' function in R
For multiple hypothesis correction, Q value is the False Discovery Rate (FDR) analogue of the P value (Benjamini and Hochberg 1995), defined as the minimum FDR at which the test may be called significant. We used the 'Benjamini and Hochberg' method of 'p.adjust' function in R to convert P values into Q values.
In addition to the links below, the full results of the analysis summarized in this report can also be downloaded programmatically using firehose_get, or interactively from either the Broad GDAC website or TCGA Data Coordination Center Portal.