This pipeline uses various statistical tests to identify miRs whose expression levels correlated to selected clinical features.
Testing the association between 486 genes and 8 clinical features across 123 samples, statistically thresholded by Q value < 0.05, 4 clinical features related to at least one genes.
-
1 gene correlated to 'Time to Death'.
-
HSA-MIR-224
-
6 genes correlated to 'NEOPLASM.DISEASESTAGE'.
-
HSA-MIR-224 , HSA-MIR-452 , HSA-MIR-92A-1 , HSA-MIR-1245 , HSA-MIR-200A , ...
-
7 genes correlated to 'PATHOLOGY.T.STAGE'.
-
HSA-MIR-224 , HSA-MIR-452 , HSA-MIR-217 , HSA-MIR-200A , HSA-MIR-216A , ...
-
13 genes correlated to 'PATHOLOGY.M.STAGE'.
-
HSA-MIR-3607 , HSA-MIR-3647 , HSA-MIR-1277 , HSA-MIR-126 , HSA-MIR-1248 , ...
-
No genes correlated to 'AGE', 'PATHOLOGY.N.STAGE', 'GENDER', and 'KARNOFSKY.PERFORMANCE.SCORE'.
Complete statistical result table is provided in Supplement Table 1
Table 1. Get Full Table This table shows the clinical features, statistical methods used, and the number of genes that are significantly associated with each clinical feature at Q value < 0.05.
| Clinical feature | Statistical test | Significant genes | Associated with | Associated with | ||
|---|---|---|---|---|---|---|
| Time to Death | Cox regression test | N=1 | shorter survival | N=1 | longer survival | N=0 |
| AGE | Spearman correlation test | N=0 | ||||
| NEOPLASM DISEASESTAGE | ANOVA test | N=6 | ||||
| PATHOLOGY T STAGE | Spearman correlation test | N=7 | higher stage | N=5 | lower stage | N=2 |
| PATHOLOGY N STAGE | Spearman correlation test | N=0 | ||||
| PATHOLOGY M STAGE | ANOVA test | N=13 | ||||
| GENDER | t test | N=0 | ||||
| KARNOFSKY PERFORMANCE SCORE | Spearman correlation test | N=0 |
Table S1. Basic characteristics of clinical feature: 'Time to Death'
| Time to Death | Duration (Months) | 0-194.8 (median=14.1) |
| censored | N = 98 | |
| death | N = 15 | |
| Significant markers | N = 1 | |
| associated with shorter survival | 1 | |
| associated with longer survival | 0 |
Table S2. Get Full Table List of one gene significantly associated with 'Time to Death' by Cox regression test
| HazardRatio | Wald_P | Q | C_index | |
|---|---|---|---|---|
| HSA-MIR-224 | 2 | 2.751e-05 | 0.013 | 0.886 |
Figure S1. Get High-res Image As an example, this figure shows the association of HSA-MIR-224 to 'Time to Death'. four curves present the cumulative survival rates of 4 quartile subsets of patients. P value = 2.75e-05 with univariate Cox regression analysis using continuous log-2 expression values.
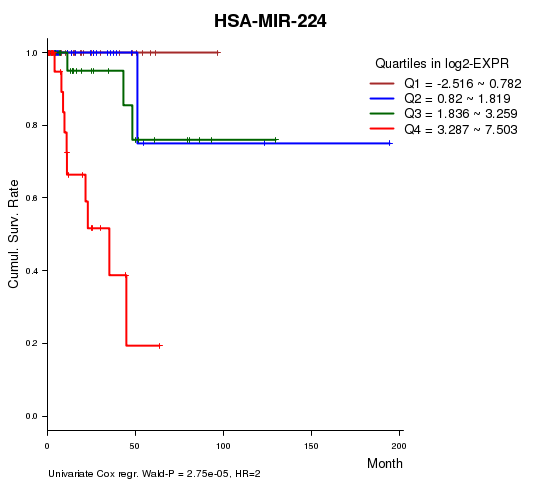
Table S3. Basic characteristics of clinical feature: 'AGE'
| AGE | Mean (SD) | 60.11 (12) |
| Significant markers | N = 0 |
Table S4. Basic characteristics of clinical feature: 'NEOPLASM.DISEASESTAGE'
| NEOPLASM.DISEASESTAGE | Labels | N |
| STAGE I | 64 | |
| STAGE II | 9 | |
| STAGE III | 30 | |
| STAGE IV | 10 | |
| Significant markers | N = 6 |
Table S5. Get Full Table List of 6 genes differentially expressed by 'NEOPLASM.DISEASESTAGE'
| ANOVA_P | Q | |
|---|---|---|
| HSA-MIR-224 | 9.744e-07 | 0.000474 |
| HSA-MIR-452 | 9.45e-06 | 0.00458 |
| HSA-MIR-92A-1 | 2.991e-05 | 0.0145 |
| HSA-MIR-1245 | 5.647e-05 | 0.0273 |
| HSA-MIR-200A | 6.456e-05 | 0.0311 |
| HSA-MIR-200B | 6.718e-05 | 0.0323 |
Figure S2. Get High-res Image As an example, this figure shows the association of HSA-MIR-224 to 'NEOPLASM.DISEASESTAGE'. P value = 9.74e-07 with ANOVA analysis.
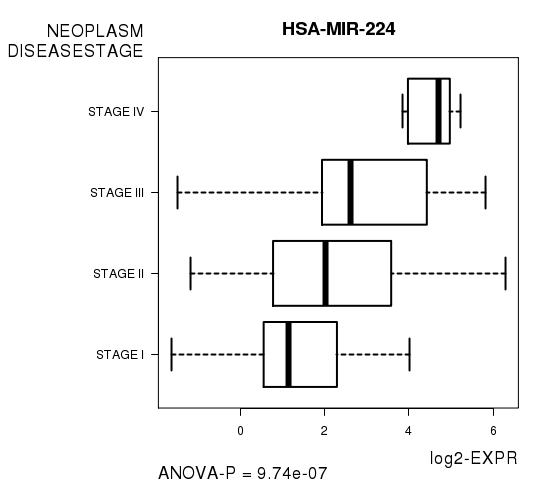
Table S6. Basic characteristics of clinical feature: 'PATHOLOGY.T.STAGE'
| PATHOLOGY.T.STAGE | Mean (SD) | 1.76 (0.92) |
| N | ||
| 1 | 69 | |
| 2 | 15 | |
| 3 | 38 | |
| 4 | 1 | |
| Significant markers | N = 7 | |
| pos. correlated | 5 | |
| neg. correlated | 2 |
Table S7. Get Full Table List of 7 genes significantly correlated to 'PATHOLOGY.T.STAGE' by Spearman correlation test
| SpearmanCorr | corrP | Q | |
|---|---|---|---|
| HSA-MIR-224 | 0.4282 | 8.648e-07 | 0.00042 |
| HSA-MIR-452 | 0.4095 | 2.559e-06 | 0.00124 |
| HSA-MIR-217 | 0.3954 | 1.119e-05 | 0.00541 |
| HSA-MIR-200A | -0.3834 | 1.201e-05 | 0.0058 |
| HSA-MIR-216A | 0.5002 | 1.635e-05 | 0.00788 |
| HSA-MIR-200B | -0.3575 | 4.918e-05 | 0.0237 |
| HSA-MIR-92A-1 | 0.3507 | 6.969e-05 | 0.0335 |
Figure S3. Get High-res Image As an example, this figure shows the association of HSA-MIR-224 to 'PATHOLOGY.T.STAGE'. P value = 8.65e-07 with Spearman correlation analysis.
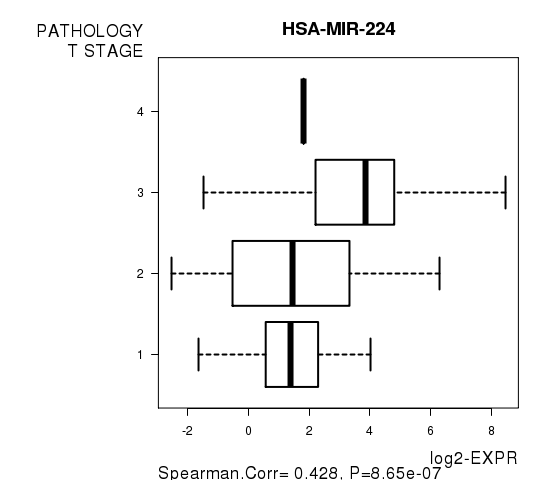
Table S8. Basic characteristics of clinical feature: 'PATHOLOGY.N.STAGE'
| PATHOLOGY.N.STAGE | Mean (SD) | 0.49 (0.68) |
| N | ||
| 0 | 25 | |
| 1 | 12 | |
| 2 | 4 | |
| Significant markers | N = 0 |
Table S9. Basic characteristics of clinical feature: 'PATHOLOGY.M.STAGE'
| PATHOLOGY.M.STAGE | Labels | N |
| M0 | 55 | |
| M1 | 6 | |
| MX | 53 | |
| Significant markers | N = 13 |
Table S10. Get Full Table List of top 10 genes differentially expressed by 'PATHOLOGY.M.STAGE'
| ANOVA_P | Q | |
|---|---|---|
| HSA-MIR-3607 | 3.389e-10 | 1.65e-07 |
| HSA-MIR-3647 | 5.839e-10 | 2.83e-07 |
| HSA-MIR-1277 | 2.275e-06 | 0.0011 |
| HSA-MIR-126 | 2.855e-06 | 0.00138 |
| HSA-MIR-1248 | 3.126e-06 | 0.00151 |
| HSA-MIR-1245 | 6.395e-06 | 0.00308 |
| HSA-MIR-16-1 | 6.548e-06 | 0.00314 |
| HSA-MIR-3653 | 7.865e-06 | 0.00377 |
| HSA-MIR-424 | 1.498e-05 | 0.00716 |
| HSA-MIR-26A-1 | 3.271e-05 | 0.0156 |
Figure S4. Get High-res Image As an example, this figure shows the association of HSA-MIR-3607 to 'PATHOLOGY.M.STAGE'. P value = 3.39e-10 with ANOVA analysis.
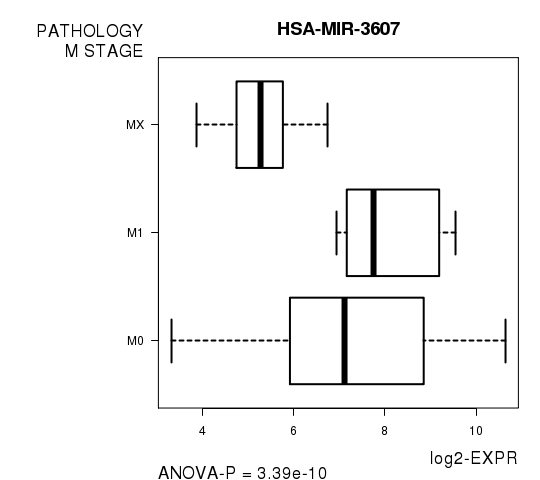
Table S11. Basic characteristics of clinical feature: 'GENDER'
| GENDER | Labels | N |
| FEMALE | 38 | |
| MALE | 85 | |
| Significant markers | N = 0 |
-
Expresson data file = KIRP-TP.miRseq_RPKM_log2.txt
-
Clinical data file = KIRP-TP.clin.merged.picked.txt
-
Number of patients = 123
-
Number of genes = 486
-
Number of clinical features = 8
For survival clinical features, Wald's test in univariate Cox regression analysis with proportional hazards model (Andersen and Gill 1982) was used to estimate the P values using the 'coxph' function in R. Kaplan-Meier survival curves were plot using the four quartile subgroups of patients based on expression levels
For continuous numerical clinical features, Spearman's rank correlation coefficients (Spearman 1904) and two-tailed P values were estimated using 'cor.test' function in R
For multi-class clinical features (ordinal or nominal), one-way analysis of variance (Howell 2002) was applied to compare the log2-expression levels between different clinical classes using 'anova' function in R
For two-class clinical features, two-tailed Student's t test with unequal variance (Lehmann and Romano 2005) was applied to compare the log2-expression levels between the two clinical classes using 't.test' function in R
For multiple hypothesis correction, Q value is the False Discovery Rate (FDR) analogue of the P value (Benjamini and Hochberg 1995), defined as the minimum FDR at which the test may be called significant. We used the 'Benjamini and Hochberg' method of 'p.adjust' function in R to convert P values into Q values.
In addition to the links below, the full results of the analysis summarized in this report can also be downloaded programmatically using firehose_get, or interactively from either the Broad GDAC website or TCGA Data Coordination Center Portal.