This report serves to describe the mutational landscape and properties of a given individual set, as well as rank genes and genesets according to mutational significance. MutSig v1.5 was used to generate the results found in this report.
-
Working with individual set: KIRP-TP
-
Number of patients in set: 112
The input for this pipeline is a set of individuals with the following files associated for each:
-
An annotated .maf file describing the mutations called for the respective individual, and their properties.
-
A .wig file that contains information about the coverage of the sample.
-
MAF used for this analysis:KIRP-TP.final_analysis_set.maf
-
Significantly mutated genes (q ≤ 0.1): 19
-
Mutations seen in COSMIC: 43
-
Significantly mutated genes in COSMIC territory: 11
-
Genes with clustered mutations (≤ 3 aa apart): 72
-
Significantly mutated genesets: 0
-
Significantly mutated genesets: (excluding sig. mutated genes):0
-
Read 112 MAFs of type "Broad"
-
Total number of mutations in input MAFs: 10029
-
After removing 78 mutations outside chr1-24: 9951
-
After removing 285 noncoding mutations: 9666
-
After collapsing adjacent/redundant mutations: 8213
-
Number of mutations before filtering: 8213
-
After removing 413 mutations outside gene set: 7800
-
After removing 9 mutations outside category set: 7791
-
After removing 2 "impossible" mutations in
-
gene-patient-category bins of zero coverage: 7367
Table 1. Get Full Table Table representing breakdown of mutations by type.
| type | count |
|---|---|
| Frame_Shift_Del | 511 |
| Frame_Shift_Ins | 199 |
| In_Frame_Del | 166 |
| In_Frame_Ins | 38 |
| Missense_Mutation | 4569 |
| Nonsense_Mutation | 248 |
| Nonstop_Mutation | 7 |
| Silent | 1705 |
| Splice_Site | 345 |
| Translation_Start_Site | 3 |
| Total | 7791 |
Table 2. Get Full Table A breakdown of mutation rates per category discovered for this individual set.
| category | n | N | rate | rate_per_mb | relative_rate | exp_ns_s_ratio |
|---|---|---|---|---|---|---|
| *CpG->T | 477 | 186386483 | 2.6e-06 | 2.6 | 1.4 | 2.1 |
| *Cp(A/C/T)->T | 863 | 1509673770 | 5.7e-07 | 0.57 | 0.31 | 1.7 |
| A->G | 861 | 1622585631 | 5.3e-07 | 0.53 | 0.29 | 2.3 |
| transver | 2368 | 3318645884 | 7.1e-07 | 0.71 | 0.39 | 5 |
| indel+null | 1506 | 3318645884 | 4.5e-07 | 0.45 | 0.25 | NaN |
| double_null | 9 | 3318645884 | 2.7e-09 | 0.0027 | 0.0015 | NaN |
| Total | 6084 | 3318645884 | 1.8e-06 | 1.8 | 1 | 3.5 |
The x axis represents the samples. The y axis represents the exons, one row per exon, and they are sorted by average coverage across samples. For exons with exactly the same average coverage, they are sorted next by the %GC of the exon. (The secondary sort is especially useful for the zero-coverage exons at the bottom).
Figure 1.
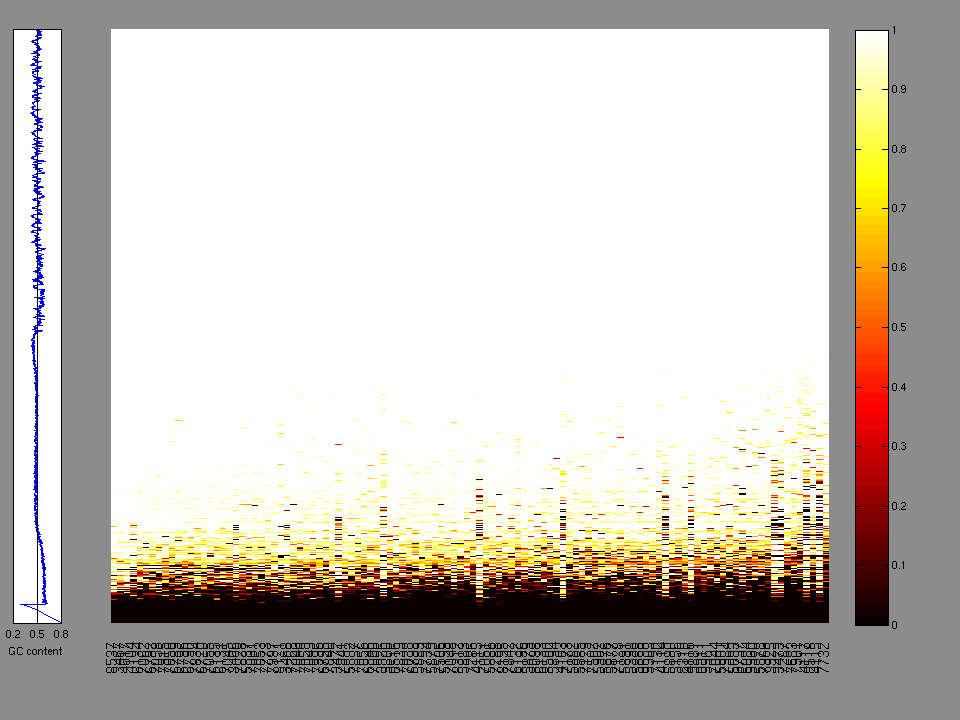
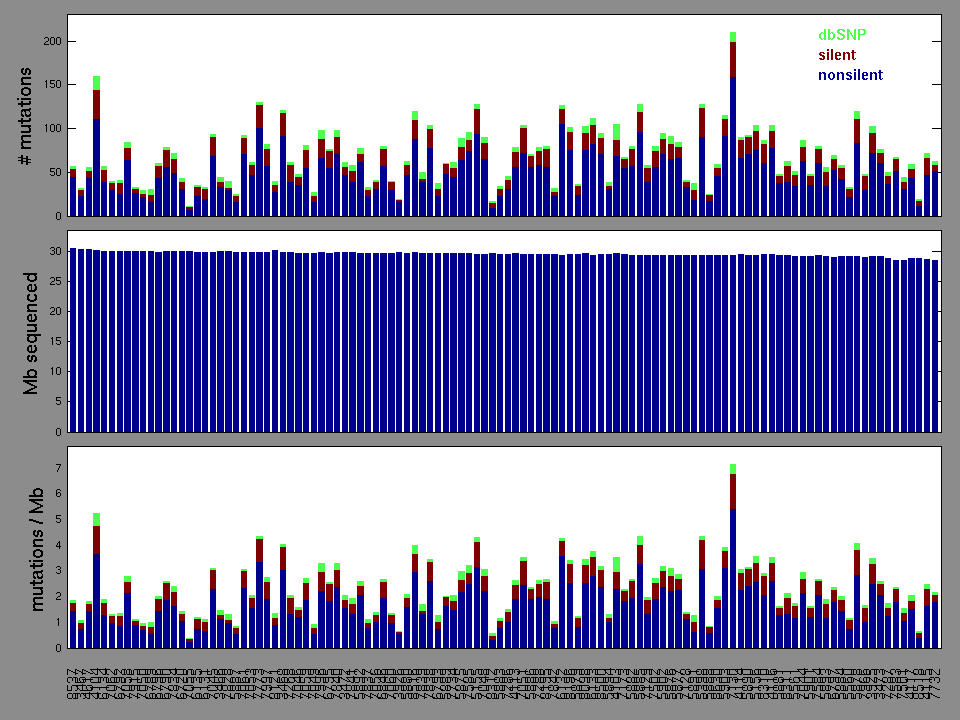
Figure 2. Patients counts and rates file used to generate this plot: KIRP-TP.patients.counts_and_rates.txt
The mutation spectrum is depicted in the lego plots below in which the 96 possible mutation types are subdivided into six large blocks, color-coded to reflect the base substitution type. Each large block is further subdivided into the 16 possible pairs of 5' and 3' neighbors, as listed in the 4x4 trinucleotide context legend. The height of each block corresponds to the mutation frequency for that kind of mutation (counts of mutations normalized by the base coverage in a given bin). The shape of the spectrum is a signature for dominant mutational mechanisms in different tumor types.
Figure 3. Get High-res Image SNV Mutation rate lego plot for entire set. Each bin is normalized by base coverage for that bin. Colors represent the six SNV types on the upper right. The three-base context for each mutation is labeled in the 4x4 legend on the lower right. The fractional breakdown of SNV counts is shown in the pie chart on the upper left. If this figure is blank, not enough information was provided in the MAF to generate it.

Figure 4. Get High-res Image SNV Mutation rate lego plots for 4 slices of mutation allele fraction (0<=AF<0.1, 0.1<=AF<0.25, 0.25<=AF<0.5, & 0.5<=AF) . The color code and three-base context legends are the same as the previous figure. If this figure is blank, not enough information was provided in the MAF to generate it.

Figure 5. Get High-res Image The matrix in the center of the figure represents individual mutations in patient samples, color-coded by type of mutation, for the significantly mutated genes. The rate of synonymous and non-synonymous mutations is displayed at the top of the matrix. The barplot on the left of the matrix shows the number of mutations in each gene. The percentages represent the fraction of tumors with at least one mutation in the specified gene. The barplot to the right of the matrix displays the q-values for the most significantly mutated genes. The purple boxplots below the matrix (only displayed if required columns are present in the provided MAF) represent the distributions of allelic fractions observed in each sample. The plot at the bottom represents the base substitution distribution of individual samples, using the same categories that were used to calculate significance.

Column Descriptions:
-
N = number of sequenced bases in this gene across the individual set
-
n = number of (nonsilent) mutations in this gene across the individual set
-
npat = number of patients (individuals) with at least one nonsilent mutation
-
nsite = number of unique sites having a non-silent mutation
-
nsil = number of silent mutations in this gene across the individual set
-
n1 = number of nonsilent mutations of type: *CpG->T
-
n2 = number of nonsilent mutations of type: *Cp(A/C/T)->T
-
n3 = number of nonsilent mutations of type: A->G
-
n4 = number of nonsilent mutations of type: transver
-
n5 = number of nonsilent mutations of type: indel+null
-
n6 = number of nonsilent mutations of type: double_null
-
p_ns_s = p-value for the observed nonsilent/silent ratio being elevated in this gene
-
p = p-value (overall)
-
q = q-value, False Discovery Rate (Benjamini-Hochberg procedure)
Table 3. Get Full Table A Ranked List of Significantly Mutated Genes. Number of significant genes found: 19. Number of genes displayed: 35. Click on a gene name to display its stick figure depicting the distribution of mutations and mutation types across the chosen gene (this feature may not be available for all significant genes).
| rank | gene | description | N | n | npat | nsite | nsil | n1 | n2 | n3 | n4 | n5 | n6 | p_ns_s | p | q |
|---|---|---|---|---|---|---|---|---|---|---|---|---|---|---|---|---|
| 1 | MUC4 | mucin 4, cell surface associated | 365020 | 12 | 11 | 9 | 1 | 1 | 2 | 2 | 7 | 0 | 0 | 0.12 | 3e-10 | 5.5e-06 |
| 2 | PLAC4 | placenta-specific 4 | 20310 | 5 | 4 | 4 | 0 | 0 | 0 | 1 | 0 | 4 | 0 | 0.74 | 1.2e-09 | 1e-05 |
| 3 | NF2 | neurofibromin 2 (merlin) | 181882 | 7 | 7 | 7 | 0 | 0 | 0 | 0 | 0 | 7 | 0 | 0.43 | 2.4e-08 | 0.00015 |
| 4 | MET | met proto-oncogene (hepatocyte growth factor receptor) | 478818 | 9 | 9 | 8 | 0 | 0 | 3 | 2 | 4 | 0 | 0 | 0.065 | 7.7e-08 | 0.00035 |
| 5 | KRTAP4-11 | keratin associated protein 4-11 | 60031 | 4 | 4 | 3 | 1 | 0 | 0 | 2 | 2 | 0 | 0 | 0.83 | 3.3e-07 | 0.0012 |
| 6 | NBPF1 | neuroblastoma breakpoint family, member 1 | 371646 | 8 | 7 | 2 | 0 | 0 | 1 | 0 | 0 | 7 | 0 | 0.021 | 1.3e-06 | 0.0039 |
| 7 | IL32 | interleukin 32 | 62375 | 4 | 4 | 2 | 0 | 0 | 0 | 0 | 0 | 4 | 0 | 1 | 3.8e-06 | 0.0098 |
| 8 | LGI4 | leucine-rich repeat LGI family, member 4 | 78713 | 4 | 4 | 4 | 0 | 0 | 1 | 1 | 2 | 0 | 0 | 0.28 | 7.2e-06 | 0.016 |
| 9 | PARD6B | par-6 partitioning defective 6 homolog beta (C. elegans) | 118830 | 4 | 4 | 4 | 0 | 0 | 0 | 2 | 0 | 2 | 0 | 0.26 | 0.000016 | 0.033 |
| 10 | STAG3L2 | stromal antigen 3-like 2 | 30982 | 3 | 3 | 1 | 0 | 0 | 0 | 0 | 0 | 3 | 0 | 1 | 0.000023 | 0.038 |
| 11 | HRCT1 | histidine rich carboxyl terminus 1 | 34801 | 3 | 3 | 2 | 0 | 0 | 0 | 0 | 2 | 1 | 0 | 0.6 | 0.000023 | 0.038 |
| 12 | BHMT | betaine-homocysteine methyltransferase | 139714 | 4 | 4 | 4 | 0 | 0 | 0 | 2 | 0 | 2 | 0 | 0.31 | 0.000026 | 0.039 |
| 13 | ATP1B1 | ATPase, Na+/K+ transporting, beta 1 polypeptide | 104177 | 4 | 4 | 4 | 0 | 0 | 0 | 1 | 1 | 2 | 0 | 0.61 | 0.000032 | 0.044 |
| 14 | NUDT11 | nudix (nucleoside diphosphate linked moiety X)-type motif 11 | 47767 | 3 | 3 | 2 | 0 | 1 | 0 | 0 | 0 | 2 | 0 | 0.61 | 0.000037 | 0.048 |
| 15 | FOXE1 | forkhead box E1 (thyroid transcription factor 2) | 51983 | 3 | 3 | 1 | 0 | 0 | 0 | 0 | 0 | 3 | 0 | 1 | 0.000045 | 0.054 |
| 16 | OR2T35 | olfactory receptor, family 2, subfamily T, member 35 | 33964 | 2 | 2 | 1 | 0 | 0 | 0 | 0 | 0 | 2 | 0 | 1 | 0.000065 | 0.074 |
| 17 | PCDHGC5 | protocadherin gamma subfamily C, 5 | 324524 | 15 | 13 | 15 | 6 | 0 | 3 | 4 | 3 | 4 | 1 | 0.67 | 0.000078 | 0.084 |
| 18 | COCH | coagulation factor C homolog, cochlin (Limulus polyphemus) | 186274 | 4 | 4 | 4 | 0 | 1 | 0 | 1 | 2 | 0 | 0 | 0.31 | 9e-05 | 0.091 |
| 19 | CHCHD3 | coiled-coil-helix-coiled-coil-helix domain containing 3 | 70947 | 3 | 3 | 3 | 0 | 0 | 1 | 0 | 2 | 0 | 0 | 0.46 | 0.0001 | 0.099 |
| 20 | KDM6A | lysine (K)-specific demethylase 6A | 440212 | 5 | 5 | 5 | 0 | 0 | 0 | 0 | 0 | 4 | 1 | 0.52 | 0.00014 | 0.12 |
| 21 | POMC | proopiomelanocortin (adrenocorticotropin/ beta-lipotropin/ alpha-melanocyte stimulating hormone/ beta-melanocyte stimulating hormone/ beta-endorphin) | 64181 | 3 | 3 | 3 | 0 | 1 | 0 | 0 | 1 | 1 | 0 | 0.52 | 0.00015 | 0.13 |
| 22 | CD86 | CD86 molecule | 113374 | 3 | 3 | 3 | 0 | 1 | 0 | 0 | 1 | 1 | 0 | 0.6 | 0.00018 | 0.14 |
| 23 | SETD2 | SET domain containing 2 | 712734 | 7 | 7 | 7 | 0 | 0 | 0 | 0 | 2 | 5 | 0 | 0.38 | 0.00018 | 0.14 |
| 24 | ACTB | actin, beta | 128574 | 3 | 3 | 3 | 0 | 0 | 0 | 3 | 0 | 0 | 0 | 0.66 | 0.00018 | 0.14 |
| 25 | SAV1 | salvador homolog 1 (Drosophila) | 129761 | 3 | 3 | 3 | 0 | 0 | 1 | 0 | 0 | 2 | 0 | 0.74 | 0.0002 | 0.15 |
| 26 | POTEC | POTE ankyrin domain family, member C | 167445 | 3 | 3 | 3 | 0 | 1 | 1 | 0 | 0 | 1 | 0 | 0.35 | 0.00024 | 0.17 |
| 27 | ACADL | acyl-Coenzyme A dehydrogenase, long chain | 137888 | 3 | 3 | 3 | 0 | 0 | 1 | 1 | 0 | 1 | 0 | 0.47 | 0.0003 | 0.2 |
| 28 | OR8I2 | olfactory receptor, family 8, subfamily I, member 2 | 103742 | 3 | 3 | 3 | 0 | 1 | 0 | 0 | 1 | 1 | 0 | 0.49 | 0.00031 | 0.2 |
| 29 | SIGIRR | single immunoglobulin and toll-interleukin 1 receptor (TIR) domain | 110202 | 3 | 3 | 3 | 0 | 0 | 0 | 2 | 1 | 0 | 0 | 0.54 | 0.00032 | 0.2 |
| 30 | JUNB | jun B proto-oncogene | 59055 | 2 | 2 | 2 | 0 | 0 | 1 | 1 | 0 | 0 | 0 | 0.47 | 0.00037 | 0.22 |
| 31 | NR2F2 | nuclear receptor subfamily 2, group F, member 2 | 119122 | 3 | 3 | 3 | 0 | 0 | 0 | 1 | 1 | 1 | 0 | 0.68 | 0.00038 | 0.22 |
| 32 | OR4A16 | olfactory receptor, family 4, subfamily A, member 16 | 109280 | 3 | 3 | 3 | 0 | 0 | 1 | 1 | 1 | 0 | 0 | 0.36 | 0.00039 | 0.22 |
| 33 | SLC5A12 | solute carrier family 5 (sodium/glucose cotransporter), member 12 | 203934 | 4 | 4 | 4 | 1 | 0 | 0 | 2 | 2 | 0 | 0 | 0.58 | 0.0004 | 0.22 |
| 34 | BAP1 | BRCA1 associated protein-1 (ubiquitin carboxy-terminal hydrolase) | 230198 | 4 | 4 | 4 | 1 | 0 | 1 | 1 | 0 | 2 | 0 | 0.62 | 0.00041 | 0.22 |
| 35 | ATP10A | ATPase, class V, type 10A | 492393 | 5 | 5 | 5 | 0 | 0 | 2 | 0 | 1 | 2 | 0 | 0.16 | 0.00047 | 0.24 |
Figure S1. This figure depicts the distribution of mutations and mutation types across the MUC4 significant gene.

Figure S2. This figure depicts the distribution of mutations and mutation types across the PLAC4 significant gene.
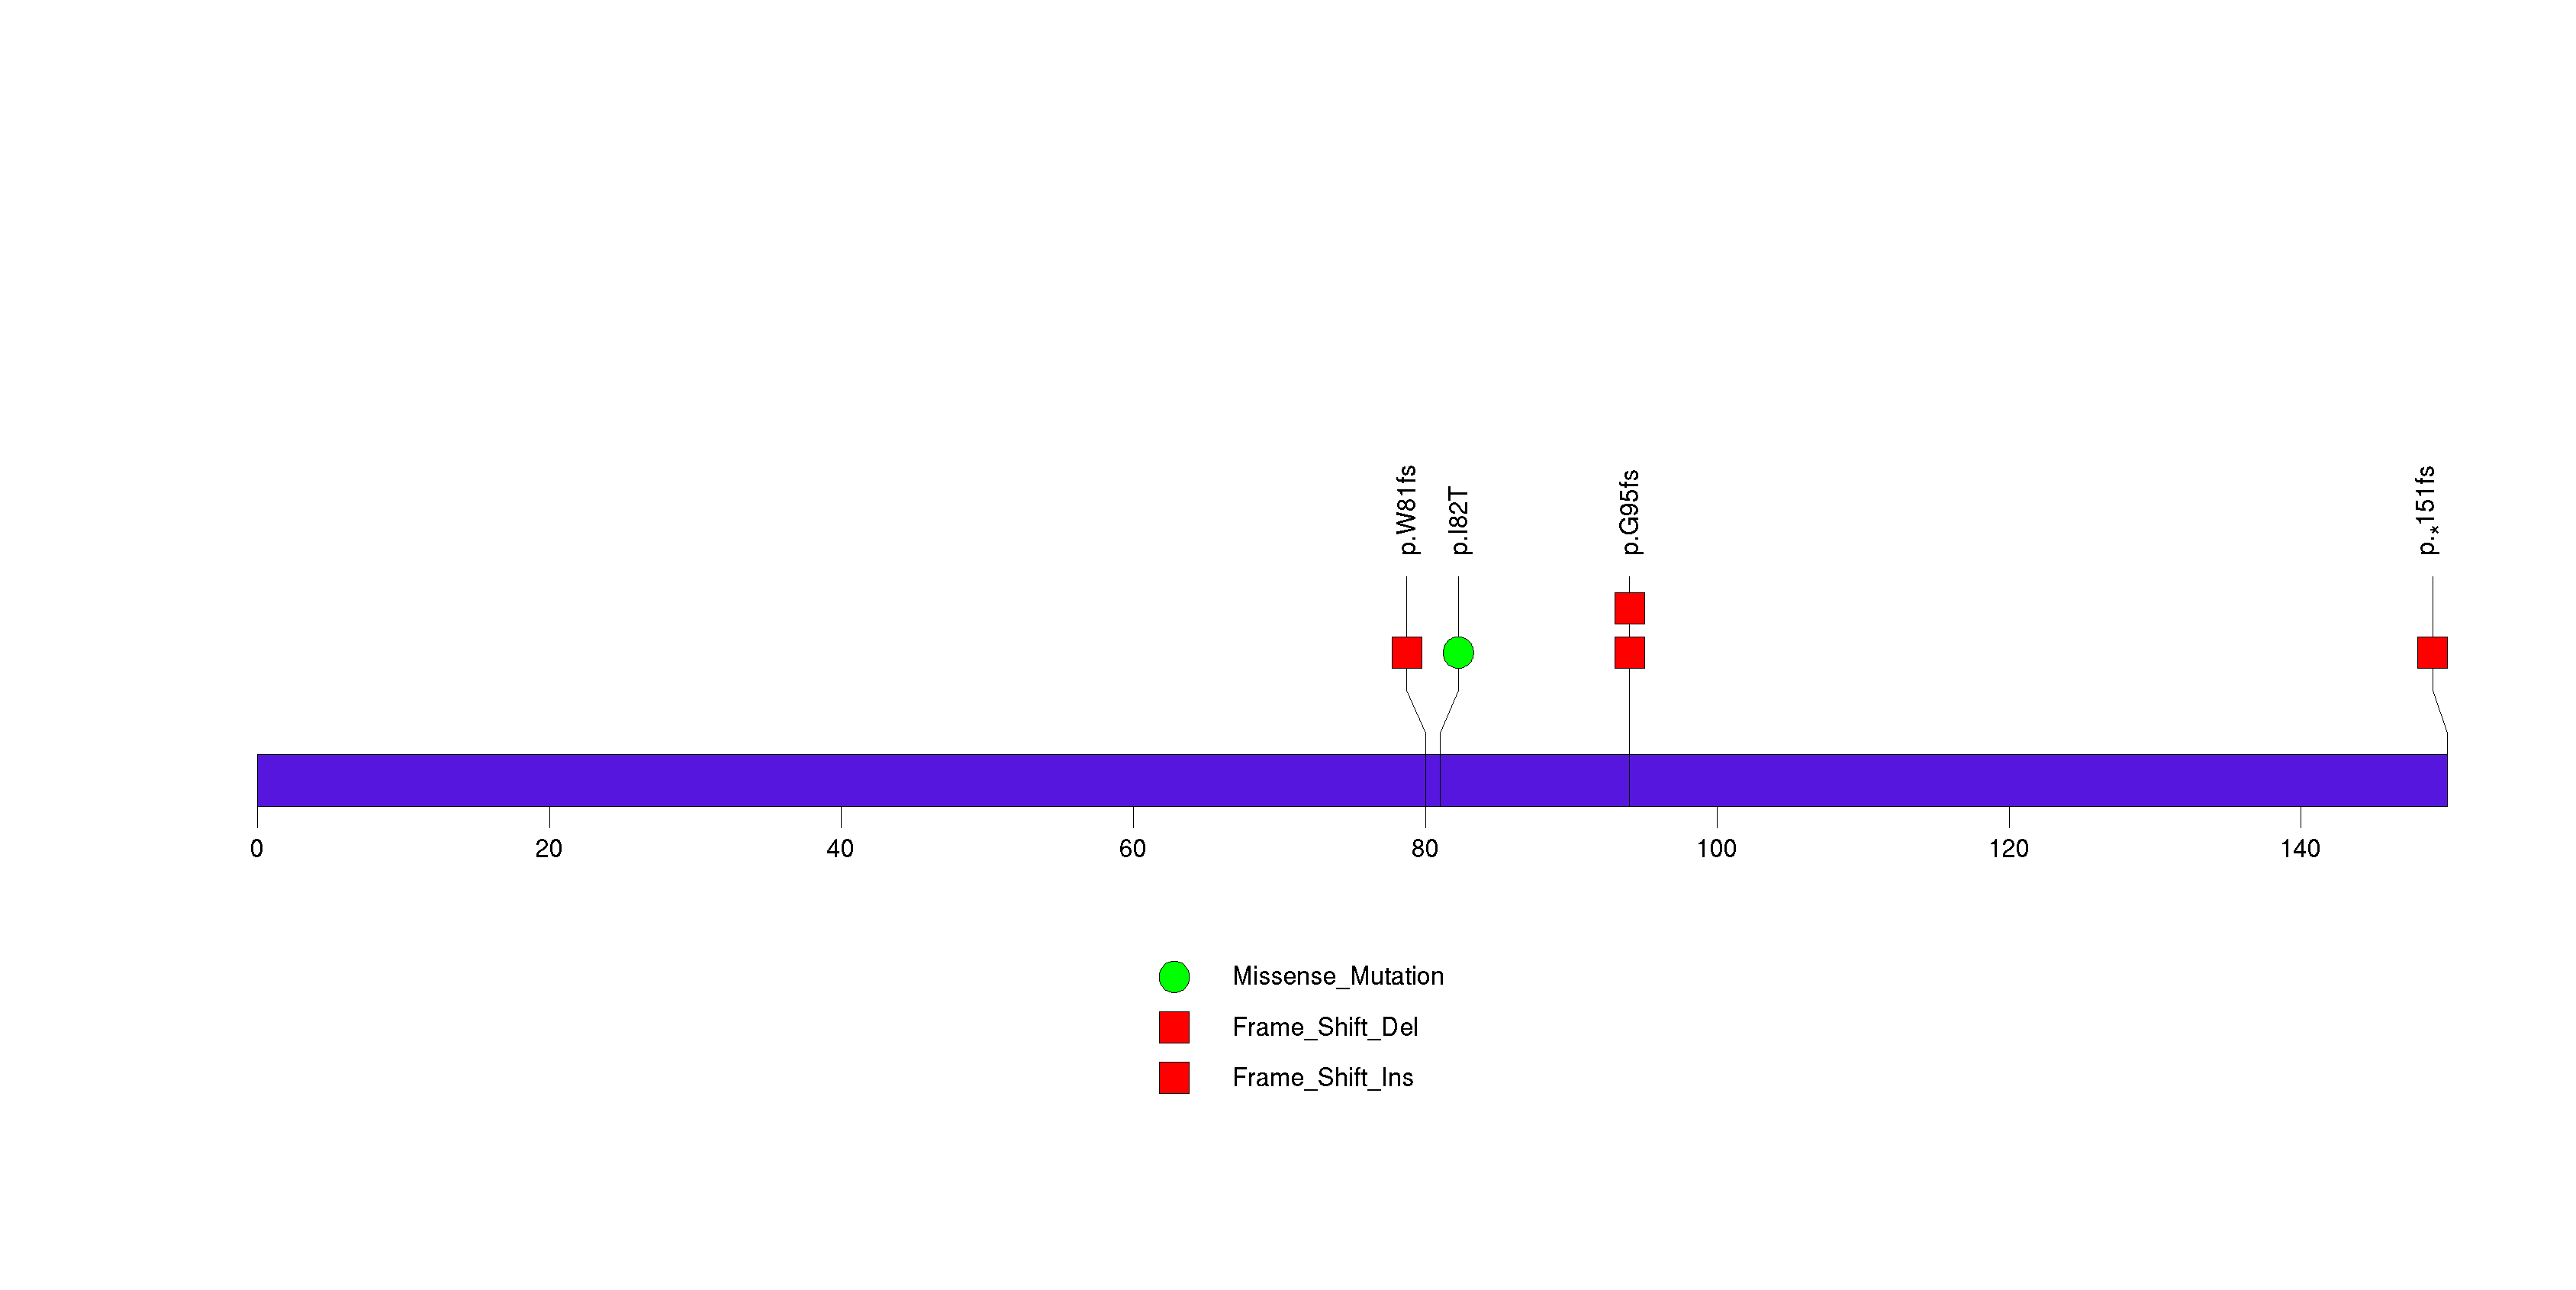
Figure S3. This figure depicts the distribution of mutations and mutation types across the NF2 significant gene.
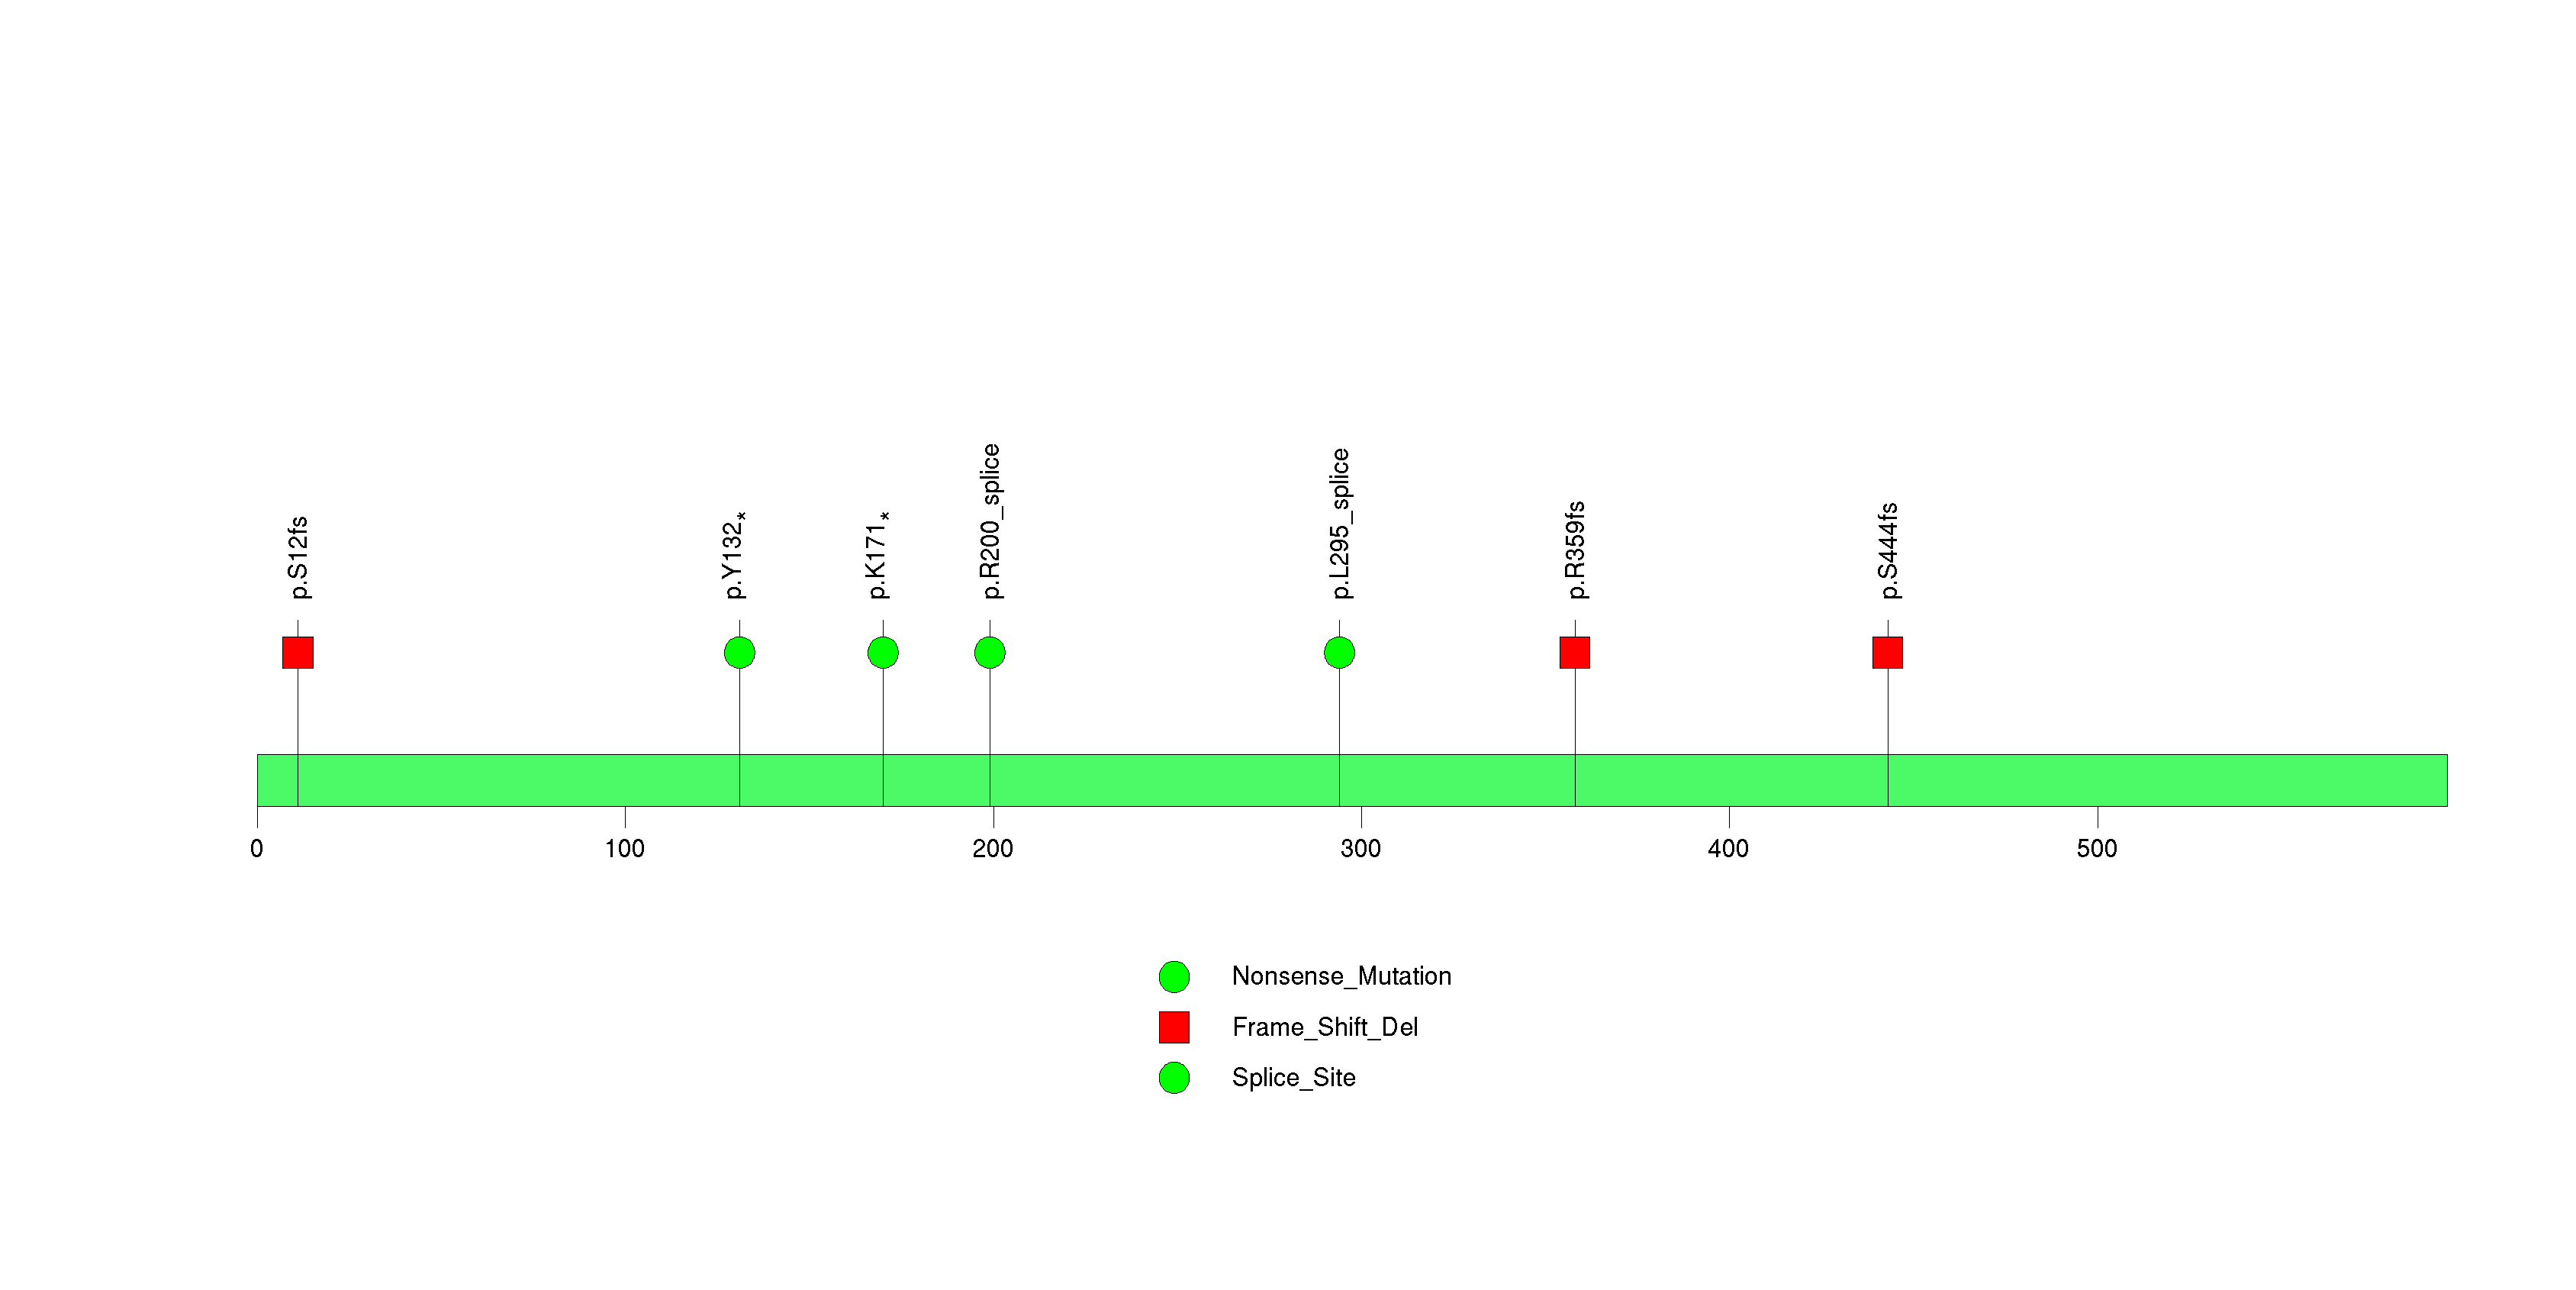
Figure S4. This figure depicts the distribution of mutations and mutation types across the MET significant gene.

Figure S5. This figure depicts the distribution of mutations and mutation types across the KRTAP4-11 significant gene.

Figure S6. This figure depicts the distribution of mutations and mutation types across the NBPF1 significant gene.

Figure S7. This figure depicts the distribution of mutations and mutation types across the IL32 significant gene.
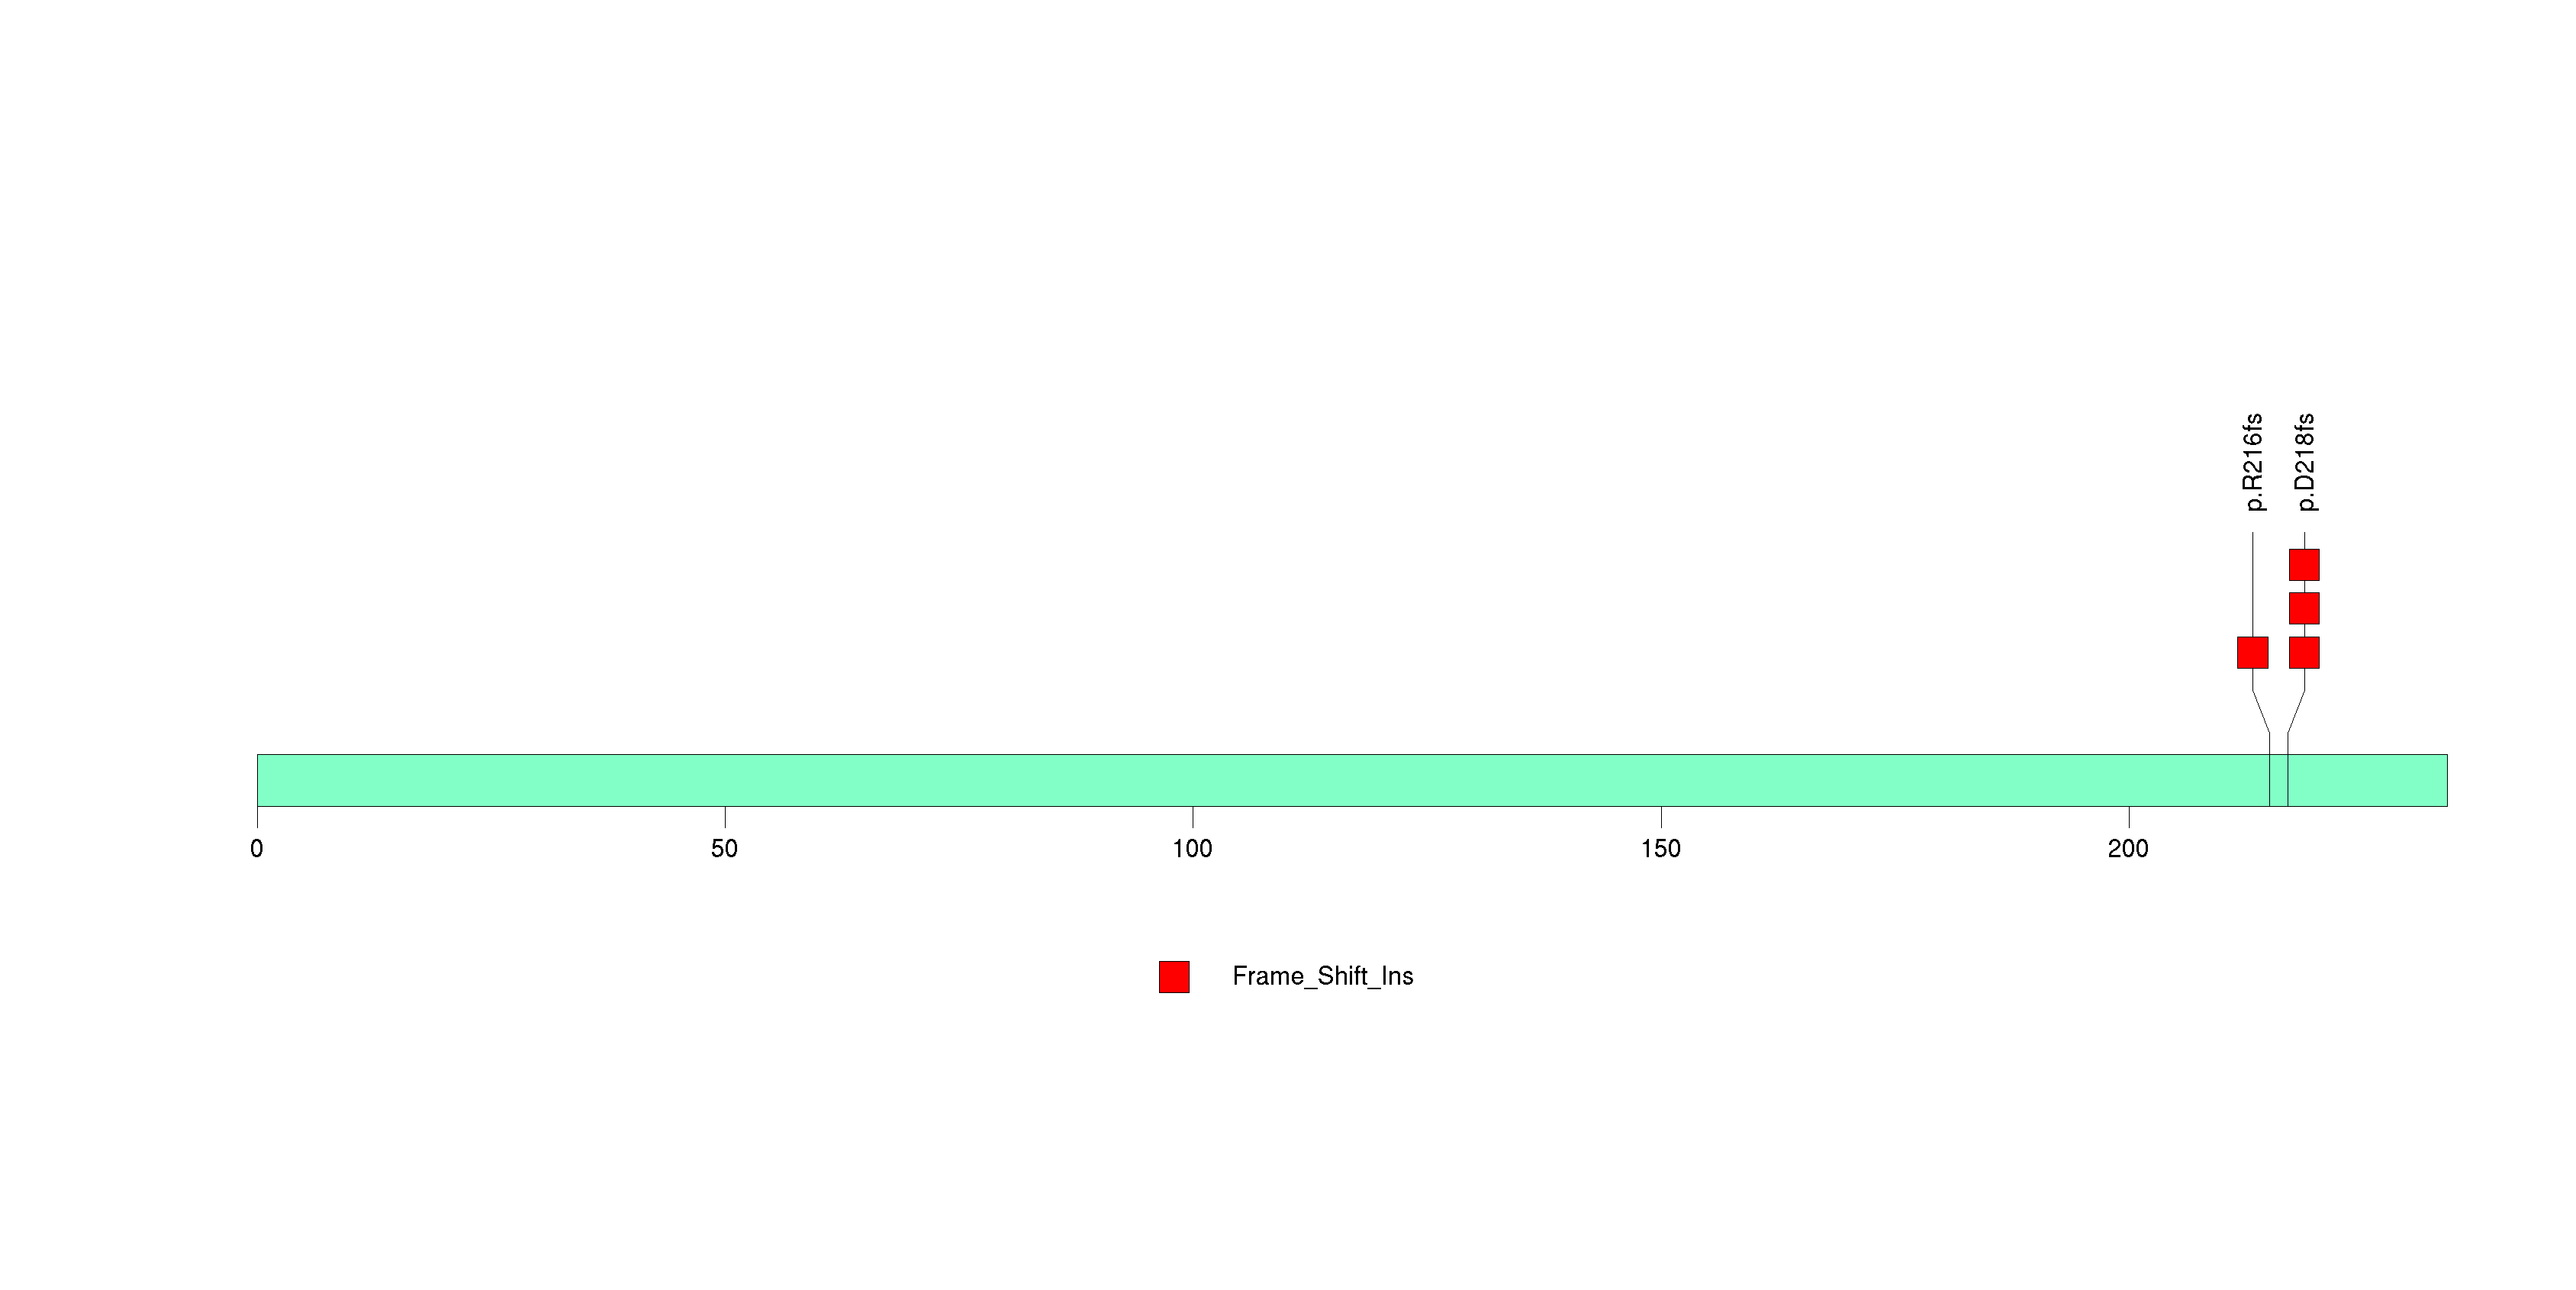
Figure S8. This figure depicts the distribution of mutations and mutation types across the LGI4 significant gene.

Figure S9. This figure depicts the distribution of mutations and mutation types across the PARD6B significant gene.
Figure S10. This figure depicts the distribution of mutations and mutation types across the HRCT1 significant gene.

Figure S11. This figure depicts the distribution of mutations and mutation types across the BHMT significant gene.
Figure S12. This figure depicts the distribution of mutations and mutation types across the ATP1B1 significant gene.

Figure S13. This figure depicts the distribution of mutations and mutation types across the NUDT11 significant gene.
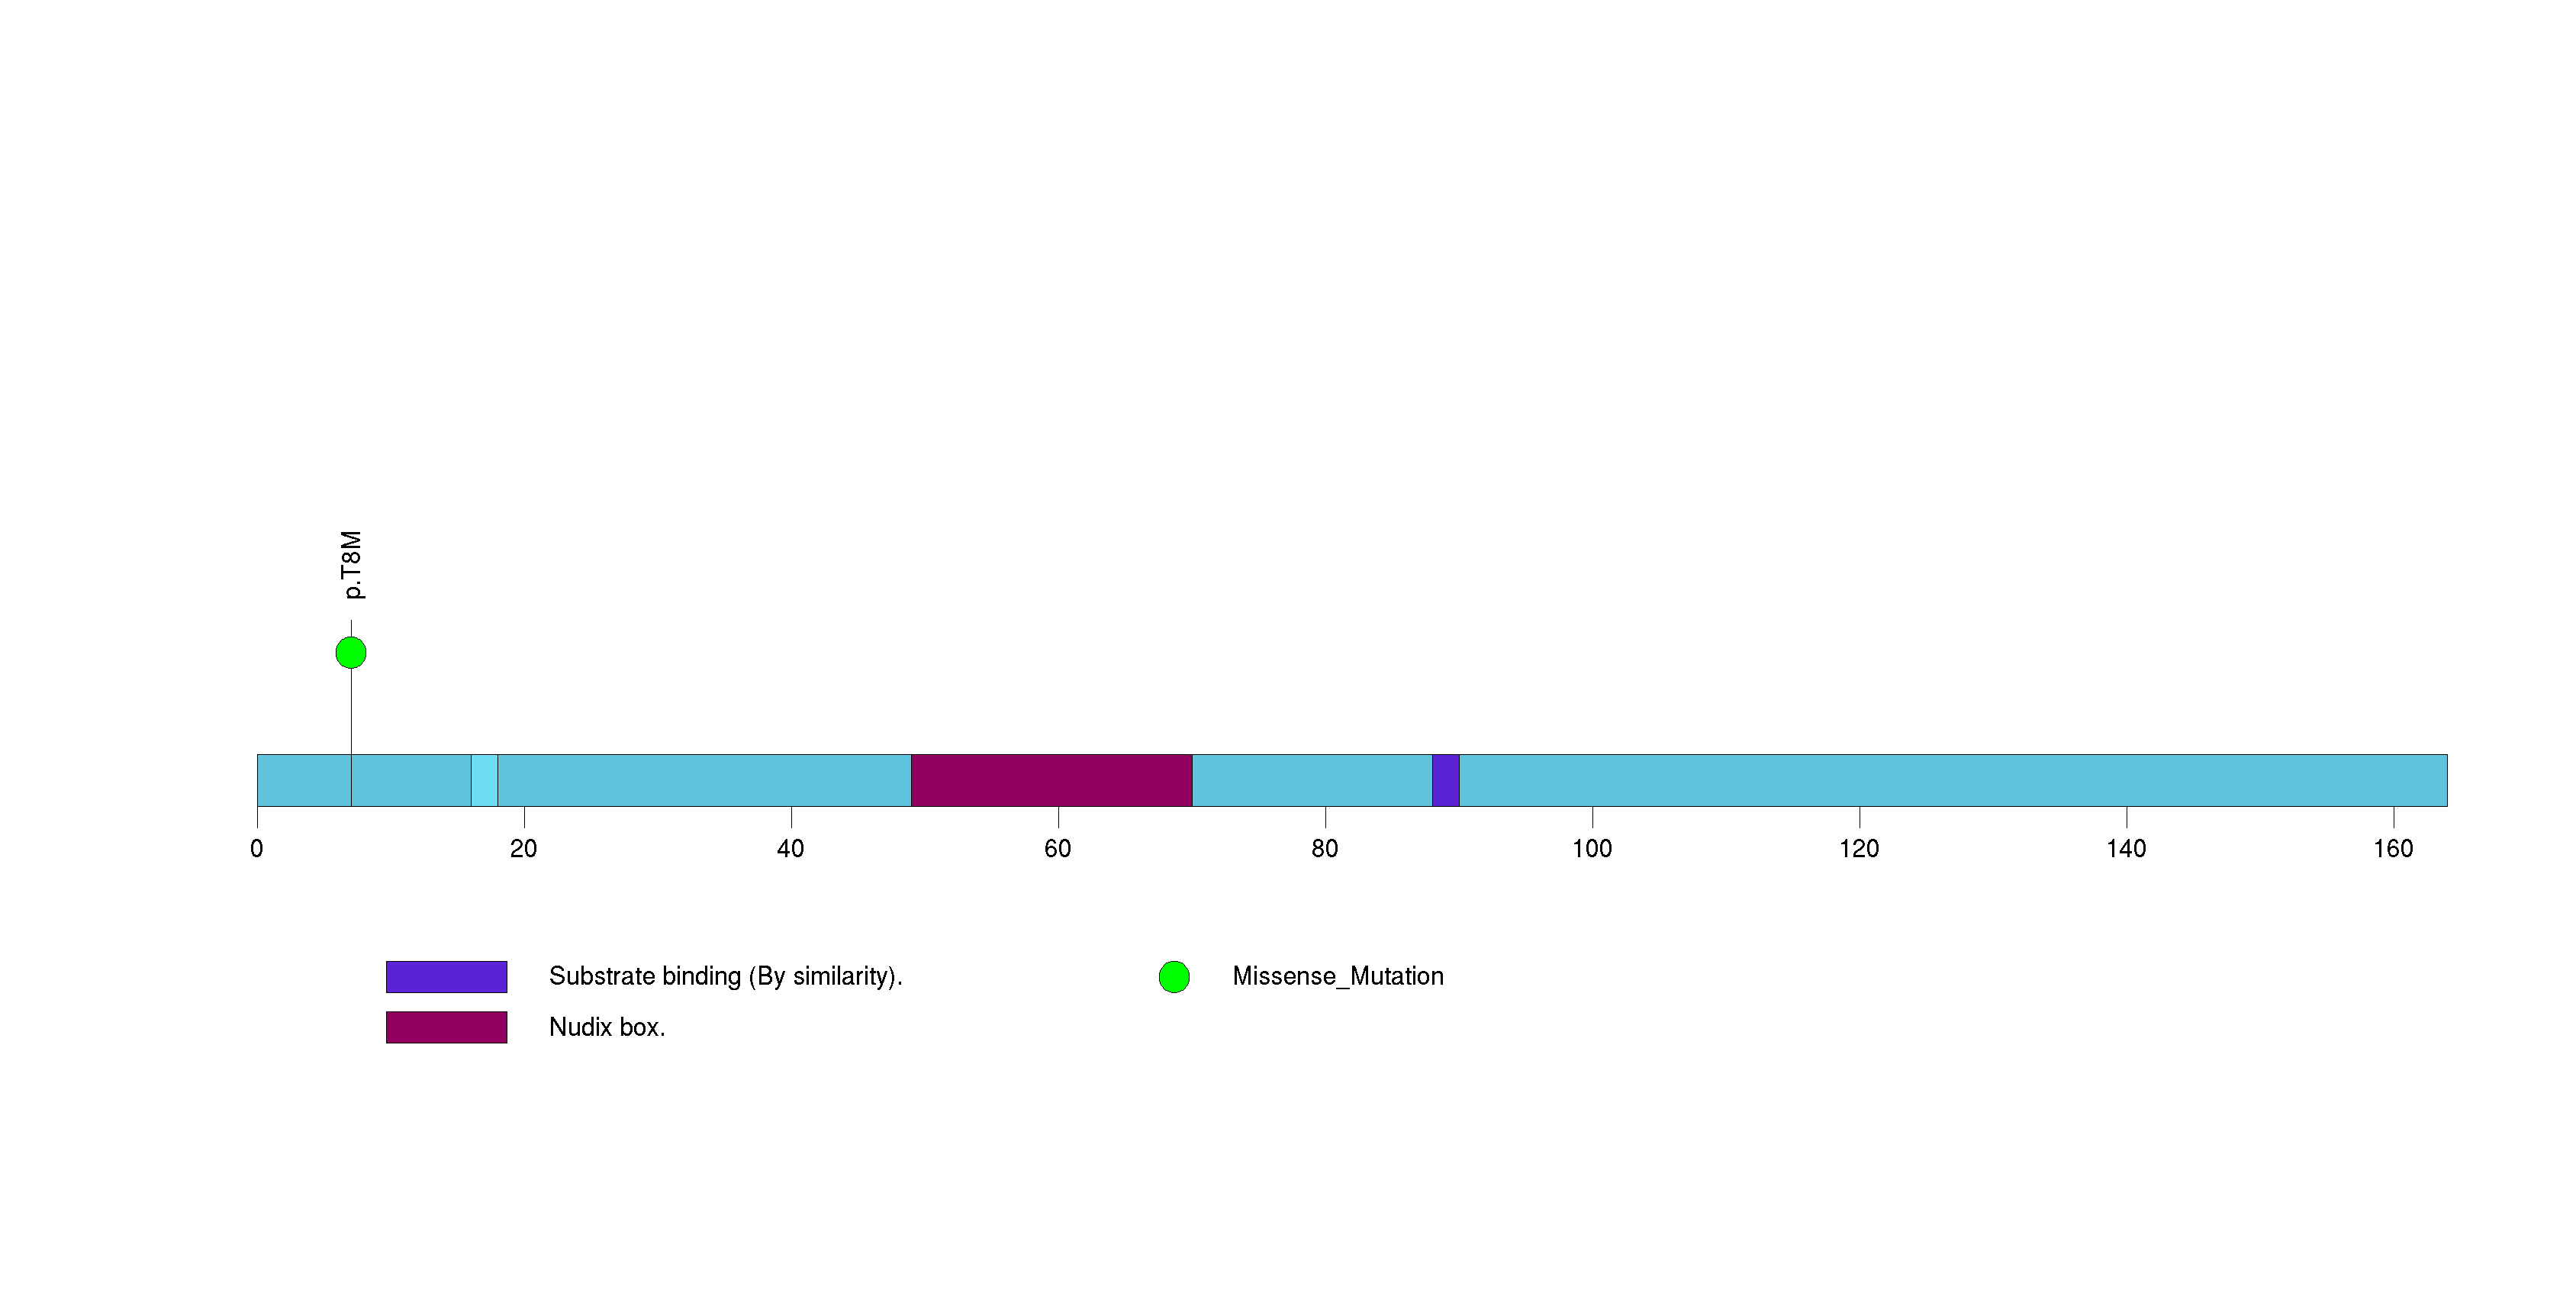
Figure S14. This figure depicts the distribution of mutations and mutation types across the FOXE1 significant gene.
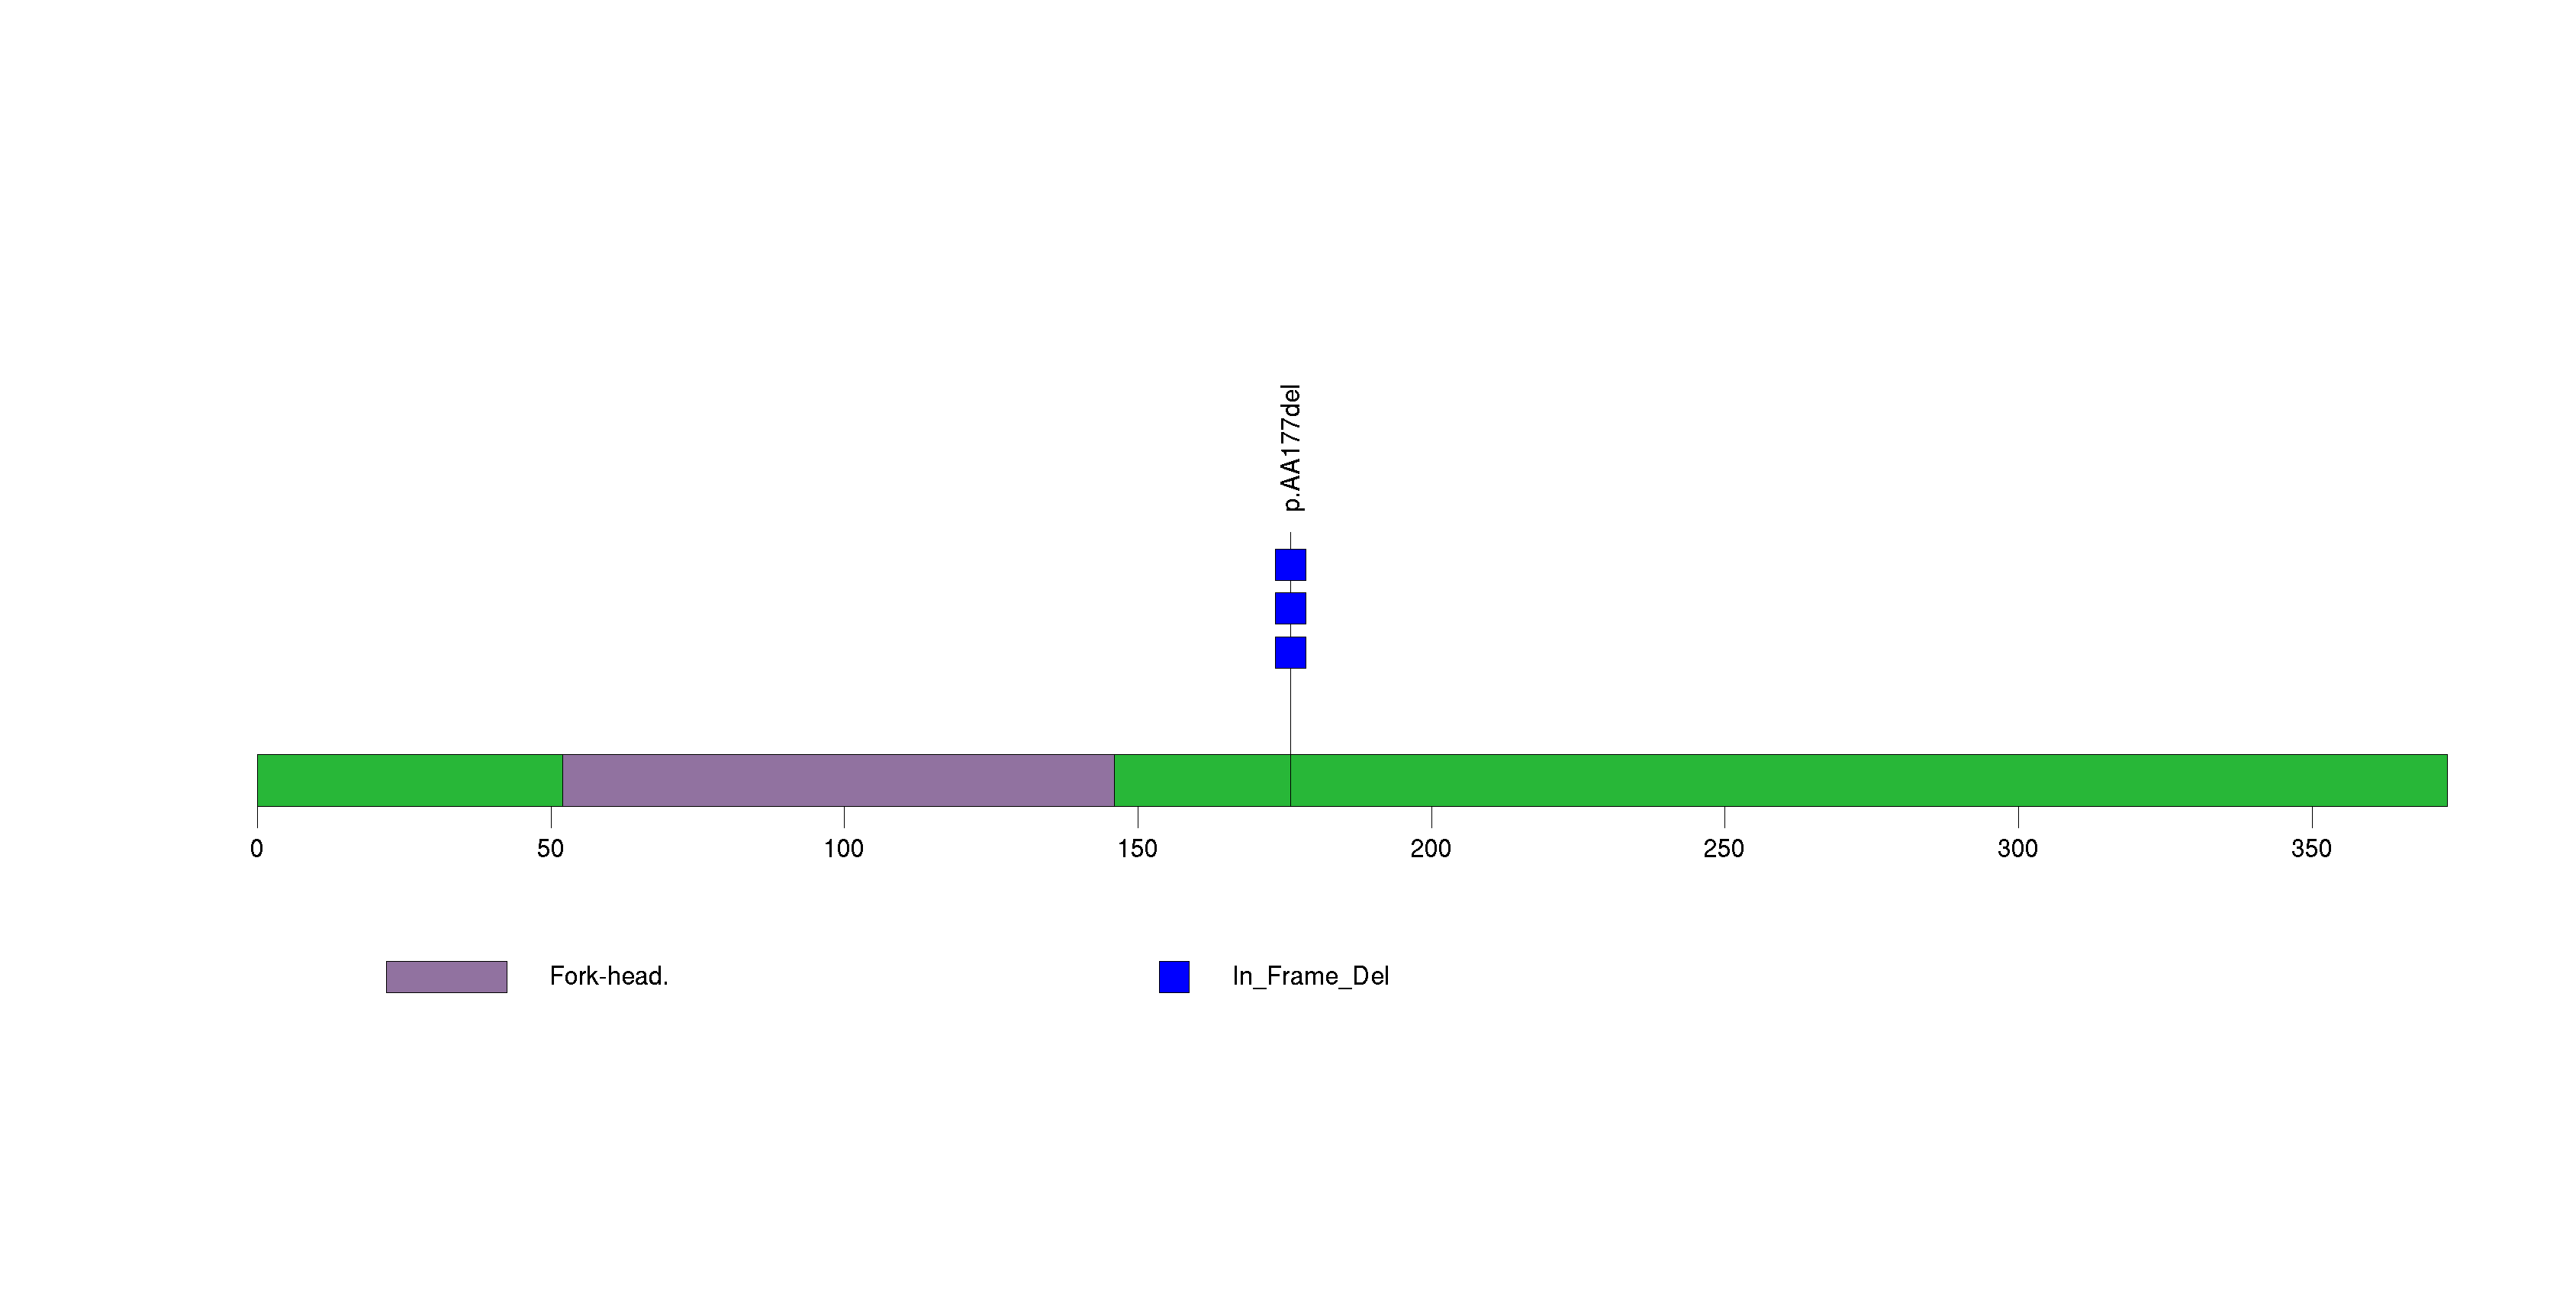
Figure S15. This figure depicts the distribution of mutations and mutation types across the OR2T35 significant gene.
Figure S16. This figure depicts the distribution of mutations and mutation types across the PCDHGC5 significant gene.
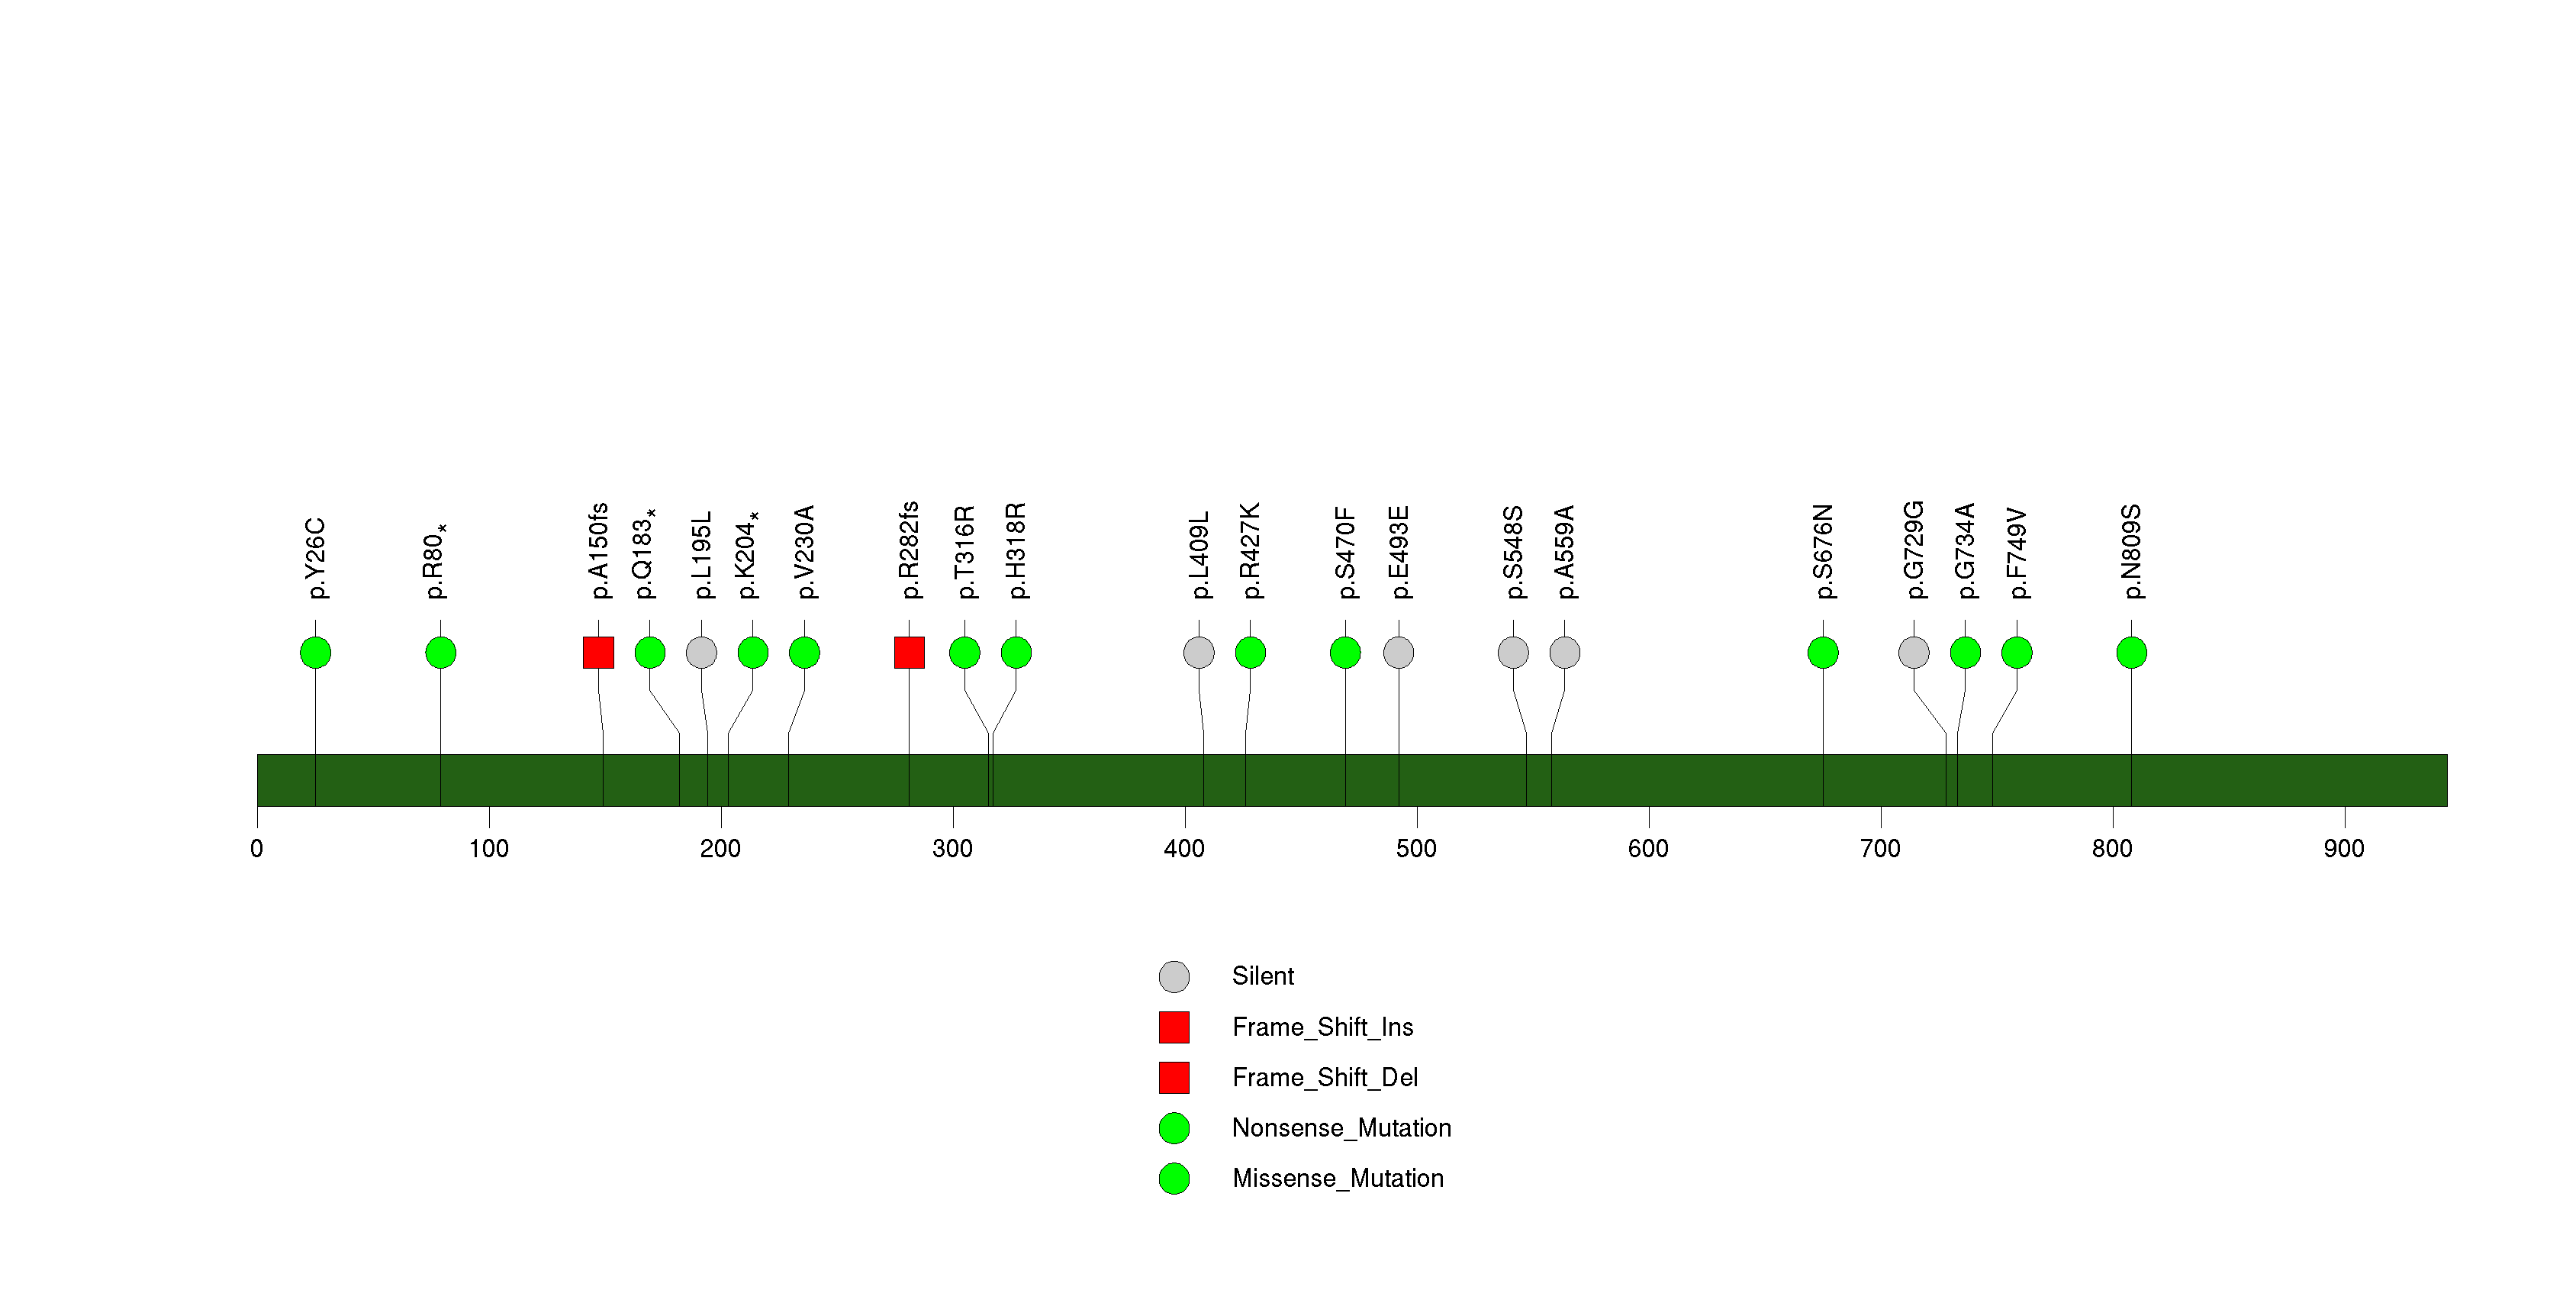
Figure S17. This figure depicts the distribution of mutations and mutation types across the COCH significant gene.

Figure S18. This figure depicts the distribution of mutations and mutation types across the CHCHD3 significant gene.

In this analysis, COSMIC is used as a filter to increase power by restricting the territory of each gene. Cosmic version: v48.
Table 4. Get Full Table Significantly mutated genes (COSMIC territory only). To access the database please go to: COSMIC. Number of significant genes found: 11. Number of genes displayed: 10
| rank | gene | description | n | cos | n_cos | N_cos | cos_ev | p | q |
|---|---|---|---|---|---|---|---|---|---|
| 1 | MET | met proto-oncogene (hepatocyte growth factor receptor) | 9 | 34 | 4 | 3808 | 12 | 9.8e-11 | 4.4e-07 |
| 2 | FGFR3 | fibroblast growth factor receptor 3 (achondroplasia, thanatophoric dwarfism) | 5 | 62 | 3 | 6944 | 1469 | 3.4e-07 | 0.00077 |
| 3 | NF2 | neurofibromin 2 (merlin) | 7 | 550 | 4 | 61600 | 29 | 6.2e-06 | 0.0093 |
| 4 | SMARCA4 | SWI/SNF related, matrix associated, actin dependent regulator of chromatin, subfamily a, member 4 | 5 | 30 | 2 | 3360 | 3 | 0.000019 | 0.021 |
| 5 | KRAS | v-Ki-ras2 Kirsten rat sarcoma viral oncogene homolog | 2 | 52 | 2 | 5824 | 29208 | 0.000057 | 0.051 |
| 6 | BRAF | v-raf murine sarcoma viral oncogene homolog B1 | 2 | 89 | 2 | 9968 | 14380 | 0.00016 | 0.084 |
| 7 | CDCA8 | cell division cycle associated 8 | 1 | 1 | 1 | 112 | 1 | 0.00021 | 0.084 |
| 8 | FLCN | folliculin | 1 | 1 | 1 | 112 | 1 | 0.00021 | 0.084 |
| 9 | G6PC | glucose-6-phosphatase, catalytic subunit | 1 | 1 | 1 | 112 | 1 | 0.00021 | 0.084 |
| 10 | PLXDC2 | plexin domain containing 2 | 1 | 1 | 1 | 112 | 1 | 0.00021 | 0.084 |
Note:
n - number of (nonsilent) mutations in this gene across the individual set.
cos = number of unique mutated sites in this gene in COSMIC
n_cos = overlap between n and cos.
N_cos = number of individuals times cos.
cos_ev = total evidence: number of reports in COSMIC for mutations seen in this gene.
p = p-value for seeing the observed amount of overlap in this gene)
q = q-value, False Discovery Rate (Benjamini-Hochberg procedure)
Table 5. Get Full Table Genes with Clustered Mutations
| num | gene | desc | n | mindist | nmuts0 | nmuts3 | nmuts12 | npairs0 | npairs3 | npairs12 |
|---|---|---|---|---|---|---|---|---|---|---|
| 2368 | MUC4 | mucin 4, cell surface associated | 12 | 0 | 6 | 6 | 15 | 6 | 6 | 15 |
| 54 | ACSBG2 | acyl-CoA synthetase bubblegum family member 2 | 3 | 0 | 3 | 3 | 3 | 3 | 3 | 3 |
| 4435 | ZNF814 | zinc finger protein 814 | 6 | 0 | 3 | 3 | 3 | 3 | 3 | 3 |
| 2259 | MET | met proto-oncogene (hepatocyte growth factor receptor) | 9 | 0 | 1 | 3 | 4 | 1 | 3 | 4 |
| 2745 | PCF11 | PCF11, cleavage and polyadenylation factor subunit, homolog (S. cerevisiae) | 8 | 0 | 1 | 2 | 10 | 1 | 2 | 10 |
| 1219 | EP400 | E1A binding protein p400 | 6 | 0 | 1 | 2 | 2 | 1 | 2 | 2 |
| 1239 | EPSTI1 | epithelial stromal interaction 1 (breast) | 3 | 0 | 1 | 1 | 3 | 1 | 1 | 3 |
| 2032 | KRTAP4-9 | keratin associated protein 4-9 | 3 | 0 | 1 | 1 | 3 | 1 | 1 | 3 |
| 92 | ADAMTS7 | ADAM metallopeptidase with thrombospondin type 1 motif, 7 | 3 | 0 | 1 | 1 | 1 | 1 | 1 | 1 |
| 199 | ANAPC5 | anaphase promoting complex subunit 5 | 3 | 0 | 1 | 1 | 1 | 1 | 1 | 1 |
Note:
n - number of mutations in this gene in the individual set.
mindist - distance (in aa) between closest pair of mutations in this gene
npairs3 - how many pairs of mutations are within 3 aa of each other.
npairs12 - how many pairs of mutations are within 12 aa of each other.
Table 6. Get Full Table A Ranked List of Significantly Mutated Genesets. (Source: MSigDB GSEA Cannonical Pathway Set).Number of significant genesets found: 0. Number of genesets displayed: 10
| rank | geneset | description | genes | N_genes | mut_tally | N | n | npat | nsite | nsil | n1 | n2 | n3 | n4 | n5 | n6 | p_ns_s | p | q |
|---|---|---|---|---|---|---|---|---|---|---|---|---|---|---|---|---|---|---|---|
| 1 | MTORPATHWAY | Mammalian target of rapamycin (mTOR) senses mitogenic factors and nutrients, including ATP, and induces cell proliferation. | AKT1, EIF3S10, EIF4A1, EIF4A2, EIF4B, EIF4E, EIF4EBP1, EIF4G1, EIF4G2, EIF4G3, FKBP1A, FRAP1, MKNK1, PDK2, PDPK1, PIK3CA, PIK3R1, PPP2CA, PTEN, RPS6, RPS6KB1, TSC1, TSC2 | 21 | EIF4A1(1), EIF4B(2), EIF4G1(2), EIF4G3(5), PIK3CA(2), PIK3R1(1), PTEN(2), TSC1(2), TSC2(4) | 4653778 | 21 | 18 | 21 | 2 | 2 | 6 | 3 | 4 | 6 | 0 | 0.056 | 0.001 | 0.61 |
| 2 | KREBPATHWAY | The Krebs (citric acid) cycle takes place in mitochondria, where it extracts energy in the form of electron carriers NADH and FADH2, which drive the electron transport chain. | ACO2, CS, FH, IDH2, MDH1, OGDH, SDHA, SUCLA2 | 8 | FH(1), IDH2(1), MDH1(1), OGDH(2), SDHA(3) | 1572837 | 8 | 8 | 8 | 0 | 0 | 3 | 1 | 1 | 3 | 0 | 0.052 | 0.0025 | 0.62 |
| 3 | ALANINE_AND_ASPARTATE_METABOLISM | AARS, ABAT, ADSL, ADSS, AGXT, AGXT2, ASL, ASNS, ASPA, ASS, CAD, CRAT, DARS, DDO, GAD1, GAD2, GOT1, GOT2, GPT, GPT2, NARS, PC | 21 | AARS(1), ADSL(1), AGXT(1), AGXT2(1), ASNS(1), CAD(3), CRAT(1), DARS(3), DDO(1), GPT(2), PC(4) | 4376807 | 19 | 17 | 19 | 1 | 0 | 3 | 1 | 8 | 7 | 0 | 0.078 | 0.003 | 0.62 | |
| 4 | CBLPATHWAY | Activated EGF receptors undergo endocytosis into clathrin-coated vesicles, where they are recycled to the membrane or ubiquitinated by Cbl. | CBL, CSF1R, EGF, EGFR, GRB2, MET, PDGFRA, PRKCA, PRKCB1, SH3GLB1, SH3GLB2, SH3KBP1, SRC | 12 | CSF1R(1), EGF(1), MET(9), PDGFRA(2) | 3254544 | 13 | 12 | 12 | 1 | 1 | 3 | 2 | 6 | 1 | 0 | 0.11 | 0.0063 | 0.96 |
| 5 | CITRATE_CYCLE_TCA_CYCLE | ACO1, ACO2, CS, DLD, DLST, DLSTP, FH, IDH1, IDH2, IDH3A, IDH3B, IDH3G, MDH1, MDH2, PC, PCK1, SDHA, SDHA, SDHAL2, SDHB, SUCLA2, SUCLG1, SUCLG2 | 20 | ACO1(1), DLD(1), FH(1), IDH2(1), MDH1(1), PC(4), PCK1(1), SDHA(3) | 3444763 | 13 | 12 | 13 | 0 | 0 | 2 | 2 | 3 | 6 | 0 | 0.035 | 0.013 | 1 | |
| 6 | DNAFRAGMENTPATHWAY | DNA fragmentation during apoptosis is effected by DFF, a caspase-activated DNAse, and by endonuclease G. | CASP3, CASP7, DFFA, DFFB, ENDOG, GZMB, HMGB1, HMGB2, TOP2A, TOP2B | 9 | HMGB1(3), HMGB2(2), TOP2B(3) | 1518294 | 8 | 7 | 8 | 0 | 1 | 1 | 1 | 3 | 2 | 0 | 0.21 | 0.016 | 1 |
| 7 | HSA00830_RETINOL_METABOLISM | Genes involved in retinol metabolism | ALDH1A1, ALDH1A2, BCMO1, RDH5 | 4 | BCMO1(2), RDH5(2) | 649405 | 4 | 4 | 4 | 1 | 0 | 0 | 3 | 0 | 1 | 0 | 0.72 | 0.018 | 1 |
| 8 | HSA00252_ALANINE_AND_ASPARTATE_METABOLISM | Genes involved in alanine and aspartate metabolism | AARS, AARS2, ABAT, ACY3, ADSL, ADSS, ADSSL1, AGXT, AGXT2, ASL, ASNS, ASPA, ASRGL1, ASS1, CAD, CRAT, DARS, DARS2, DDO, DLAT, DLD, GAD1, GAD2, GOT1, GOT2, GPT, GPT2, NARS, NARS2, PC, PDHA1, PDHA2, PDHB | 33 | AARS(1), AARS2(1), ACY3(1), ADSL(1), AGXT(1), AGXT2(1), ASNS(1), CAD(3), CRAT(1), DARS(3), DDO(1), DLD(1), GPT(2), PC(4) | 6354267 | 22 | 19 | 22 | 1 | 0 | 3 | 2 | 9 | 8 | 0 | 0.039 | 0.019 | 1 |
| 9 | RABPATHWAY | Rab family GTPases regulate vesicle transport, endocytosis and exocytosis, and vesicle docking via interactions with the rabphilins. | ACTA1, MEL, RAB11A, RAB1A, RAB2, RAB27A, RAB3A, RAB4A, RAB5A, RAB6A, RAB7, RAB9A | 9 | ACTA1(1), RAB11A(1), RAB3A(1), RAB6A(1) | 711732 | 4 | 4 | 4 | 1 | 0 | 1 | 0 | 2 | 1 | 0 | 0.81 | 0.022 | 1 |
| 10 | HSA01040_POLYUNSATURATED_FATTY_ACID_BIOSYNTHESIS | Genes involved in polyunsaturated fatty acid biosynthesis | ACAA1, ACOX1, ACOX3, ELOVL2, ELOVL5, ELOVL6, FADS1, FADS2, FASN, GPSN2, HADHA, HSD17B12, PECR, SCD | 13 | ACAA1(3), ACOX1(1), ACOX3(2), ELOVL6(1), FADS1(1), FASN(3), HADHA(1) | 2460627 | 12 | 9 | 12 | 1 | 1 | 4 | 0 | 6 | 1 | 0 | 0.096 | 0.022 | 1 |
Table 7. Get Full Table A Ranked List of Significantly Mutated Genesets (Excluding Significantly Mutated Genes). Number of significant genesets found: 0. Number of genesets displayed: 10
| rank | geneset | description | genes | N_genes | mut_tally | N | n | npat | nsite | nsil | n1 | n2 | n3 | n4 | n5 | n6 | p_ns_s | p | q |
|---|---|---|---|---|---|---|---|---|---|---|---|---|---|---|---|---|---|---|---|
| 1 | MTORPATHWAY | Mammalian target of rapamycin (mTOR) senses mitogenic factors and nutrients, including ATP, and induces cell proliferation. | AKT1, EIF3S10, EIF4A1, EIF4A2, EIF4B, EIF4E, EIF4EBP1, EIF4G1, EIF4G2, EIF4G3, FKBP1A, FRAP1, MKNK1, PDK2, PDPK1, PIK3CA, PIK3R1, PPP2CA, PTEN, RPS6, RPS6KB1, TSC1, TSC2 | 21 | EIF4A1(1), EIF4B(2), EIF4G1(2), EIF4G3(5), PIK3CA(2), PIK3R1(1), PTEN(2), TSC1(2), TSC2(4) | 4653778 | 21 | 18 | 21 | 2 | 2 | 6 | 3 | 4 | 6 | 0 | 0.056 | 0.001 | 0.61 |
| 2 | KREBPATHWAY | The Krebs (citric acid) cycle takes place in mitochondria, where it extracts energy in the form of electron carriers NADH and FADH2, which drive the electron transport chain. | ACO2, CS, FH, IDH2, MDH1, OGDH, SDHA, SUCLA2 | 8 | FH(1), IDH2(1), MDH1(1), OGDH(2), SDHA(3) | 1572837 | 8 | 8 | 8 | 0 | 0 | 3 | 1 | 1 | 3 | 0 | 0.052 | 0.0025 | 0.62 |
| 3 | ALANINE_AND_ASPARTATE_METABOLISM | AARS, ABAT, ADSL, ADSS, AGXT, AGXT2, ASL, ASNS, ASPA, ASS, CAD, CRAT, DARS, DDO, GAD1, GAD2, GOT1, GOT2, GPT, GPT2, NARS, PC | 21 | AARS(1), ADSL(1), AGXT(1), AGXT2(1), ASNS(1), CAD(3), CRAT(1), DARS(3), DDO(1), GPT(2), PC(4) | 4376807 | 19 | 17 | 19 | 1 | 0 | 3 | 1 | 8 | 7 | 0 | 0.078 | 0.003 | 0.62 | |
| 4 | CITRATE_CYCLE_TCA_CYCLE | ACO1, ACO2, CS, DLD, DLST, DLSTP, FH, IDH1, IDH2, IDH3A, IDH3B, IDH3G, MDH1, MDH2, PC, PCK1, SDHA, SDHA, SDHAL2, SDHB, SUCLA2, SUCLG1, SUCLG2 | 20 | ACO1(1), DLD(1), FH(1), IDH2(1), MDH1(1), PC(4), PCK1(1), SDHA(3) | 3444763 | 13 | 12 | 13 | 0 | 0 | 2 | 2 | 3 | 6 | 0 | 0.035 | 0.013 | 1 | |
| 5 | DNAFRAGMENTPATHWAY | DNA fragmentation during apoptosis is effected by DFF, a caspase-activated DNAse, and by endonuclease G. | CASP3, CASP7, DFFA, DFFB, ENDOG, GZMB, HMGB1, HMGB2, TOP2A, TOP2B | 9 | HMGB1(3), HMGB2(2), TOP2B(3) | 1518294 | 8 | 7 | 8 | 0 | 1 | 1 | 1 | 3 | 2 | 0 | 0.21 | 0.016 | 1 |
| 6 | HSA00830_RETINOL_METABOLISM | Genes involved in retinol metabolism | ALDH1A1, ALDH1A2, BCMO1, RDH5 | 4 | BCMO1(2), RDH5(2) | 649405 | 4 | 4 | 4 | 1 | 0 | 0 | 3 | 0 | 1 | 0 | 0.72 | 0.018 | 1 |
| 7 | HSA00252_ALANINE_AND_ASPARTATE_METABOLISM | Genes involved in alanine and aspartate metabolism | AARS, AARS2, ABAT, ACY3, ADSL, ADSS, ADSSL1, AGXT, AGXT2, ASL, ASNS, ASPA, ASRGL1, ASS1, CAD, CRAT, DARS, DARS2, DDO, DLAT, DLD, GAD1, GAD2, GOT1, GOT2, GPT, GPT2, NARS, NARS2, PC, PDHA1, PDHA2, PDHB | 33 | AARS(1), AARS2(1), ACY3(1), ADSL(1), AGXT(1), AGXT2(1), ASNS(1), CAD(3), CRAT(1), DARS(3), DDO(1), DLD(1), GPT(2), PC(4) | 6354267 | 22 | 19 | 22 | 1 | 0 | 3 | 2 | 9 | 8 | 0 | 0.039 | 0.019 | 1 |
| 8 | RABPATHWAY | Rab family GTPases regulate vesicle transport, endocytosis and exocytosis, and vesicle docking via interactions with the rabphilins. | ACTA1, MEL, RAB11A, RAB1A, RAB2, RAB27A, RAB3A, RAB4A, RAB5A, RAB6A, RAB7, RAB9A | 9 | ACTA1(1), RAB11A(1), RAB3A(1), RAB6A(1) | 711732 | 4 | 4 | 4 | 1 | 0 | 1 | 0 | 2 | 1 | 0 | 0.81 | 0.022 | 1 |
| 9 | HSA01040_POLYUNSATURATED_FATTY_ACID_BIOSYNTHESIS | Genes involved in polyunsaturated fatty acid biosynthesis | ACAA1, ACOX1, ACOX3, ELOVL2, ELOVL5, ELOVL6, FADS1, FADS2, FASN, GPSN2, HADHA, HSD17B12, PECR, SCD | 13 | ACAA1(3), ACOX1(1), ACOX3(2), ELOVL6(1), FADS1(1), FASN(3), HADHA(1) | 2460627 | 12 | 9 | 12 | 1 | 1 | 4 | 0 | 6 | 1 | 0 | 0.096 | 0.022 | 1 |
| 10 | UBIQUINONE_BIOSYNTHESIS | NDUFA1, NDUFA10, NDUFA11, NDUFA4, NDUFA5, NDUFA8, NDUFB2, NDUFB4, NDUFB5, NDUFB6, NDUFB7, NDUFS1, NDUFS2, NDUFV1, NDUFV2 | 15 | NDUFA10(1), NDUFB2(1), NDUFB5(1), NDUFS1(2), NDUFV1(1) | 1169848 | 6 | 6 | 6 | 0 | 0 | 1 | 0 | 3 | 2 | 0 | 0.32 | 0.023 | 1 |
In brief, we tabulate the number of mutations and the number of covered bases for each gene. The counts are broken down by mutation context category: four context categories that are discovered by MutSig, and one for indel and 'null' mutations, which include indels, nonsense mutations, splice-site mutations, and non-stop (read-through) mutations. For each gene, we calculate the probability of seeing the observed constellation of mutations, i.e. the product P1 x P2 x ... x Pm, or a more extreme one, given the background mutation rates calculated across the dataset. [1]
In addition to the links below, the full results of the analysis summarized in this report can also be downloaded programmatically using firehose_get, or interactively from either the Broad GDAC website or TCGA Data Coordination Center Portal.