This pipeline computes the correlation between significant copy number variation (cnv focal) genes and selected clinical features.
Testing the association between copy number variation 20 focal events and 3 clinical features across 191 patients, 7 significant findings detected with Q value < 0.25.
-
AMP PEAK 6(21Q22.2) MUTATION ANALYSIS cnv correlated to 'Time to Death'.
-
DEL PEAK 2(3P13) MUTATION ANALYSIS cnv correlated to 'Time to Death'.
-
DEL PEAK 3(3Q26.31) MUTATION ANALYSIS cnv correlated to 'AGE'.
-
DEL PEAK 4(5Q31.2) MUTATION ANALYSIS cnv correlated to 'Time to Death'.
-
DEL PEAK 10(12P13.2) MUTATION ANALYSIS cnv correlated to 'Time to Death'.
-
DEL PEAK 11(12Q21.33) MUTATION ANALYSIS cnv correlated to 'AGE'.
-
DEL PEAK 15(18P11.21) MUTATION ANALYSIS cnv correlated to 'Time to Death'.
Table 1. Get Full Table Overview of the association between significant copy number variation of 20 focal events and 3 clinical features. Shown in the table are P values (Q values). Thresholded by Q value < 0.25, 7 significant findings detected.
|
Clinical Features |
Time to Death |
AGE | GENDER | ||
| nCNV (%) | nWild-Type | logrank test | t-test | Fisher's exact test | |
| AMP PEAK 6(21Q22 2) MUTATION ANALYSIS | 14 (7%) | 177 |
0.000578 (0.0324) |
0.0657 (1.00) |
0.0922 (1.00) |
| DEL PEAK 2(3P13) MUTATION ANALYSIS | 9 (5%) | 182 |
3.23e-05 (0.00184) |
0.16 (1.00) |
0.185 (1.00) |
| DEL PEAK 3(3Q26 31) MUTATION ANALYSIS | 3 (2%) | 188 |
0.00241 (0.13) |
0.252 (1.00) |
|
| DEL PEAK 4(5Q31 2) MUTATION ANALYSIS | 18 (9%) | 173 |
0.00293 (0.155) |
0.00583 (0.297) |
0.0464 (1.00) |
| DEL PEAK 10(12P13 2) MUTATION ANALYSIS | 10 (5%) | 181 |
0.000939 (0.0516) |
0.581 (1.00) |
0.351 (1.00) |
| DEL PEAK 11(12Q21 33) MUTATION ANALYSIS | 3 (2%) | 188 |
8.84e-17 (5.13e-15) |
0.252 (1.00) |
|
| DEL PEAK 15(18P11 21) MUTATION ANALYSIS | 9 (5%) | 182 |
0.00476 (0.248) |
0.175 (1.00) |
0.185 (1.00) |
| AMP PEAK 1(1P33) MUTATION ANALYSIS | 7 (4%) | 184 |
0.328 (1.00) |
0.0372 (1.00) |
1 (1.00) |
| AMP PEAK 2(1Q43) MUTATION ANALYSIS | 7 (4%) | 184 |
0.724 (1.00) |
0.0234 (1.00) |
1 (1.00) |
| AMP PEAK 3(11Q23 3) MUTATION ANALYSIS | 17 (9%) | 174 |
0.106 (1.00) |
0.0106 (0.53) |
0.45 (1.00) |
| AMP PEAK 4(13Q31 3) MUTATION ANALYSIS | 7 (4%) | 184 |
0.953 (1.00) |
0.0714 (1.00) |
1 (1.00) |
| AMP PEAK 5(20Q11 21) MUTATION ANALYSIS | 3 (2%) | 188 |
0.108 (1.00) |
0.372 (1.00) |
0.252 (1.00) |
| DEL PEAK 5(7P12 1) MUTATION ANALYSIS | 16 (8%) | 175 |
0.147 (1.00) |
0.21 (1.00) |
0.604 (1.00) |
| DEL PEAK 6(7Q32 3) MUTATION ANALYSIS | 23 (12%) | 168 |
0.0552 (1.00) |
0.0883 (1.00) |
0.656 (1.00) |
| DEL PEAK 7(7Q34) MUTATION ANALYSIS | 24 (13%) | 167 |
0.122 (1.00) |
0.0807 (1.00) |
0.512 (1.00) |
| DEL PEAK 9(9Q21 32) MUTATION ANALYSIS | 5 (3%) | 186 |
0.918 (1.00) |
0.744 (1.00) |
0.378 (1.00) |
| DEL PEAK 12(16Q23 1) MUTATION ANALYSIS | 9 (5%) | 182 |
0.12 (1.00) |
0.11 (1.00) |
0.513 (1.00) |
| DEL PEAK 13(17P13 2) MUTATION ANALYSIS | 15 (8%) | 176 |
0.038 (1.00) |
0.226 (1.00) |
0.0565 (1.00) |
| DEL PEAK 14(17Q11 2) MUTATION ANALYSIS | 13 (7%) | 178 |
0.0268 (1.00) |
0.547 (1.00) |
0.775 (1.00) |
| DEL PEAK 16(20Q13 13) MUTATION ANALYSIS | 4 (2%) | 187 |
0.0373 (1.00) |
0.113 (1.00) |
0.627 (1.00) |
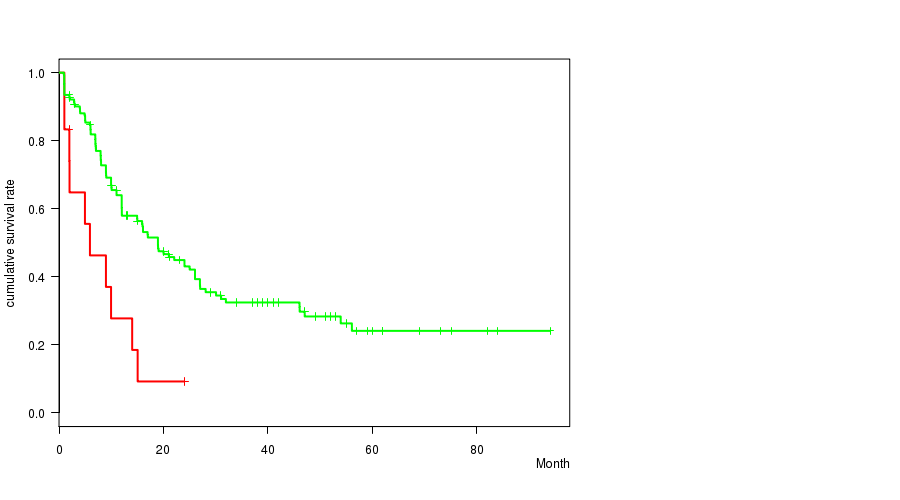
P value = 0.000578 (logrank test), Q value = 0.032
Table S1. Gene #6: 'AMP PEAK 6(21Q22.2) MUTATION STATUS' versus Clinical Feature #1: 'Time to Death'
| nPatients | nDeath | Duration Range (Median), Month | |
|---|---|---|---|
| ALL | 166 | 104 | 0.9 - 94.1 (12.0) |
| AMP PEAK 6(21Q22.2) MUTATED | 12 | 10 | 1.0 - 24.0 (5.4) |
| AMP PEAK 6(21Q22.2) WILD-TYPE | 154 | 94 | 0.9 - 94.1 (12.5) |
Figure S1. Get High-res Image Gene #6: 'AMP PEAK 6(21Q22.2) MUTATION STATUS' versus Clinical Feature #1: 'Time to Death'
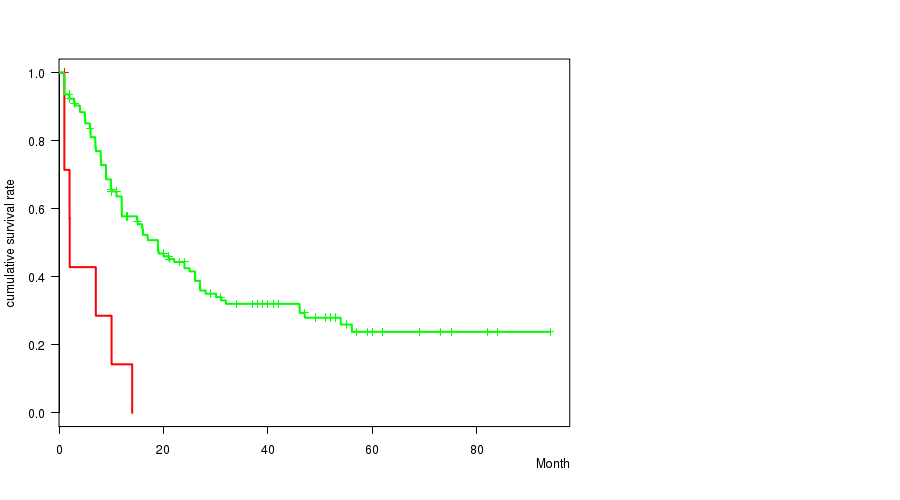
P value = 3.23e-05 (logrank test), Q value = 0.0018
Table S2. Gene #7: 'DEL PEAK 2(3P13) MUTATION STATUS' versus Clinical Feature #1: 'Time to Death'
| nPatients | nDeath | Duration Range (Median), Month | |
|---|---|---|---|
| ALL | 166 | 104 | 0.9 - 94.1 (12.0) |
| DEL PEAK 2(3P13) MUTATED | 8 | 7 | 1.0 - 14.0 (2.0) |
| DEL PEAK 2(3P13) WILD-TYPE | 158 | 97 | 0.9 - 94.1 (12.5) |
Figure S2. Get High-res Image Gene #7: 'DEL PEAK 2(3P13) MUTATION STATUS' versus Clinical Feature #1: 'Time to Death'
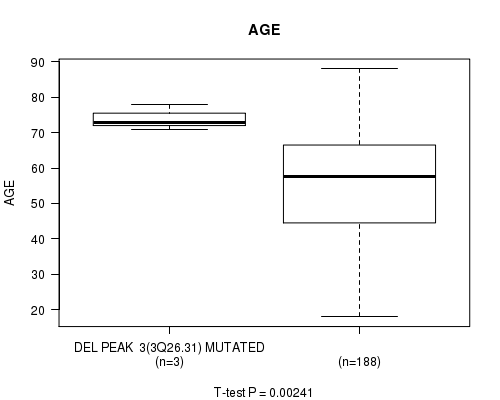
P value = 0.00241 (t-test), Q value = 0.13
Table S3. Gene #8: 'DEL PEAK 3(3Q26.31) MUTATION STATUS' versus Clinical Feature #2: 'AGE'
| nPatients | Mean (Std.Dev) | |
|---|---|---|
| ALL | 191 | 55.2 (16.1) |
| DEL PEAK 3(3Q26.31) MUTATED | 3 | 74.0 (3.6) |
| DEL PEAK 3(3Q26.31) WILD-TYPE | 188 | 54.9 (16.0) |
Figure S3. Get High-res Image Gene #8: 'DEL PEAK 3(3Q26.31) MUTATION STATUS' versus Clinical Feature #2: 'AGE'
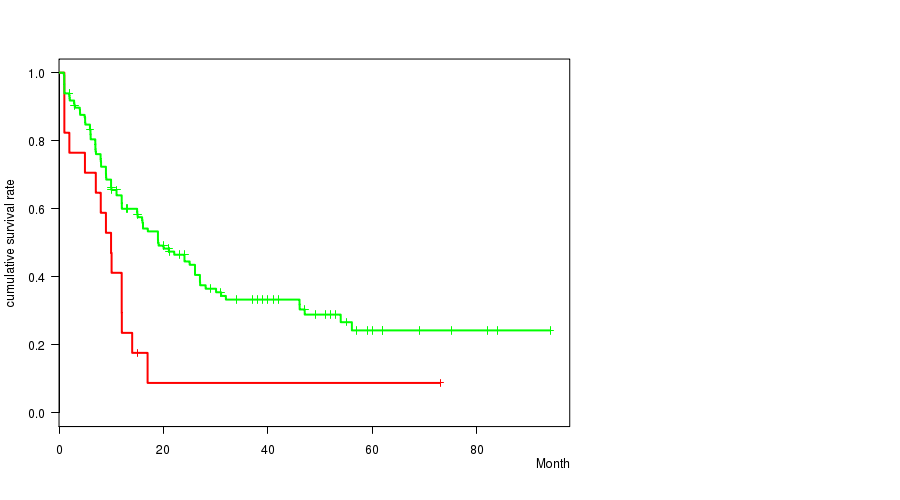
P value = 0.00293 (logrank test), Q value = 0.16
Table S4. Gene #9: 'DEL PEAK 4(5Q31.2) MUTATION STATUS' versus Clinical Feature #1: 'Time to Death'
| nPatients | nDeath | Duration Range (Median), Month | |
|---|---|---|---|
| ALL | 166 | 104 | 0.9 - 94.1 (12.0) |
| DEL PEAK 4(5Q31.2) MUTATED | 17 | 15 | 1.0 - 73.0 (10.0) |
| DEL PEAK 4(5Q31.2) WILD-TYPE | 149 | 89 | 0.9 - 94.1 (12.9) |
Figure S4. Get High-res Image Gene #9: 'DEL PEAK 4(5Q31.2) MUTATION STATUS' versus Clinical Feature #1: 'Time to Death'
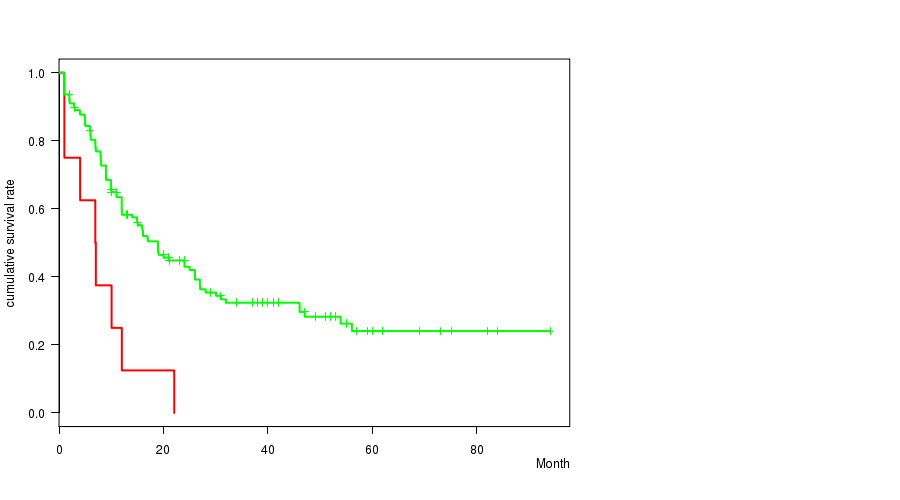
P value = 0.000939 (logrank test), Q value = 0.052
Table S5. Gene #14: 'DEL PEAK 10(12P13.2) MUTATION STATUS' versus Clinical Feature #1: 'Time to Death'
| nPatients | nDeath | Duration Range (Median), Month | |
|---|---|---|---|
| ALL | 166 | 104 | 0.9 - 94.1 (12.0) |
| DEL PEAK 10(12P13.2) MUTATED | 8 | 8 | 1.0 - 22.1 (7.0) |
| DEL PEAK 10(12P13.2) WILD-TYPE | 158 | 96 | 0.9 - 94.1 (12.5) |
Figure S5. Get High-res Image Gene #14: 'DEL PEAK 10(12P13.2) MUTATION STATUS' versus Clinical Feature #1: 'Time to Death'
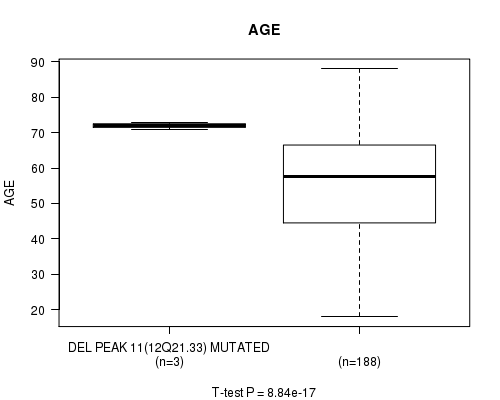
P value = 8.84e-17 (t-test), Q value = 5.1e-15
Table S6. Gene #15: 'DEL PEAK 11(12Q21.33) MUTATION STATUS' versus Clinical Feature #2: 'AGE'
| nPatients | Mean (Std.Dev) | |
|---|---|---|
| ALL | 191 | 55.2 (16.1) |
| DEL PEAK 11(12Q21.33) MUTATED | 3 | 72.0 (1.0) |
| DEL PEAK 11(12Q21.33) WILD-TYPE | 188 | 55.0 (16.0) |
Figure S6. Get High-res Image Gene #15: 'DEL PEAK 11(12Q21.33) MUTATION STATUS' versus Clinical Feature #2: 'AGE'
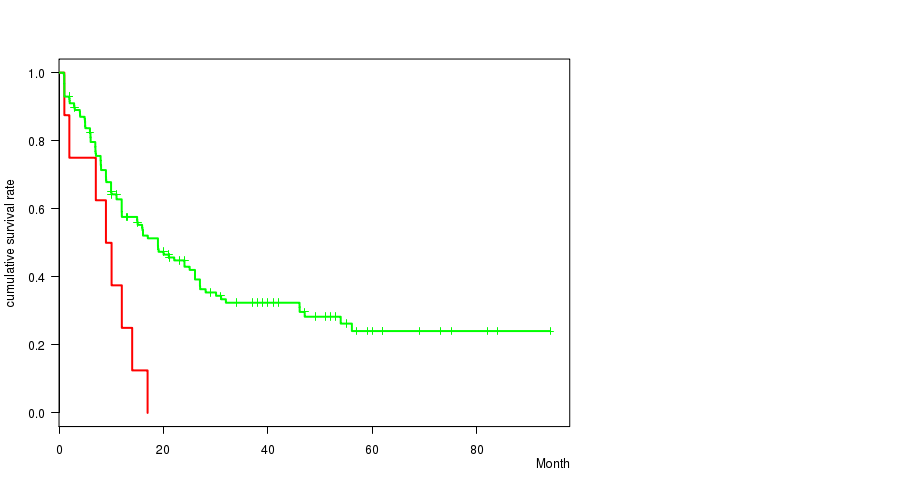
P value = 0.00476 (logrank test), Q value = 0.25
Table S7. Gene #19: 'DEL PEAK 15(18P11.21) MUTATION STATUS' versus Clinical Feature #1: 'Time to Death'
| nPatients | nDeath | Duration Range (Median), Month | |
|---|---|---|---|
| ALL | 166 | 104 | 0.9 - 94.1 (12.0) |
| DEL PEAK 15(18P11.21) MUTATED | 8 | 8 | 1.0 - 17.0 (9.5) |
| DEL PEAK 15(18P11.21) WILD-TYPE | 158 | 96 | 0.9 - 94.1 (12.0) |
Figure S7. Get High-res Image Gene #19: 'DEL PEAK 15(18P11.21) MUTATION STATUS' versus Clinical Feature #1: 'Time to Death'
-
Copy number data file = transformed.cor.cli.txt
-
Clinical data file = LAML-TB.clin.merged.picked.txt
-
Number of patients = 191
-
Number of significantly focal cnvs = 20
-
Number of selected clinical features = 3
-
Exclude genes that fewer than K tumors have mutations, K = 3
For survival clinical features, the Kaplan-Meier survival curves of tumors with and without gene mutations were plotted and the statistical significance P values were estimated by logrank test (Bland and Altman 2004) using the 'survdiff' function in R
For continuous numerical clinical features, two-tailed Student's t test with unequal variance (Lehmann and Romano 2005) was applied to compare the clinical values between tumors with and without gene mutations using 't.test' function in R
For binary or multi-class clinical features (nominal or ordinal), two-tailed Fisher's exact tests (Fisher 1922) were used to estimate the P values using the 'fisher.test' function in R
For multiple hypothesis correction, Q value is the False Discovery Rate (FDR) analogue of the P value (Benjamini and Hochberg 1995), defined as the minimum FDR at which the test may be called significant. We used the 'Benjamini and Hochberg' method of 'p.adjust' function in R to convert P values into Q values.
In addition to the links below, the full results of the analysis summarized in this report can also be downloaded programmatically using firehose_get, or interactively from either the Broad GDAC website or TCGA Data Coordination Center Portal.