This pipeline computes the correlation between significant copy number variation (cnv focal) genes and selected clinical features.
Testing the association between copy number variation 48 focal events and 6 clinical features across 229 patients, 14 significant findings detected with Q value < 0.25.
-
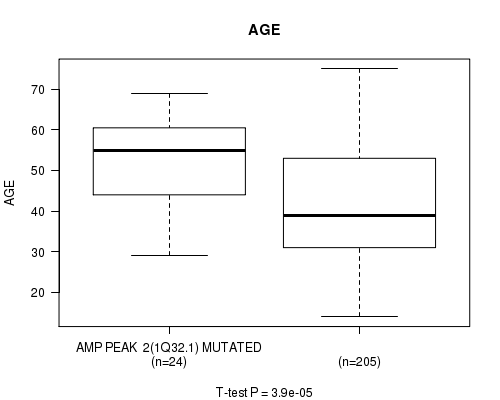
AMP PEAK 2(1Q32.1) MUTATION ANALYSIS cnv correlated to 'AGE'.
-
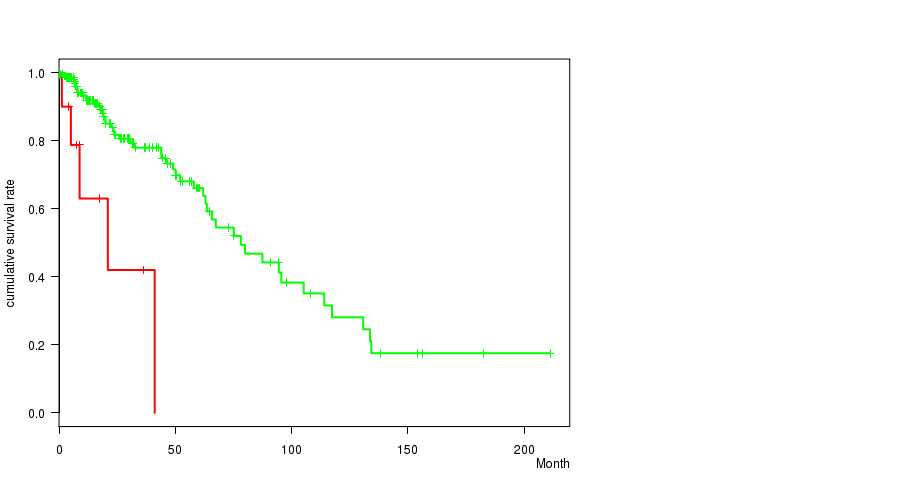
AMP PEAK 4(3Q26.32) MUTATION ANALYSIS cnv correlated to 'Time to Death'.
-
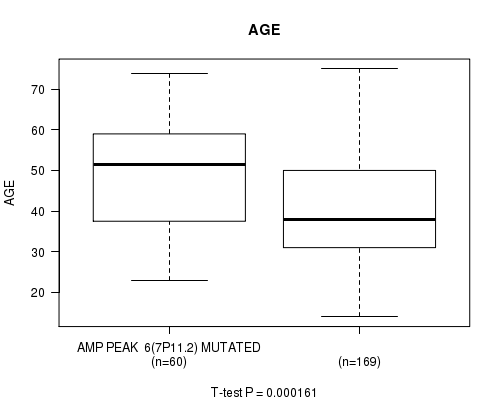
AMP PEAK 6(7P11.2) MUTATION ANALYSIS cnv correlated to 'AGE'.
-
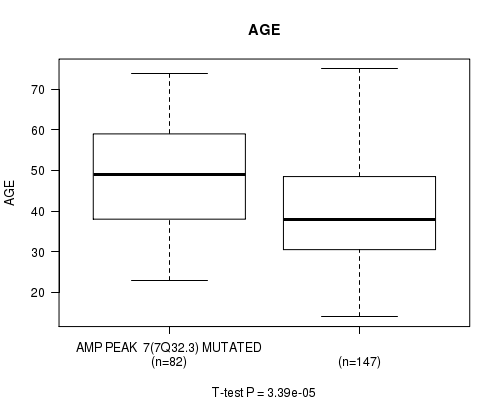
AMP PEAK 7(7Q32.3) MUTATION ANALYSIS cnv correlated to 'AGE'.
-
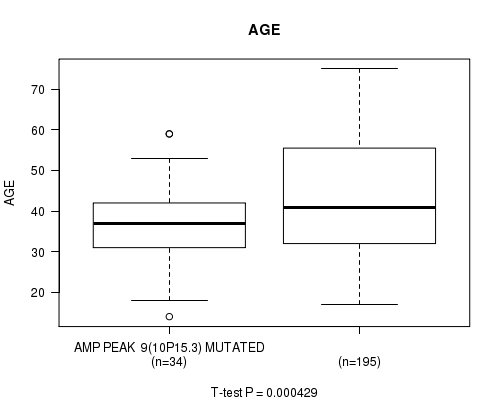
AMP PEAK 9(10P15.3) MUTATION ANALYSIS cnv correlated to 'AGE'.
-
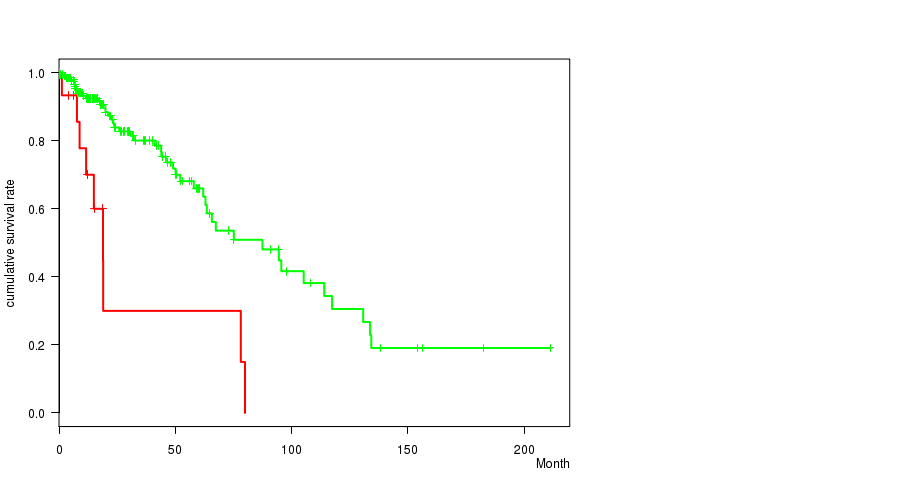
AMP PEAK 13(12Q14.1) MUTATION ANALYSIS cnv correlated to 'Time to Death'.
-
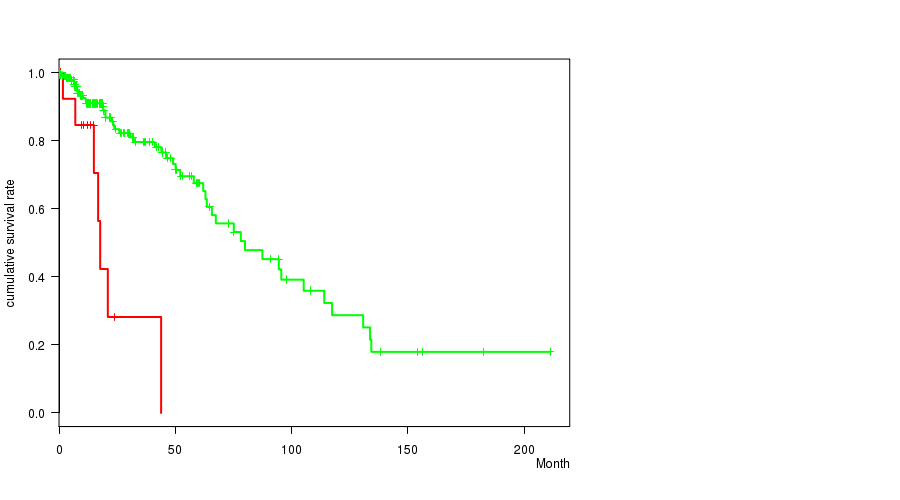
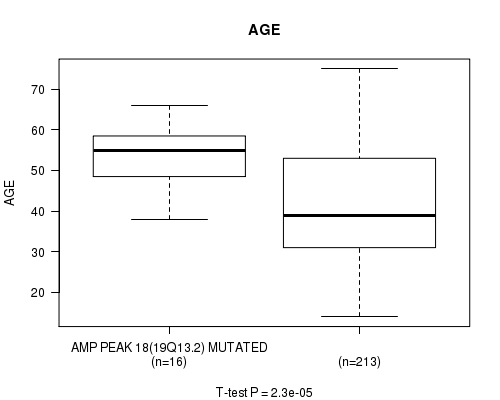
AMP PEAK 18(19Q13.2) MUTATION ANALYSIS cnv correlated to 'Time to Death' and 'AGE'.
-
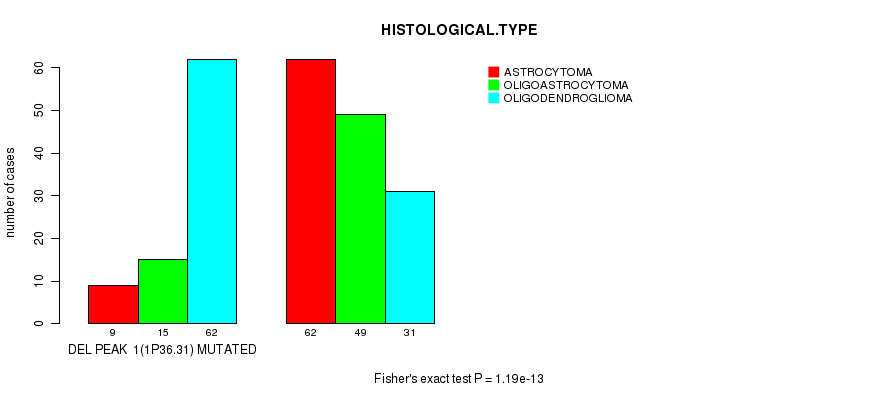
DEL PEAK 1(1P36.31) MUTATION ANALYSIS cnv correlated to 'HISTOLOGICAL.TYPE'.
-
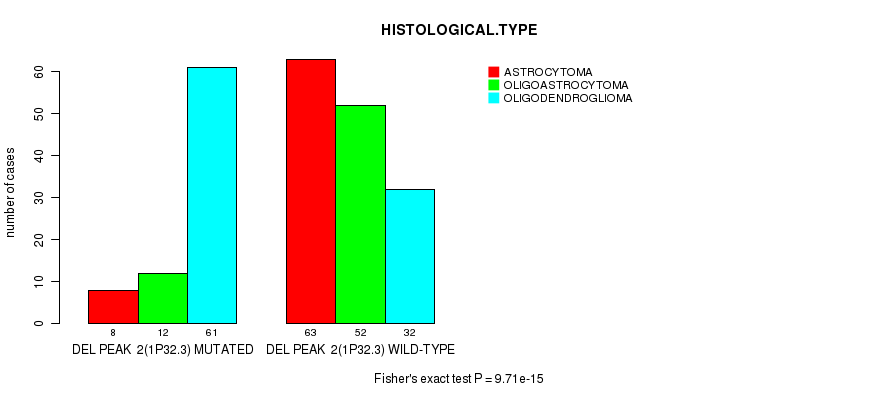
DEL PEAK 2(1P32.3) MUTATION ANALYSIS cnv correlated to 'HISTOLOGICAL.TYPE'.
-
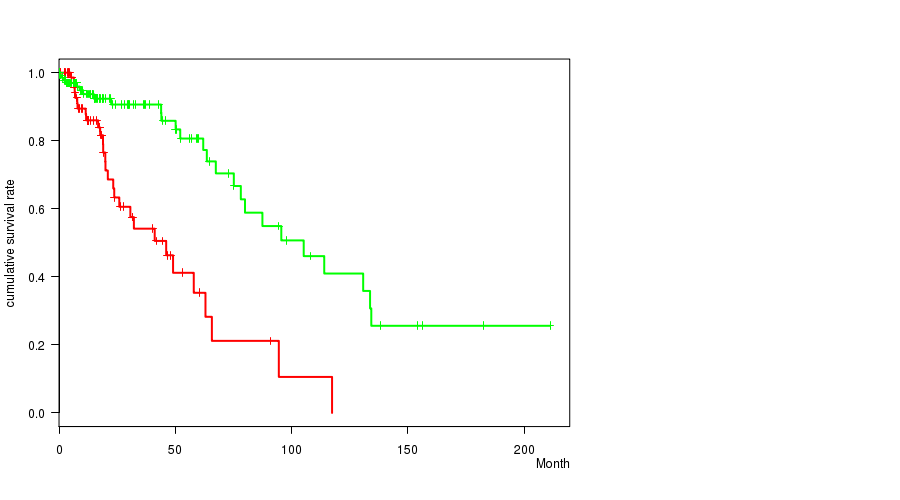
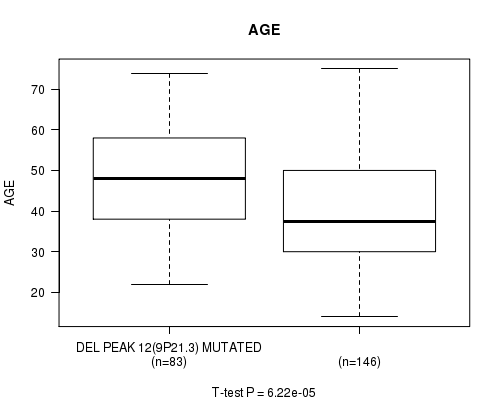
DEL PEAK 12(9P21.3) MUTATION ANALYSIS cnv correlated to 'Time to Death' and 'AGE'.
-
DEL PEAK 13(10Q26.3) MUTATION ANALYSIS cnv correlated to 'Time to Death'.
-
DEL PEAK 25(19Q13.42) MUTATION ANALYSIS cnv correlated to 'HISTOLOGICAL.TYPE'.
Table 1. Get Full Table Overview of the association between significant copy number variation of 48 focal events and 6 clinical features. Shown in the table are P values (Q values). Thresholded by Q value < 0.25, 14 significant findings detected.
|
Clinical Features |
Time to Death |
AGE | GENDER |
KARNOFSKY PERFORMANCE SCORE |
HISTOLOGICAL TYPE |
RADIATIONS RADIATION REGIMENINDICATION |
||
| nCNV (%) | nWild-Type | logrank test | t-test | Fisher's exact test | t-test | Fisher's exact test | Fisher's exact test | |
| AMP PEAK 18(19Q13 2) MUTATION ANALYSIS | 16 (7%) | 213 |
1e-05 (0.00285) |
2.3e-05 (0.0065) |
1 (1.00) |
0.543 (1.00) |
0.546 (1.00) |
0.429 (1.00) |
| DEL PEAK 12(9P21 3) MUTATION ANALYSIS | 83 (36%) | 146 |
5.18e-06 (0.00148) |
6.22e-05 (0.0173) |
0.784 (1.00) |
0.317 (1.00) |
0.0225 (1.00) |
0.0241 (1.00) |
| AMP PEAK 2(1Q32 1) MUTATION ANALYSIS | 24 (10%) | 205 |
0.0751 (1.00) |
3.9e-05 (0.011) |
0.387 (1.00) |
0.109 (1.00) |
0.119 (1.00) |
0.513 (1.00) |
| AMP PEAK 4(3Q26 32) MUTATION ANALYSIS | 11 (5%) | 218 |
0.000178 (0.0492) |
0.295 (1.00) |
0.758 (1.00) |
0.535 (1.00) |
0.0488 (1.00) |
0.116 (1.00) |
| AMP PEAK 6(7P11 2) MUTATION ANALYSIS | 60 (26%) | 169 |
0.00208 (0.566) |
0.000161 (0.0447) |
0.0698 (1.00) |
0.402 (1.00) |
0.0339 (1.00) |
0.759 (1.00) |
| AMP PEAK 7(7Q32 3) MUTATION ANALYSIS | 82 (36%) | 147 |
0.124 (1.00) |
3.39e-05 (0.00955) |
0.0519 (1.00) |
0.927 (1.00) |
0.196 (1.00) |
0.673 (1.00) |
| AMP PEAK 9(10P15 3) MUTATION ANALYSIS | 34 (15%) | 195 |
0.435 (1.00) |
0.000429 (0.118) |
0.266 (1.00) |
0.716 (1.00) |
0.0075 (1.00) |
0.186 (1.00) |
| AMP PEAK 13(12Q14 1) MUTATION ANALYSIS | 15 (7%) | 214 |
4.94e-05 (0.0138) |
0.101 (1.00) |
0.284 (1.00) |
0.356 (1.00) |
0.164 (1.00) |
1 (1.00) |
| DEL PEAK 1(1P36 31) MUTATION ANALYSIS | 86 (38%) | 143 |
0.776 (1.00) |
0.00122 (0.333) |
0.494 (1.00) |
0.499 (1.00) |
1.19e-13 (3.4e-11) |
0.125 (1.00) |
| DEL PEAK 2(1P32 3) MUTATION ANALYSIS | 81 (35%) | 148 |
0.106 (1.00) |
0.00212 (0.575) |
0.677 (1.00) |
0.576 (1.00) |
9.71e-15 (2.8e-12) |
0.0159 (1.00) |
| DEL PEAK 13(10Q26 3) MUTATION ANALYSIS | 70 (31%) | 159 |
4.06e-05 (0.0114) |
0.00433 (1.00) |
0.0606 (1.00) |
0.808 (1.00) |
0.00687 (1.00) |
0.884 (1.00) |
| DEL PEAK 25(19Q13 42) MUTATION ANALYSIS | 118 (52%) | 111 |
0.0362 (1.00) |
0.673 (1.00) |
0.509 (1.00) |
0.844 (1.00) |
2.5e-08 (7.15e-06) |
0.893 (1.00) |
| AMP PEAK 1(1Q22) MUTATION ANALYSIS | 22 (10%) | 207 |
0.127 (1.00) |
0.00637 (1.00) |
0.178 (1.00) |
0.877 (1.00) |
0.61 (1.00) |
0.647 (1.00) |
| AMP PEAK 3(3P24 3) MUTATION ANALYSIS | 12 (5%) | 217 |
0.124 (1.00) |
0.966 (1.00) |
0.555 (1.00) |
0.439 (1.00) |
0.361 (1.00) |
0.546 (1.00) |
| AMP PEAK 5(4Q12) MUTATION ANALYSIS | 10 (4%) | 219 |
0.439 (1.00) |
0.557 (1.00) |
0.755 (1.00) |
0.346 (1.00) |
0.0488 (1.00) |
1 (1.00) |
| AMP PEAK 8(8Q24 12) MUTATION ANALYSIS | 46 (20%) | 183 |
0.717 (1.00) |
0.419 (1.00) |
0.0964 (1.00) |
0.557 (1.00) |
0.0167 (1.00) |
0.613 (1.00) |
| AMP PEAK 10(11Q23 3) MUTATION ANALYSIS | 39 (17%) | 190 |
0.997 (1.00) |
0.275 (1.00) |
0.861 (1.00) |
0.717 (1.00) |
0.794 (1.00) |
1 (1.00) |
| AMP PEAK 11(12P13 32) MUTATION ANALYSIS | 36 (16%) | 193 |
0.57 (1.00) |
0.0444 (1.00) |
0.149 (1.00) |
0.557 (1.00) |
0.352 (1.00) |
0.193 (1.00) |
| AMP PEAK 12(12P12 1) MUTATION ANALYSIS | 22 (10%) | 207 |
0.644 (1.00) |
0.133 (1.00) |
0.114 (1.00) |
0.483 (1.00) |
0.324 (1.00) |
0.168 (1.00) |
| AMP PEAK 14(13Q33 3) MUTATION ANALYSIS | 8 (3%) | 221 |
0.236 (1.00) |
0.904 (1.00) |
0.304 (1.00) |
0.106 (1.00) |
0.443 (1.00) |
0.715 (1.00) |
| AMP PEAK 15(17Q25 1) MUTATION ANALYSIS | 14 (6%) | 215 |
0.00368 (0.985) |
0.25 (1.00) |
1 (1.00) |
0.792 (1.00) |
0.648 (1.00) |
0.411 (1.00) |
| AMP PEAK 16(18Q23) MUTATION ANALYSIS | 8 (3%) | 221 |
0.035 (1.00) |
0.457 (1.00) |
1 (1.00) |
0.0763 (1.00) |
0.243 (1.00) |
0.269 (1.00) |
| AMP PEAK 17(19P13 3) MUTATION ANALYSIS | 53 (23%) | 176 |
0.736 (1.00) |
0.094 (1.00) |
0.639 (1.00) |
0.268 (1.00) |
0.0121 (1.00) |
1 (1.00) |
| AMP PEAK 19(XP22 33) MUTATION ANALYSIS | 14 (6%) | 215 |
0.548 (1.00) |
0.792 (1.00) |
1 (1.00) |
0.555 (1.00) |
0.00443 (1.00) |
0.17 (1.00) |
| AMP PEAK 20(XP11 22) MUTATION ANALYSIS | 31 (14%) | 198 |
0.722 (1.00) |
0.919 (1.00) |
0.121 (1.00) |
0.315 (1.00) |
0.0123 (1.00) |
0.554 (1.00) |
| DEL PEAK 3(1Q43) MUTATION ANALYSIS | 13 (6%) | 216 |
0.626 (1.00) |
0.984 (1.00) |
0.255 (1.00) |
0.802 (1.00) |
0.491 (1.00) |
1 (1.00) |
| DEL PEAK 4(2P25 3) MUTATION ANALYSIS | 18 (8%) | 211 |
0.333 (1.00) |
0.353 (1.00) |
0.806 (1.00) |
0.803 (1.00) |
0.0386 (1.00) |
0.626 (1.00) |
| DEL PEAK 5(2Q37 1) MUTATION ANALYSIS | 29 (13%) | 200 |
0.907 (1.00) |
0.0252 (1.00) |
0.43 (1.00) |
0.0825 (1.00) |
0.142 (1.00) |
0.84 (1.00) |
| DEL PEAK 6(2Q37 3) MUTATION ANALYSIS | 32 (14%) | 197 |
0.793 (1.00) |
0.0699 (1.00) |
1 (1.00) |
0.604 (1.00) |
0.167 (1.00) |
0.697 (1.00) |
| DEL PEAK 7(3P21 1) MUTATION ANALYSIS | 20 (9%) | 209 |
0.138 (1.00) |
0.0269 (1.00) |
0.482 (1.00) |
0.494 (1.00) |
0.369 (1.00) |
0.0568 (1.00) |
| DEL PEAK 8(4Q35 2) MUTATION ANALYSIS | 66 (29%) | 163 |
0.668 (1.00) |
0.698 (1.00) |
0.24 (1.00) |
0.513 (1.00) |
0.216 (1.00) |
0.236 (1.00) |
| DEL PEAK 9(5Q35 2) MUTATION ANALYSIS | 28 (12%) | 201 |
0.0472 (1.00) |
0.525 (1.00) |
0.417 (1.00) |
0.236 (1.00) |
0.142 (1.00) |
0.00641 (1.00) |
| DEL PEAK 10(6P25 3) MUTATION ANALYSIS | 21 (9%) | 208 |
0.00227 (0.612) |
0.524 (1.00) |
0.495 (1.00) |
0.326 (1.00) |
0.00728 (1.00) |
1 (1.00) |
| DEL PEAK 11(6Q24 3) MUTATION ANALYSIS | 36 (16%) | 193 |
0.0287 (1.00) |
0.243 (1.00) |
0.201 (1.00) |
0.452 (1.00) |
0.0133 (1.00) |
0.578 (1.00) |
| DEL PEAK 14(11P15 5) MUTATION ANALYSIS | 46 (20%) | 183 |
0.252 (1.00) |
0.0617 (1.00) |
0.14 (1.00) |
0.657 (1.00) |
0.028 (1.00) |
0.866 (1.00) |
| DEL PEAK 15(11Q25) MUTATION ANALYSIS | 15 (7%) | 214 |
0.00925 (1.00) |
0.991 (1.00) |
0.593 (1.00) |
0.535 (1.00) |
0.367 (1.00) |
1 (1.00) |
| DEL PEAK 16(12Q12) MUTATION ANALYSIS | 28 (12%) | 201 |
0.824 (1.00) |
0.605 (1.00) |
0.842 (1.00) |
0.802 (1.00) |
0.183 (1.00) |
1 (1.00) |
| DEL PEAK 17(13Q14 2) MUTATION ANALYSIS | 67 (29%) | 162 |
0.435 (1.00) |
0.874 (1.00) |
0.662 (1.00) |
0.0894 (1.00) |
0.133 (1.00) |
0.182 (1.00) |
| DEL PEAK 18(13Q21 2) MUTATION ANALYSIS | 69 (30%) | 160 |
0.301 (1.00) |
0.908 (1.00) |
0.665 (1.00) |
0.0894 (1.00) |
0.128 (1.00) |
0.302 (1.00) |
| DEL PEAK 19(13Q22 1) MUTATION ANALYSIS | 68 (30%) | 161 |
0.305 (1.00) |
0.794 (1.00) |
0.772 (1.00) |
0.13 (1.00) |
0.198 (1.00) |
0.237 (1.00) |
| DEL PEAK 20(13Q34) MUTATION ANALYSIS | 52 (23%) | 177 |
0.184 (1.00) |
0.51 (1.00) |
0.635 (1.00) |
0.471 (1.00) |
0.796 (1.00) |
0.631 (1.00) |
| DEL PEAK 21(14Q24 3) MUTATION ANALYSIS | 53 (23%) | 176 |
0.00297 (0.798) |
0.171 (1.00) |
0.0581 (1.00) |
0.868 (1.00) |
0.108 (1.00) |
0.523 (1.00) |
| DEL PEAK 22(17Q25 3) MUTATION ANALYSIS | 14 (6%) | 215 |
0.849 (1.00) |
0.203 (1.00) |
1 (1.00) |
0.326 (1.00) |
0.832 (1.00) |
0.784 (1.00) |
| DEL PEAK 23(18P11 32) MUTATION ANALYSIS | 33 (14%) | 196 |
0.994 (1.00) |
0.909 (1.00) |
0.0894 (1.00) |
0.315 (1.00) |
0.791 (1.00) |
0.128 (1.00) |
| DEL PEAK 24(18Q23) MUTATION ANALYSIS | 36 (16%) | 193 |
0.455 (1.00) |
0.355 (1.00) |
1 (1.00) |
0.948 (1.00) |
0.803 (1.00) |
0.578 (1.00) |
| DEL PEAK 26(22Q13 31) MUTATION ANALYSIS | 33 (14%) | 196 |
0.0914 (1.00) |
0.142 (1.00) |
0.257 (1.00) |
0.541 (1.00) |
0.00118 (0.323) |
0.704 (1.00) |
| DEL PEAK 27(XP22 2) MUTATION ANALYSIS | 47 (21%) | 182 |
0.404 (1.00) |
0.991 (1.00) |
0.192 (1.00) |
0.456 (1.00) |
1 (1.00) |
0.738 (1.00) |
| DEL PEAK 28(XQ21 1) MUTATION ANALYSIS | 31 (14%) | 198 |
0.386 (1.00) |
0.146 (1.00) |
0.44 (1.00) |
0.895 (1.00) |
0.23 (1.00) |
0.844 (1.00) |
P value = 3.9e-05 (t-test), Q value = 0.011
Table S1. Gene #2: 'AMP PEAK 2(1Q32.1) MUTATION STATUS' versus Clinical Feature #2: 'AGE'
| nPatients | Mean (Std.Dev) | |
|---|---|---|
| ALL | 229 | 42.8 (13.4) |
| AMP PEAK 2(1Q32.1) MUTATED | 24 | 53.3 (11.2) |
| AMP PEAK 2(1Q32.1) WILD-TYPE | 205 | 41.5 (13.1) |
Figure S1. Get High-res Image Gene #2: 'AMP PEAK 2(1Q32.1) MUTATION STATUS' versus Clinical Feature #2: 'AGE'
P value = 0.000178 (logrank test), Q value = 0.049
Table S2. Gene #4: 'AMP PEAK 4(3Q26.32) MUTATION STATUS' versus Clinical Feature #1: 'Time to Death'
| nPatients | nDeath | Duration Range (Median), Month | |
|---|---|---|---|
| ALL | 229 | 55 | 0.0 - 211.2 (14.5) |
| AMP PEAK 4(3Q26.32) MUTATED | 11 | 5 | 0.2 - 41.1 (8.8) |
| AMP PEAK 4(3Q26.32) WILD-TYPE | 218 | 50 | 0.0 - 211.2 (14.7) |
Figure S2. Get High-res Image Gene #4: 'AMP PEAK 4(3Q26.32) MUTATION STATUS' versus Clinical Feature #1: 'Time to Death'
P value = 0.000161 (t-test), Q value = 0.045
Table S3. Gene #6: 'AMP PEAK 6(7P11.2) MUTATION STATUS' versus Clinical Feature #2: 'AGE'
| nPatients | Mean (Std.Dev) | |
|---|---|---|
| ALL | 229 | 42.8 (13.4) |
| AMP PEAK 6(7P11.2) MUTATED | 60 | 48.5 (13.3) |
| AMP PEAK 6(7P11.2) WILD-TYPE | 169 | 40.7 (12.8) |
Figure S3. Get High-res Image Gene #6: 'AMP PEAK 6(7P11.2) MUTATION STATUS' versus Clinical Feature #2: 'AGE'
P value = 3.39e-05 (t-test), Q value = 0.0095
Table S4. Gene #7: 'AMP PEAK 7(7Q32.3) MUTATION STATUS' versus Clinical Feature #2: 'AGE'
| nPatients | Mean (Std.Dev) | |
|---|---|---|
| ALL | 229 | 42.8 (13.4) |
| AMP PEAK 7(7Q32.3) MUTATED | 82 | 47.6 (13.0) |
| AMP PEAK 7(7Q32.3) WILD-TYPE | 147 | 40.0 (12.8) |
Figure S4. Get High-res Image Gene #7: 'AMP PEAK 7(7Q32.3) MUTATION STATUS' versus Clinical Feature #2: 'AGE'
P value = 0.000429 (t-test), Q value = 0.12
Table S5. Gene #9: 'AMP PEAK 9(10P15.3) MUTATION STATUS' versus Clinical Feature #2: 'AGE'
| nPatients | Mean (Std.Dev) | |
|---|---|---|
| ALL | 229 | 42.8 (13.4) |
| AMP PEAK 9(10P15.3) MUTATED | 34 | 36.3 (10.4) |
| AMP PEAK 9(10P15.3) WILD-TYPE | 195 | 43.9 (13.5) |
Figure S5. Get High-res Image Gene #9: 'AMP PEAK 9(10P15.3) MUTATION STATUS' versus Clinical Feature #2: 'AGE'
P value = 4.94e-05 (logrank test), Q value = 0.014
Table S6. Gene #13: 'AMP PEAK 13(12Q14.1) MUTATION STATUS' versus Clinical Feature #1: 'Time to Death'
| nPatients | nDeath | Duration Range (Median), Month | |
|---|---|---|---|
| ALL | 229 | 55 | 0.0 - 211.2 (14.5) |
| AMP PEAK 13(12Q14.1) MUTATED | 15 | 9 | 1.2 - 80.0 (12.4) |
| AMP PEAK 13(12Q14.1) WILD-TYPE | 214 | 46 | 0.0 - 211.2 (14.5) |
Figure S6. Get High-res Image Gene #13: 'AMP PEAK 13(12Q14.1) MUTATION STATUS' versus Clinical Feature #1: 'Time to Death'
P value = 1e-05 (logrank test), Q value = 0.0028
Table S7. Gene #18: 'AMP PEAK 18(19Q13.2) MUTATION STATUS' versus Clinical Feature #1: 'Time to Death'
| nPatients | nDeath | Duration Range (Median), Month | |
|---|---|---|---|
| ALL | 229 | 55 | 0.0 - 211.2 (14.5) |
| AMP PEAK 18(19Q13.2) MUTATED | 16 | 7 | 0.0 - 43.9 (12.9) |
| AMP PEAK 18(19Q13.2) WILD-TYPE | 213 | 48 | 0.1 - 211.2 (14.5) |
Figure S7. Get High-res Image Gene #18: 'AMP PEAK 18(19Q13.2) MUTATION STATUS' versus Clinical Feature #1: 'Time to Death'
P value = 2.3e-05 (t-test), Q value = 0.0065
Table S8. Gene #18: 'AMP PEAK 18(19Q13.2) MUTATION STATUS' versus Clinical Feature #2: 'AGE'
| nPatients | Mean (Std.Dev) | |
|---|---|---|
| ALL | 229 | 42.8 (13.4) |
| AMP PEAK 18(19Q13.2) MUTATED | 16 | 53.4 (7.8) |
| AMP PEAK 18(19Q13.2) WILD-TYPE | 213 | 42.0 (13.4) |
Figure S8. Get High-res Image Gene #18: 'AMP PEAK 18(19Q13.2) MUTATION STATUS' versus Clinical Feature #2: 'AGE'
P value = 1.19e-13 (Fisher's exact test), Q value = 3.4e-11
Table S9. Gene #21: 'DEL PEAK 1(1P36.31) MUTATION STATUS' versus Clinical Feature #5: 'HISTOLOGICAL.TYPE'
| nPatients | ASTROCYTOMA | OLIGOASTROCYTOMA | OLIGODENDROGLIOMA |
|---|---|---|---|
| ALL | 71 | 64 | 93 |
| DEL PEAK 1(1P36.31) MUTATED | 9 | 15 | 62 |
| DEL PEAK 1(1P36.31) WILD-TYPE | 62 | 49 | 31 |
Figure S9. Get High-res Image Gene #21: 'DEL PEAK 1(1P36.31) MUTATION STATUS' versus Clinical Feature #5: 'HISTOLOGICAL.TYPE'
P value = 9.71e-15 (Fisher's exact test), Q value = 2.8e-12
Table S10. Gene #22: 'DEL PEAK 2(1P32.3) MUTATION STATUS' versus Clinical Feature #5: 'HISTOLOGICAL.TYPE'
| nPatients | ASTROCYTOMA | OLIGOASTROCYTOMA | OLIGODENDROGLIOMA |
|---|---|---|---|
| ALL | 71 | 64 | 93 |
| DEL PEAK 2(1P32.3) MUTATED | 8 | 12 | 61 |
| DEL PEAK 2(1P32.3) WILD-TYPE | 63 | 52 | 32 |
Figure S10. Get High-res Image Gene #22: 'DEL PEAK 2(1P32.3) MUTATION STATUS' versus Clinical Feature #5: 'HISTOLOGICAL.TYPE'
P value = 5.18e-06 (logrank test), Q value = 0.0015
Table S11. Gene #32: 'DEL PEAK 12(9P21.3) MUTATION STATUS' versus Clinical Feature #1: 'Time to Death'
| nPatients | nDeath | Duration Range (Median), Month | |
|---|---|---|---|
| ALL | 229 | 55 | 0.0 - 211.2 (14.5) |
| DEL PEAK 12(9P21.3) MUTATED | 83 | 29 | 0.1 - 117.4 (16.2) |
| DEL PEAK 12(9P21.3) WILD-TYPE | 146 | 26 | 0.0 - 211.2 (14.3) |
Figure S11. Get High-res Image Gene #32: 'DEL PEAK 12(9P21.3) MUTATION STATUS' versus Clinical Feature #1: 'Time to Death'
P value = 6.22e-05 (t-test), Q value = 0.017
Table S12. Gene #32: 'DEL PEAK 12(9P21.3) MUTATION STATUS' versus Clinical Feature #2: 'AGE'
| nPatients | Mean (Std.Dev) | |
|---|---|---|
| ALL | 229 | 42.8 (13.4) |
| DEL PEAK 12(9P21.3) MUTATED | 83 | 47.4 (12.9) |
| DEL PEAK 12(9P21.3) WILD-TYPE | 146 | 40.1 (12.9) |
Figure S12. Get High-res Image Gene #32: 'DEL PEAK 12(9P21.3) MUTATION STATUS' versus Clinical Feature #2: 'AGE'
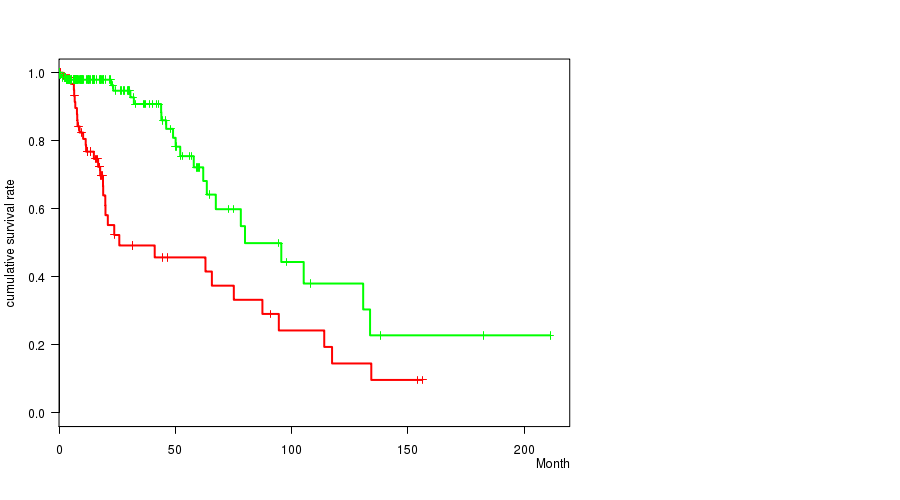
P value = 4.06e-05 (logrank test), Q value = 0.011
Table S13. Gene #33: 'DEL PEAK 13(10Q26.3) MUTATION STATUS' versus Clinical Feature #1: 'Time to Death'
| nPatients | nDeath | Duration Range (Median), Month | |
|---|---|---|---|
| ALL | 229 | 55 | 0.0 - 211.2 (14.5) |
| DEL PEAK 13(10Q26.3) MUTATED | 70 | 32 | 0.1 - 156.2 (15.3) |
| DEL PEAK 13(10Q26.3) WILD-TYPE | 159 | 23 | 0.0 - 211.2 (14.4) |
Figure S13. Get High-res Image Gene #33: 'DEL PEAK 13(10Q26.3) MUTATION STATUS' versus Clinical Feature #1: 'Time to Death'
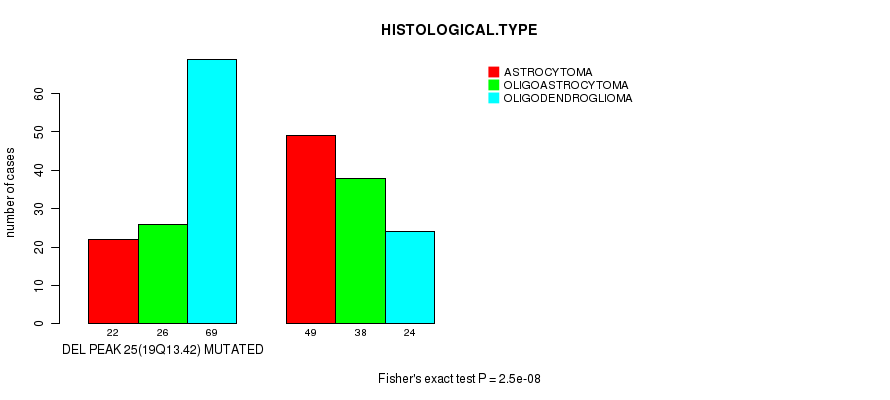
P value = 2.5e-08 (Fisher's exact test), Q value = 7.2e-06
Table S14. Gene #45: 'DEL PEAK 25(19Q13.42) MUTATION STATUS' versus Clinical Feature #5: 'HISTOLOGICAL.TYPE'
| nPatients | ASTROCYTOMA | OLIGOASTROCYTOMA | OLIGODENDROGLIOMA |
|---|---|---|---|
| ALL | 71 | 64 | 93 |
| DEL PEAK 25(19Q13.42) MUTATED | 22 | 26 | 69 |
| DEL PEAK 25(19Q13.42) WILD-TYPE | 49 | 38 | 24 |
Figure S14. Get High-res Image Gene #45: 'DEL PEAK 25(19Q13.42) MUTATION STATUS' versus Clinical Feature #5: 'HISTOLOGICAL.TYPE'
-
Copy number data file = transformed.cor.cli.txt
-
Clinical data file = LGG-TP.clin.merged.picked.txt
-
Number of patients = 229
-
Number of significantly focal cnvs = 48
-
Number of selected clinical features = 6
-
Exclude genes that fewer than K tumors have mutations, K = 3
For survival clinical features, the Kaplan-Meier survival curves of tumors with and without gene mutations were plotted and the statistical significance P values were estimated by logrank test (Bland and Altman 2004) using the 'survdiff' function in R
For continuous numerical clinical features, two-tailed Student's t test with unequal variance (Lehmann and Romano 2005) was applied to compare the clinical values between tumors with and without gene mutations using 't.test' function in R
For binary or multi-class clinical features (nominal or ordinal), two-tailed Fisher's exact tests (Fisher 1922) were used to estimate the P values using the 'fisher.test' function in R
For multiple hypothesis correction, Q value is the False Discovery Rate (FDR) analogue of the P value (Benjamini and Hochberg 1995), defined as the minimum FDR at which the test may be called significant. We used the 'Benjamini and Hochberg' method of 'p.adjust' function in R to convert P values into Q values.
In addition to the links below, the full results of the analysis summarized in this report can also be downloaded programmatically using firehose_get, or interactively from either the Broad GDAC website or TCGA Data Coordination Center Portal.