This pipeline uses various statistical tests to identify genes whose promoter methylation levels correlated to selected clinical features.
Testing the association between 20103 genes and 6 clinical features across 233 samples, statistically thresholded by Q value < 0.05, 5 clinical features related to at least one genes.
-
955 genes correlated to 'Time to Death'.
-
ATF3 , UMODL1 , HS3ST4 , ISM1 , HPD , ...
-
307 genes correlated to 'AGE'.
-
TRIM58 , SHISA2 , SLC22A16 , LOC150786 , HOXD8 , ...
-
15 genes correlated to 'GENDER'.
-
ALG11__1 , UTP14C , POLDIP3 , RNU12 , FAM35A , ...
-
1151 genes correlated to 'HISTOLOGICAL.TYPE'.
-
CCDC88C , SLC2A4RG , MAPKAP1 , BVES , REST , ...
-
16 genes correlated to 'RADIATIONS.RADIATION.REGIMENINDICATION'.
-
JAK2 , EFCAB7__2 , ITGB3BP__1 , ZMYM4 , HSPA13 , ...
-
No genes correlated to 'KARNOFSKY.PERFORMANCE.SCORE'
Complete statistical result table is provided in Supplement Table 1
Table 1. Get Full Table This table shows the clinical features, statistical methods used, and the number of genes that are significantly associated with each clinical feature at Q value < 0.05.
| Clinical feature | Statistical test | Significant genes | Associated with | Associated with | ||
|---|---|---|---|---|---|---|
| Time to Death | Cox regression test | N=955 | shorter survival | N=125 | longer survival | N=830 |
| AGE | Spearman correlation test | N=307 | older | N=181 | younger | N=126 |
| GENDER | t test | N=15 | male | N=6 | female | N=9 |
| KARNOFSKY PERFORMANCE SCORE | Spearman correlation test | N=0 | ||||
| HISTOLOGICAL TYPE | ANOVA test | N=1151 | ||||
| RADIATIONS RADIATION REGIMENINDICATION | t test | N=16 | yes | N=10 | no | N=6 |
Table S1. Basic characteristics of clinical feature: 'Time to Death'
| Time to Death | Duration (Months) | 0-211.2 (median=14.4) |
| censored | N = 184 | |
| death | N = 49 | |
| Significant markers | N = 955 | |
| associated with shorter survival | 125 | |
| associated with longer survival | 830 |
Table S2. Get Full Table List of top 10 genes significantly associated with 'Time to Death' by Cox regression test
| HazardRatio | Wald_P | Q | C_index | |
|---|---|---|---|---|
| ATF3 | 0 | 4.896e-14 | 9.8e-10 | 0.238 |
| UMODL1 | 0 | 2.389e-13 | 4.8e-09 | 0.266 |
| HS3ST4 | 191 | 1.686e-12 | 3.4e-08 | 0.782 |
| ISM1 | 6401 | 1.785e-12 | 3.6e-08 | 0.719 |
| HPD | 0 | 1.973e-12 | 4e-08 | 0.252 |
| ZNF492 | 100 | 3.315e-12 | 6.7e-08 | 0.71 |
| NID2 | 0 | 4.38e-12 | 8.8e-08 | 0.22 |
| TLK1 | 0.01 | 5.349e-12 | 1.1e-07 | 0.252 |
| CARD6 | 0.01 | 6.224e-12 | 1.3e-07 | 0.296 |
| CD274 | 0.01 | 6.727e-12 | 1.4e-07 | 0.248 |
Figure S1. Get High-res Image As an example, this figure shows the association of ATF3 to 'Time to Death'. four curves present the cumulative survival rates of 4 quartile subsets of patients. P value = 4.9e-14 with univariate Cox regression analysis using continuous log-2 expression values.
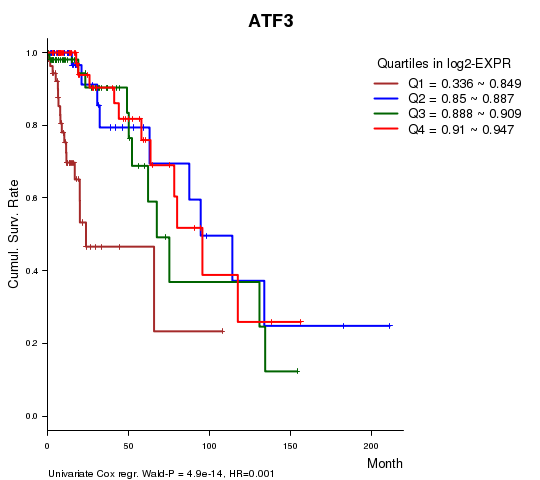
Table S3. Basic characteristics of clinical feature: 'AGE'
| AGE | Mean (SD) | 42.81 (13) |
| Significant markers | N = 307 | |
| pos. correlated | 181 | |
| neg. correlated | 126 |
Table S4. Get Full Table List of top 10 genes significantly correlated to 'AGE' by Spearman correlation test
| SpearmanCorr | corrP | Q | |
|---|---|---|---|
| TRIM58 | 0.5442 | 2.3e-19 | 4.62e-15 |
| SHISA2 | 0.5327 | 1.757e-18 | 3.53e-14 |
| SLC22A16 | 0.5209 | 1.309e-17 | 2.63e-13 |
| LOC150786 | 0.5163 | 2.814e-17 | 5.66e-13 |
| HOXD8 | 0.5085 | 1.003e-16 | 2.02e-12 |
| GALNT14 | 0.4993 | 4.301e-16 | 8.64e-12 |
| ADAMTSL3 | 0.4915 | 1.418e-15 | 2.85e-11 |
| HOXD11 | 0.4914 | 1.445e-15 | 2.9e-11 |
| EPHA6 | 0.4906 | 1.635e-15 | 3.29e-11 |
| PAX9 | 0.4803 | 7.484e-15 | 1.5e-10 |
Figure S2. Get High-res Image As an example, this figure shows the association of TRIM58 to 'AGE'. P value = 2.3e-19 with Spearman correlation analysis. The straight line presents the best linear regression.
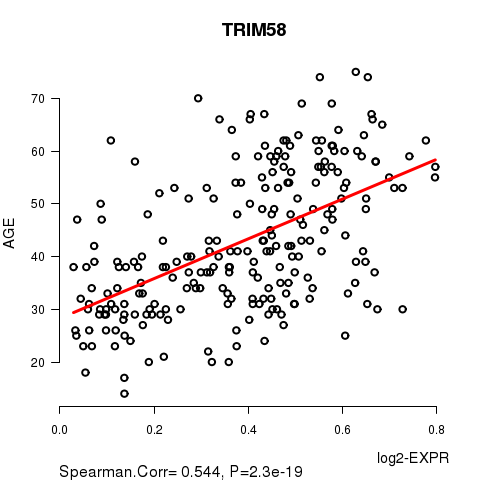
Table S5. Basic characteristics of clinical feature: 'GENDER'
| GENDER | Labels | N |
| FEMALE | 106 | |
| MALE | 127 | |
| Significant markers | N = 15 | |
| Higher in MALE | 6 | |
| Higher in FEMALE | 9 |
Table S6. Get Full Table List of top 10 genes differentially expressed by 'GENDER'
| T(pos if higher in 'MALE') | ttestP | Q | AUC | |
|---|---|---|---|---|
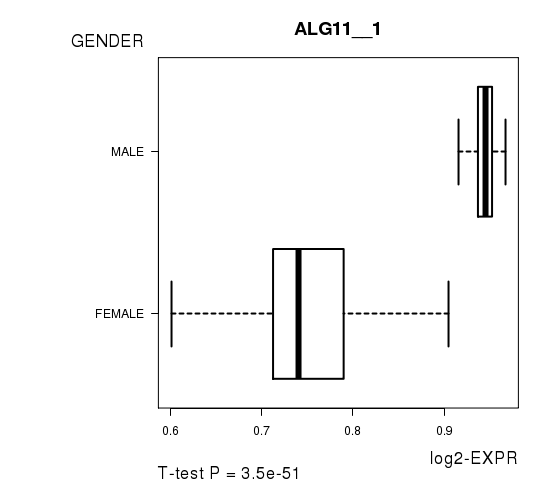
| ALG11__1 | 24.37 | 3.497e-51 | 7.03e-47 | 0.9799 |
| UTP14C | 24.37 | 3.497e-51 | 7.03e-47 | 0.9799 |
| POLDIP3 | -16.76 | 9.925e-38 | 2e-33 | 0.9401 |
| RNU12 | -16.76 | 9.925e-38 | 2e-33 | 0.9401 |
| FAM35A | -11.6 | 1.109e-24 | 2.23e-20 | 0.8358 |
| GLUD1 | -11.6 | 1.109e-24 | 2.23e-20 | 0.8358 |
| WBP11P1 | 9.97 | 1.897e-19 | 3.81e-15 | 0.8468 |
| TFDP1 | -8.76 | 5.124e-16 | 1.03e-11 | 0.882 |
| KIF4B | -7.81 | 4.566e-13 | 9.18e-09 | 0.7546 |
| ZNF839 | -6.94 | 4.68e-11 | 9.4e-07 | 0.7827 |
Figure S3. Get High-res Image As an example, this figure shows the association of ALG11__1 to 'GENDER'. P value = 3.5e-51 with T-test analysis.
No gene related to 'KARNOFSKY.PERFORMANCE.SCORE'.
Table S7. Basic characteristics of clinical feature: 'KARNOFSKY.PERFORMANCE.SCORE'
| KARNOFSKY.PERFORMANCE.SCORE | Mean (SD) | 88.17 (11) |
| Significant markers | N = 0 |
Table S8. Basic characteristics of clinical feature: 'HISTOLOGICAL.TYPE'
| HISTOLOGICAL.TYPE | Labels | N |
| ASTROCYTOMA | 68 | |
| OLIGOASTROCYTOMA | 68 | |
| OLIGODENDROGLIOMA | 96 | |
| Significant markers | N = 1151 |
Table S9. Get Full Table List of top 10 genes differentially expressed by 'HISTOLOGICAL.TYPE'
| ANOVA_P | Q | |
|---|---|---|
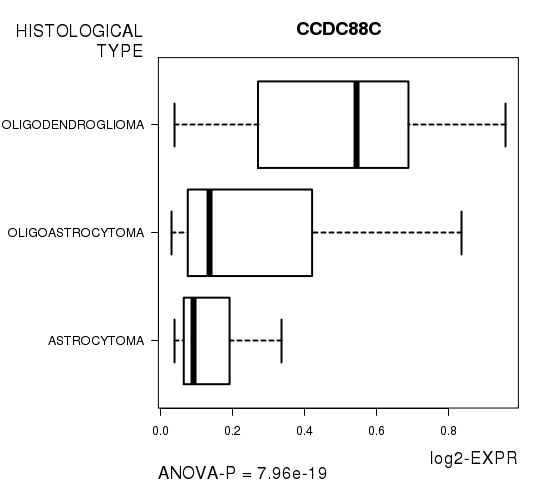
| CCDC88C | 7.965e-19 | 1.6e-14 |
| SLC2A4RG | 2.376e-17 | 4.78e-13 |
| MAPKAP1 | 2.896e-17 | 5.82e-13 |
| BVES | 4.095e-17 | 8.23e-13 |
| REST | 5.869e-17 | 1.18e-12 |
| CBX2 | 1.226e-16 | 2.46e-12 |
| EMP1 | 4.039e-16 | 8.12e-12 |
| TMEM51 | 4.235e-16 | 8.51e-12 |
| NCKAP5 | 1.14e-15 | 2.29e-11 |
| GLIS3 | 1.656e-15 | 3.33e-11 |
Figure S4. Get High-res Image As an example, this figure shows the association of CCDC88C to 'HISTOLOGICAL.TYPE'. P value = 7.96e-19 with ANOVA analysis.
16 genes related to 'RADIATIONS.RADIATION.REGIMENINDICATION'.
Table S10. Basic characteristics of clinical feature: 'RADIATIONS.RADIATION.REGIMENINDICATION'
| RADIATIONS.RADIATION.REGIMENINDICATION | Labels | N |
| NO | 85 | |
| YES | 148 | |
| Significant markers | N = 16 | |
| Higher in YES | 10 | |
| Higher in NO | 6 |
Table S11. Get Full Table List of top 10 genes differentially expressed by 'RADIATIONS.RADIATION.REGIMENINDICATION'
| T(pos if higher in 'YES') | ttestP | Q | AUC | |
|---|---|---|---|---|
| JAK2 | -5.84 | 2.603e-08 | 0.000523 | 0.706 |
| EFCAB7__2 | 5.69 | 3.908e-08 | 0.000786 | 0.7181 |
| ITGB3BP__1 | 5.69 | 3.908e-08 | 0.000786 | 0.7181 |
| ZMYM4 | 5.61 | 5.972e-08 | 0.0012 | 0.7077 |
| HSPA13 | 5.52 | 9.131e-08 | 0.00184 | 0.6548 |
| ZNF567 | -5.3 | 4.462e-07 | 0.00897 | 0.6998 |
| FLRT3 | 5.13 | 6.065e-07 | 0.0122 | 0.659 |
| MACROD2 | 5.13 | 6.065e-07 | 0.0122 | 0.659 |
| ELMOD3 | -5.07 | 1.205e-06 | 0.0242 | 0.6869 |
| RETSAT__1 | -5.07 | 1.205e-06 | 0.0242 | 0.6869 |
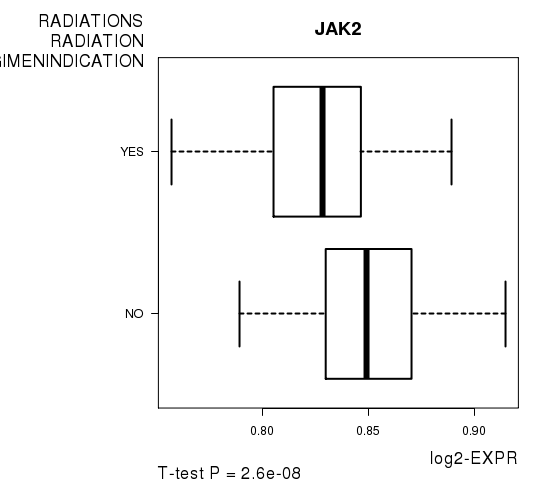
Figure S5. Get High-res Image As an example, this figure shows the association of JAK2 to 'RADIATIONS.RADIATION.REGIMENINDICATION'. P value = 2.6e-08 with T-test analysis.
-
Expresson data file = LGG-TP.meth.by_min_expr_corr.data.txt
-
Clinical data file = LGG-TP.clin.merged.picked.txt
-
Number of patients = 233
-
Number of genes = 20103
-
Number of clinical features = 6
For survival clinical features, Wald's test in univariate Cox regression analysis with proportional hazards model (Andersen and Gill 1982) was used to estimate the P values using the 'coxph' function in R. Kaplan-Meier survival curves were plot using the four quartile subgroups of patients based on expression levels
For continuous numerical clinical features, Spearman's rank correlation coefficients (Spearman 1904) and two-tailed P values were estimated using 'cor.test' function in R
For two-class clinical features, two-tailed Student's t test with unequal variance (Lehmann and Romano 2005) was applied to compare the log2-expression levels between the two clinical classes using 't.test' function in R
For multi-class clinical features (ordinal or nominal), one-way analysis of variance (Howell 2002) was applied to compare the log2-expression levels between different clinical classes using 'anova' function in R
For multiple hypothesis correction, Q value is the False Discovery Rate (FDR) analogue of the P value (Benjamini and Hochberg 1995), defined as the minimum FDR at which the test may be called significant. We used the 'Benjamini and Hochberg' method of 'p.adjust' function in R to convert P values into Q values.
In addition to the links below, the full results of the analysis summarized in this report can also be downloaded programmatically using firehose_get, or interactively from either the Broad GDAC website or TCGA Data Coordination Center Portal.