This pipeline uses various statistical tests to identify mRNAs whose expression levels correlated to selected clinical features.
Testing the association between 18324 genes and 6 clinical features across 231 samples, statistically thresholded by Q value < 0.05, 5 clinical features related to at least one genes.
-
664 genes correlated to 'Time to Death'.
-
SLITRK5|26050 , FNDC3B|64778 , RANBP17|64901 , CBARA1|10367 , CRTAC1|55118 , ...
-
191 genes correlated to 'AGE'.
-
PRSS35|167681 , SFRP2|6423 , TRMT2B|79979 , SYT6|148281 , GRPEL2|134266 , ...
-
29 genes correlated to 'GENDER'.
-
XIST|7503 , ZFY|7544 , RPS4Y1|6192 , PRKY|5616 , KDM5D|8284 , ...
-
2965 genes correlated to 'HISTOLOGICAL.TYPE'.
-
TXNDC12|51060 , AK2|204 , WLS|79971 , RHOC|389 , SEP15|9403 , ...
-
1 gene correlated to 'RADIATIONS.RADIATION.REGIMENINDICATION'.
-
C17ORF63|55731
-
No genes correlated to 'KARNOFSKY.PERFORMANCE.SCORE'
Complete statistical result table is provided in Supplement Table 1
Table 1. Get Full Table This table shows the clinical features, statistical methods used, and the number of genes that are significantly associated with each clinical feature at Q value < 0.05.
| Clinical feature | Statistical test | Significant genes | Associated with | Associated with | ||
|---|---|---|---|---|---|---|
| Time to Death | Cox regression test | N=664 | shorter survival | N=306 | longer survival | N=358 |
| AGE | Spearman correlation test | N=191 | older | N=84 | younger | N=107 |
| GENDER | t test | N=29 | male | N=17 | female | N=12 |
| KARNOFSKY PERFORMANCE SCORE | Spearman correlation test | N=0 | ||||
| HISTOLOGICAL TYPE | ANOVA test | N=2965 | ||||
| RADIATIONS RADIATION REGIMENINDICATION | t test | N=1 | yes | N=0 | no | N=1 |
Table S1. Basic characteristics of clinical feature: 'Time to Death'
| Time to Death | Duration (Months) | 0-211.2 (median=14.5) |
| censored | N = 176 | |
| death | N = 55 | |
| Significant markers | N = 664 | |
| associated with shorter survival | 306 | |
| associated with longer survival | 358 |
Table S2. Get Full Table List of top 10 genes significantly associated with 'Time to Death' by Cox regression test
| HazardRatio | Wald_P | Q | C_index | |
|---|---|---|---|---|
| SLITRK5|26050 | 0.41 | 1.088e-13 | 2e-09 | 0.255 |
| FNDC3B|64778 | 4 | 1.197e-12 | 2.2e-08 | 0.784 |
| RANBP17|64901 | 0.63 | 2.374e-12 | 4.3e-08 | 0.311 |
| CBARA1|10367 | 0.14 | 3.787e-12 | 6.9e-08 | 0.232 |
| CRTAC1|55118 | 0.64 | 4.56e-12 | 8.4e-08 | 0.24 |
| CUEDC2|79004 | 0.09 | 4.816e-12 | 8.8e-08 | 0.237 |
| NTNG2|84628 | 0.48 | 7.25e-12 | 1.3e-07 | 0.207 |
| LOC254559|254559 | 0.53 | 7.705e-12 | 1.4e-07 | 0.227 |
| PVRL1|5818 | 0.35 | 1.19e-11 | 2.2e-07 | 0.271 |
| ZDHHC22|283576 | 0.55 | 1.24e-11 | 2.3e-07 | 0.27 |
Figure S1. Get High-res Image As an example, this figure shows the association of SLITRK5|26050 to 'Time to Death'. four curves present the cumulative survival rates of 4 quartile subsets of patients. P value = 1.09e-13 with univariate Cox regression analysis using continuous log-2 expression values.
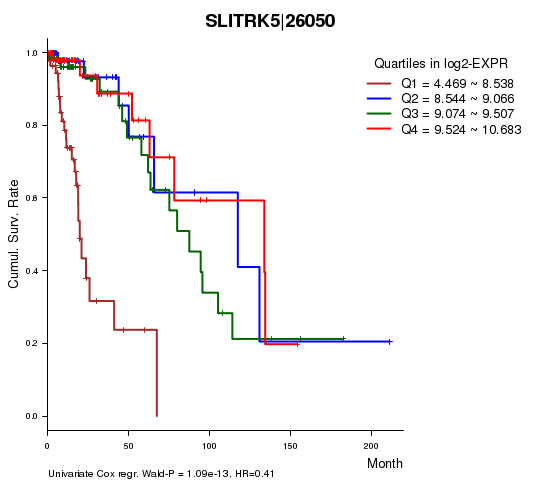
Table S3. Basic characteristics of clinical feature: 'AGE'
| AGE | Mean (SD) | 42.73 (13) |
| Significant markers | N = 191 | |
| pos. correlated | 84 | |
| neg. correlated | 107 |
Table S4. Get Full Table List of top 10 genes significantly correlated to 'AGE' by Spearman correlation test
| SpearmanCorr | corrP | Q | |
|---|---|---|---|
| PRSS35|167681 | -0.4377 | 3.137e-12 | 5.75e-08 |
| SFRP2|6423 | -0.4325 | 5.989e-12 | 1.1e-07 |
| TRMT2B|79979 | 0.4255 | 1.417e-11 | 2.6e-07 |
| SYT6|148281 | -0.4199 | 2.787e-11 | 5.11e-07 |
| GRPEL2|134266 | 0.4027 | 2.029e-10 | 3.72e-06 |
| SIM2|6493 | 0.4025 | 2.088e-10 | 3.82e-06 |
| ZDHHC19|131540 | -0.3978 | 5.456e-10 | 9.99e-06 |
| DTX4|23220 | -0.3913 | 7.192e-10 | 1.32e-05 |
| TMIGD2|126259 | -0.391 | 7.371e-10 | 1.35e-05 |
| EEPD1|80820 | -0.3903 | 8e-10 | 1.47e-05 |
Figure S2. Get High-res Image As an example, this figure shows the association of PRSS35|167681 to 'AGE'. P value = 3.14e-12 with Spearman correlation analysis. The straight line presents the best linear regression.
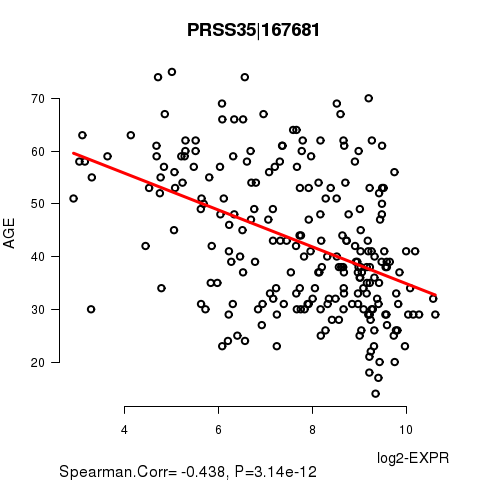
Table S5. Basic characteristics of clinical feature: 'GENDER'
| GENDER | Labels | N |
| FEMALE | 103 | |
| MALE | 128 | |
| Significant markers | N = 29 | |
| Higher in MALE | 17 | |
| Higher in FEMALE | 12 |
Table S6. Get Full Table List of top 10 genes differentially expressed by 'GENDER'
| T(pos if higher in 'MALE') | ttestP | Q | AUC | |
|---|---|---|---|---|
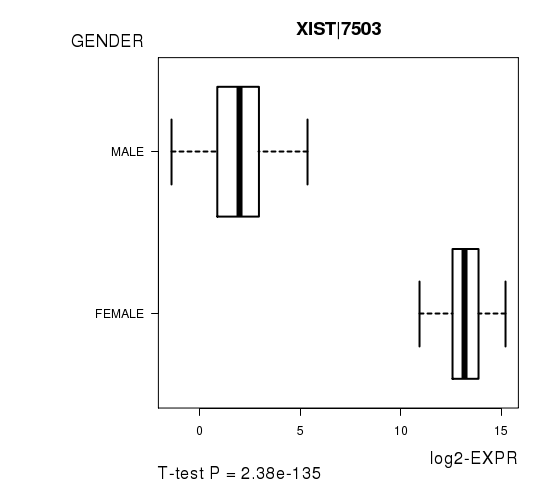
| XIST|7503 | -57.68 | 2.379e-135 | 4.36e-131 | 0.9999 |
| ZFY|7544 | 67.18 | 4.971e-101 | 9.11e-97 | 1 |
| RPS4Y1|6192 | 60.8 | 2.628e-87 | 4.81e-83 | 1 |
| PRKY|5616 | 36.7 | 1.523e-84 | 2.79e-80 | 0.9998 |
| KDM5D|8284 | 72 | 2.332e-79 | 4.27e-75 | 1 |
| NLGN4Y|22829 | 37.1 | 7.743e-78 | 1.42e-73 | 0.9972 |
| USP9Y|8287 | 75.86 | 4.291e-76 | 7.86e-72 | 1 |
| DDX3Y|8653 | 71.25 | 2.572e-75 | 4.71e-71 | 1 |
| TSIX|9383 | -26.82 | 8.498e-63 | 1.56e-58 | 1 |
| EIF1AY|9086 | 78.19 | 3.037e-59 | 5.56e-55 | 1 |
Figure S3. Get High-res Image As an example, this figure shows the association of XIST|7503 to 'GENDER'. P value = 2.38e-135 with T-test analysis.
No gene related to 'KARNOFSKY.PERFORMANCE.SCORE'.
Table S7. Basic characteristics of clinical feature: 'KARNOFSKY.PERFORMANCE.SCORE'
| KARNOFSKY.PERFORMANCE.SCORE | Mean (SD) | 88.12 (11) |
| Significant markers | N = 0 |
Table S8. Basic characteristics of clinical feature: 'HISTOLOGICAL.TYPE'
| HISTOLOGICAL.TYPE | Labels | N |
| ASTROCYTOMA | 71 | |
| OLIGOASTROCYTOMA | 65 | |
| OLIGODENDROGLIOMA | 94 | |
| Significant markers | N = 2965 |
Table S9. Get Full Table List of top 10 genes differentially expressed by 'HISTOLOGICAL.TYPE'
| ANOVA_P | Q | |
|---|---|---|
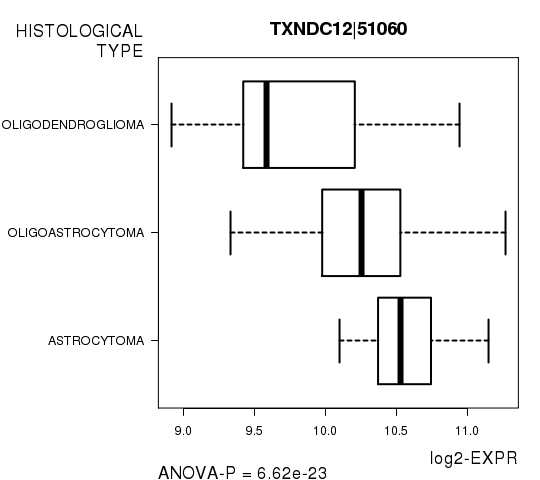
| TXNDC12|51060 | 6.623e-23 | 1.21e-18 |
| AK2|204 | 1.563e-22 | 2.86e-18 |
| WLS|79971 | 5.702e-22 | 1.04e-17 |
| RHOC|389 | 5.764e-22 | 1.06e-17 |
| SEP15|9403 | 9.128e-22 | 1.67e-17 |
| TRAPPC3|27095 | 2.947e-21 | 5.4e-17 |
| STK40|83931 | 4.755e-21 | 8.71e-17 |
| GNG5|2787 | 4.876e-21 | 8.93e-17 |
| CAP1|10487 | 5.428e-21 | 9.94e-17 |
| LRRC42|115353 | 1.584e-20 | 2.9e-16 |
Figure S4. Get High-res Image As an example, this figure shows the association of TXNDC12|51060 to 'HISTOLOGICAL.TYPE'. P value = 6.62e-23 with ANOVA analysis.
One gene related to 'RADIATIONS.RADIATION.REGIMENINDICATION'.
Table S10. Basic characteristics of clinical feature: 'RADIATIONS.RADIATION.REGIMENINDICATION'
| RADIATIONS.RADIATION.REGIMENINDICATION | Labels | N |
| NO | 90 | |
| YES | 141 | |
| Significant markers | N = 1 | |
| Higher in YES | 0 | |
| Higher in NO | 1 |
Table S11. Get Full Table List of one gene differentially expressed by 'RADIATIONS.RADIATION.REGIMENINDICATION'
| T(pos if higher in 'YES') | ttestP | Q | AUC | |
|---|---|---|---|---|
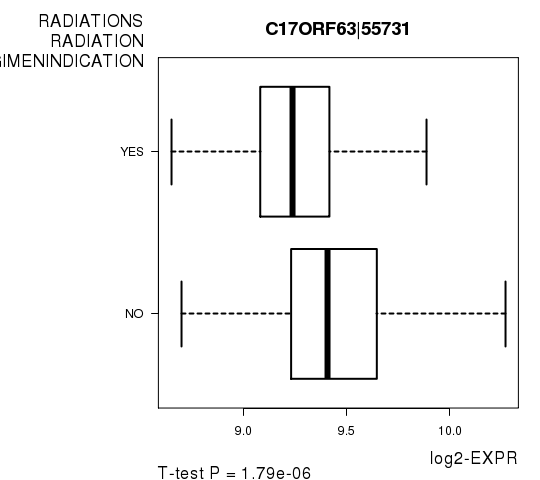
| C17ORF63|55731 | -4.97 | 1.793e-06 | 0.0329 | 0.6838 |
Figure S5. Get High-res Image As an example, this figure shows the association of C17ORF63|55731 to 'RADIATIONS.RADIATION.REGIMENINDICATION'. P value = 1.79e-06 with T-test analysis.
-
Expresson data file = LGG-TP.uncv2.mRNAseq_RSEM_normalized_log2.txt
-
Clinical data file = LGG-TP.clin.merged.picked.txt
-
Number of patients = 231
-
Number of genes = 18324
-
Number of clinical features = 6
For survival clinical features, Wald's test in univariate Cox regression analysis with proportional hazards model (Andersen and Gill 1982) was used to estimate the P values using the 'coxph' function in R. Kaplan-Meier survival curves were plot using the four quartile subgroups of patients based on expression levels
For continuous numerical clinical features, Spearman's rank correlation coefficients (Spearman 1904) and two-tailed P values were estimated using 'cor.test' function in R
For two-class clinical features, two-tailed Student's t test with unequal variance (Lehmann and Romano 2005) was applied to compare the log2-expression levels between the two clinical classes using 't.test' function in R
For multi-class clinical features (ordinal or nominal), one-way analysis of variance (Howell 2002) was applied to compare the log2-expression levels between different clinical classes using 'anova' function in R
For multiple hypothesis correction, Q value is the False Discovery Rate (FDR) analogue of the P value (Benjamini and Hochberg 1995), defined as the minimum FDR at which the test may be called significant. We used the 'Benjamini and Hochberg' method of 'p.adjust' function in R to convert P values into Q values.
In addition to the links below, the full results of the analysis summarized in this report can also be downloaded programmatically using firehose_get, or interactively from either the Broad GDAC website or TCGA Data Coordination Center Portal.