This pipeline uses various statistical tests to identify miRs whose expression levels correlated to selected clinical features.
Testing the association between 542 genes and 6 clinical features across 240 samples, statistically thresholded by Q value < 0.05, 3 clinical features related to at least one genes.
-
11 genes correlated to 'Time to Death'.
-
HSA-MIR-346 , HSA-MIR-155 , HSA-MIR-10A , HSA-MIR-15B , HSA-MIR-196B , ...
-
10 genes correlated to 'AGE'.
-
HSA-MIR-34A , HSA-MIR-10B , HSA-MIR-320D-2 , HSA-MIR-10A , HSA-MIR-320B-2 , ...
-
31 genes correlated to 'HISTOLOGICAL.TYPE'.
-
HSA-MIR-1262 , HSA-MIR-3074 , HSA-MIR-186 , HSA-MIR-21 , HSA-MIR-23A , ...
-
No genes correlated to 'GENDER', 'KARNOFSKY.PERFORMANCE.SCORE', and 'RADIATIONS.RADIATION.REGIMENINDICATION'.
Complete statistical result table is provided in Supplement Table 1
Table 1. Get Full Table This table shows the clinical features, statistical methods used, and the number of genes that are significantly associated with each clinical feature at Q value < 0.05.
| Clinical feature | Statistical test | Significant genes | Associated with | Associated with | ||
|---|---|---|---|---|---|---|
| Time to Death | Cox regression test | N=11 | shorter survival | N=7 | longer survival | N=4 |
| AGE | Spearman correlation test | N=10 | older | N=8 | younger | N=2 |
| GENDER | t test | N=0 | ||||
| KARNOFSKY PERFORMANCE SCORE | Spearman correlation test | N=0 | ||||
| HISTOLOGICAL TYPE | ANOVA test | N=31 | ||||
| RADIATIONS RADIATION REGIMENINDICATION | t test | N=0 |
Table S1. Basic characteristics of clinical feature: 'Time to Death'
| Time to Death | Duration (Months) | 0-211.2 (median=14.5) |
| censored | N = 186 | |
| death | N = 54 | |
| Significant markers | N = 11 | |
| associated with shorter survival | 7 | |
| associated with longer survival | 4 |
Table S2. Get Full Table List of top 10 genes significantly associated with 'Time to Death' by Cox regression test
| HazardRatio | Wald_P | Q | C_index | |
|---|---|---|---|---|
| HSA-MIR-346 | 0.47 | 8.301e-12 | 4.5e-09 | 0.247 |
| HSA-MIR-155 | 1.9 | 4.757e-09 | 2.6e-06 | 0.763 |
| HSA-MIR-10A | 1.42 | 1.405e-08 | 7.6e-06 | 0.738 |
| HSA-MIR-15B | 1.72 | 2.549e-06 | 0.0014 | 0.782 |
| HSA-MIR-196B | 1.2 | 4.622e-06 | 0.0025 | 0.699 |
| HSA-MIR-23A | 1.85 | 2.354e-05 | 0.013 | 0.703 |
| HSA-MIR-9-1 | 0.37 | 4.368e-05 | 0.023 | 0.276 |
| HSA-MIR-9-2 | 0.37 | 4.411e-05 | 0.024 | 0.276 |
| HSA-MIR-767 | 0.73 | 6.499e-05 | 0.035 | 0.366 |
| HSA-MIR-21 | 1.39 | 8.024e-05 | 0.043 | 0.702 |
Figure S1. Get High-res Image As an example, this figure shows the association of HSA-MIR-346 to 'Time to Death'. four curves present the cumulative survival rates of 4 quartile subsets of patients. P value = 8.3e-12 with univariate Cox regression analysis using continuous log-2 expression values.
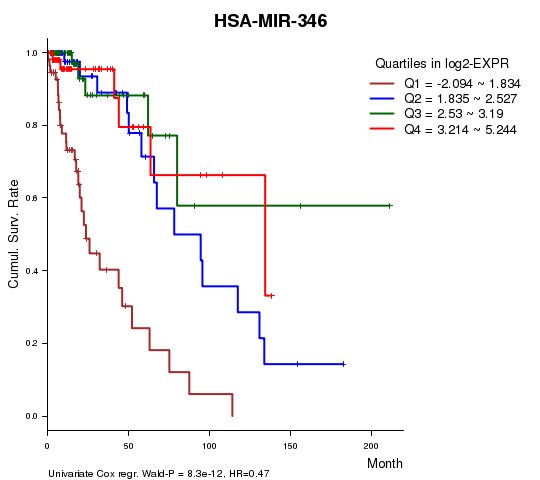
Table S3. Basic characteristics of clinical feature: 'AGE'
| AGE | Mean (SD) | 43.03 (13) |
| Significant markers | N = 10 | |
| pos. correlated | 8 | |
| neg. correlated | 2 |
Table S4. Get Full Table List of 10 genes significantly correlated to 'AGE' by Spearman correlation test
| SpearmanCorr | corrP | Q | |
|---|---|---|---|
| HSA-MIR-34A | 0.3174 | 5.098e-07 | 0.000276 |
| HSA-MIR-10B | 0.2817 | 9.391e-06 | 0.00508 |
| HSA-MIR-320D-2 | 0.3205 | 1.921e-05 | 0.0104 |
| HSA-MIR-10A | 0.2643 | 3.357e-05 | 0.0181 |
| HSA-MIR-320B-2 | 0.2594 | 4.741e-05 | 0.0255 |
| HSA-MIR-25 | 0.2558 | 6.088e-05 | 0.0327 |
| HSA-MIR-2115 | 0.2623 | 7.951e-05 | 0.0426 |
| HSA-MIR-146A | 0.2514 | 8.226e-05 | 0.044 |
| HSA-MIR-301A | -0.251 | 8.44e-05 | 0.0451 |
| HSA-MIR-383 | -0.2504 | 9.106e-05 | 0.0485 |
Figure S2. Get High-res Image As an example, this figure shows the association of HSA-MIR-34A to 'AGE'. P value = 5.1e-07 with Spearman correlation analysis. The straight line presents the best linear regression.
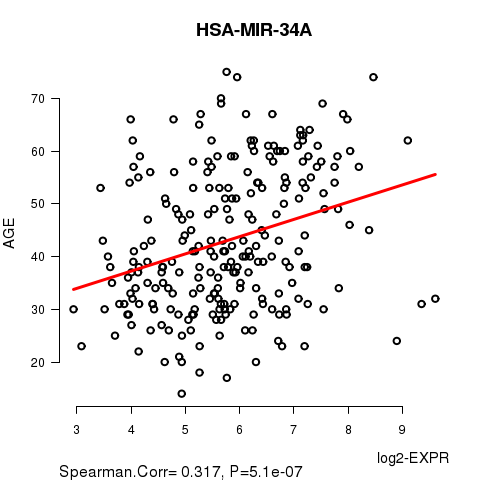
Table S5. Basic characteristics of clinical feature: 'GENDER'
| GENDER | Labels | N |
| FEMALE | 108 | |
| MALE | 132 | |
| Significant markers | N = 0 |
No gene related to 'KARNOFSKY.PERFORMANCE.SCORE'.
Table S6. Basic characteristics of clinical feature: 'KARNOFSKY.PERFORMANCE.SCORE'
| KARNOFSKY.PERFORMANCE.SCORE | Mean (SD) | 88.22 (10) |
| Significant markers | N = 0 |
Table S7. Basic characteristics of clinical feature: 'HISTOLOGICAL.TYPE'
| HISTOLOGICAL.TYPE | Labels | N |
| ASTROCYTOMA | 72 | |
| OLIGOASTROCYTOMA | 69 | |
| OLIGODENDROGLIOMA | 98 | |
| Significant markers | N = 31 |
Table S8. Get Full Table List of top 10 genes differentially expressed by 'HISTOLOGICAL.TYPE'
| ANOVA_P | Q | |
|---|---|---|
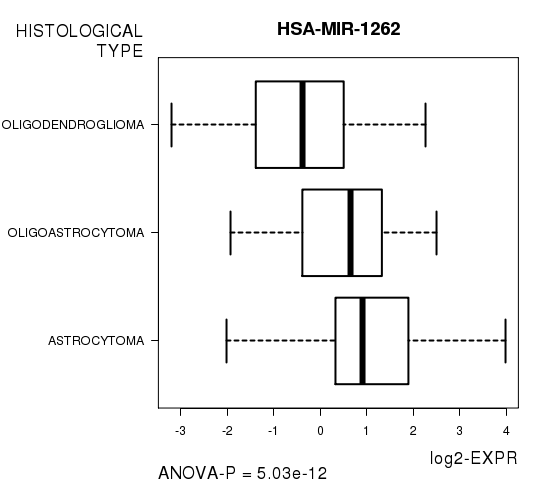
| HSA-MIR-1262 | 5.03e-12 | 2.73e-09 |
| HSA-MIR-3074 | 4.377e-10 | 2.37e-07 |
| HSA-MIR-186 | 1.302e-07 | 7.03e-05 |
| HSA-MIR-21 | 1.7e-07 | 9.16e-05 |
| HSA-MIR-23A | 2.092e-07 | 0.000113 |
| HSA-MIR-3065 | 4.834e-07 | 0.00026 |
| HSA-MIR-576 | 7.238e-07 | 0.000388 |
| HSA-MIR-455 | 7.32e-07 | 0.000392 |
| HSA-MIR-219-1 | 2.01e-06 | 0.00107 |
| HSA-MIR-592 | 2.501e-06 | 0.00133 |
Figure S3. Get High-res Image As an example, this figure shows the association of HSA-MIR-1262 to 'HISTOLOGICAL.TYPE'. P value = 5.03e-12 with ANOVA analysis.
No gene related to 'RADIATIONS.RADIATION.REGIMENINDICATION'.
Table S9. Basic characteristics of clinical feature: 'RADIATIONS.RADIATION.REGIMENINDICATION'
| RADIATIONS.RADIATION.REGIMENINDICATION | Labels | N |
| NO | 89 | |
| YES | 151 | |
| Significant markers | N = 0 |
-
Expresson data file = LGG-TP.miRseq_RPKM_log2.txt
-
Clinical data file = LGG-TP.clin.merged.picked.txt
-
Number of patients = 240
-
Number of genes = 542
-
Number of clinical features = 6
For survival clinical features, Wald's test in univariate Cox regression analysis with proportional hazards model (Andersen and Gill 1982) was used to estimate the P values using the 'coxph' function in R. Kaplan-Meier survival curves were plot using the four quartile subgroups of patients based on expression levels
For continuous numerical clinical features, Spearman's rank correlation coefficients (Spearman 1904) and two-tailed P values were estimated using 'cor.test' function in R
For two-class clinical features, two-tailed Student's t test with unequal variance (Lehmann and Romano 2005) was applied to compare the log2-expression levels between the two clinical classes using 't.test' function in R
For multi-class clinical features (ordinal or nominal), one-way analysis of variance (Howell 2002) was applied to compare the log2-expression levels between different clinical classes using 'anova' function in R
For multiple hypothesis correction, Q value is the False Discovery Rate (FDR) analogue of the P value (Benjamini and Hochberg 1995), defined as the minimum FDR at which the test may be called significant. We used the 'Benjamini and Hochberg' method of 'p.adjust' function in R to convert P values into Q values.
In addition to the links below, the full results of the analysis summarized in this report can also be downloaded programmatically using firehose_get, or interactively from either the Broad GDAC website or TCGA Data Coordination Center Portal.