This pipeline uses various statistical tests to identify genes whose promoter methylation levels correlated to selected clinical features.
Testing the association between 19657 genes and 8 clinical features across 107 samples, statistically thresholded by Q value < 0.05, 8 clinical features related to at least one genes.
-
3 genes correlated to 'Time to Death'.
-
E2F8 , C3ORF26 , FILIP1L
-
1 gene correlated to 'AGE'.
-
SHOX2
-
112 genes correlated to 'NEOPLASM.DISEASESTAGE'.
-
SEPSECS , SLC12A9 , DTD1 , AHR , C16ORF61 , ...
-
1 gene correlated to 'PATHOLOGY.T.STAGE'.
-
TPCN2
-
143 genes correlated to 'PATHOLOGY.N.STAGE'.
-
PTP4A3 , THBD , MSC , C19ORF45 , TSFM , ...
-
34 genes correlated to 'PATHOLOGY.M.STAGE'.
-
SEPSECS , SLC12A9 , DTD1 , KLHL7 , AHR , ...
-
9 genes correlated to 'GENDER'.
-
ALG11__2 , UTP14C , ALDH3A1 , ZNF35 , SLC22A11 , ...
-
14 genes correlated to 'COMPLETENESS.OF.RESECTION'.
-
SEPSECS , C5ORF42 , BIVM , KDELC1 , CCDC94 , ...
Complete statistical result table is provided in Supplement Table 1
Table 1. Get Full Table This table shows the clinical features, statistical methods used, and the number of genes that are significantly associated with each clinical feature at Q value < 0.05.
| Clinical feature | Statistical test | Significant genes | Associated with | Associated with | ||
|---|---|---|---|---|---|---|
| Time to Death | Cox regression test | N=3 | shorter survival | N=0 | longer survival | N=3 |
| AGE | Spearman correlation test | N=1 | older | N=1 | younger | N=0 |
| NEOPLASM DISEASESTAGE | ANOVA test | N=112 | ||||
| PATHOLOGY T STAGE | Spearman correlation test | N=1 | higher stage | N=1 | lower stage | N=0 |
| PATHOLOGY N STAGE | t test | N=143 | class1 | N=30 | class0 | N=113 |
| PATHOLOGY M STAGE | ANOVA test | N=34 | ||||
| GENDER | t test | N=9 | male | N=3 | female | N=6 |
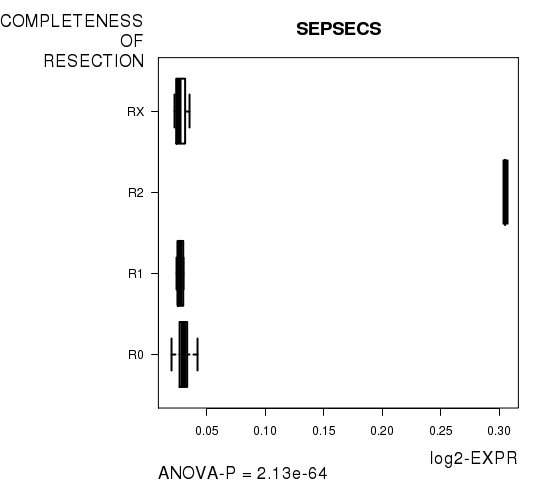
| COMPLETENESS OF RESECTION | ANOVA test | N=14 |
Table S1. Basic characteristics of clinical feature: 'Time to Death'
| Time to Death | Duration (Months) | 0-113 (median=14.4) |
| censored | N = 56 | |
| death | N = 47 | |
| Significant markers | N = 3 | |
| associated with shorter survival | 0 | |
| associated with longer survival | 3 |
Table S2. Get Full Table List of 3 genes significantly associated with 'Time to Death' by Cox regression test
| HazardRatio | Wald_P | Q | C_index | |
|---|---|---|---|---|
| E2F8 | 0 | 2.408e-06 | 0.047 | 0.353 |
| C3ORF26 | 0.02 | 2.43e-06 | 0.048 | 0.315 |
| FILIP1L | 0.02 | 2.43e-06 | 0.048 | 0.315 |
Figure S1. Get High-res Image As an example, this figure shows the association of E2F8 to 'Time to Death'. four curves present the cumulative survival rates of 4 quartile subsets of patients. P value = 2.41e-06 with univariate Cox regression analysis using continuous log-2 expression values.
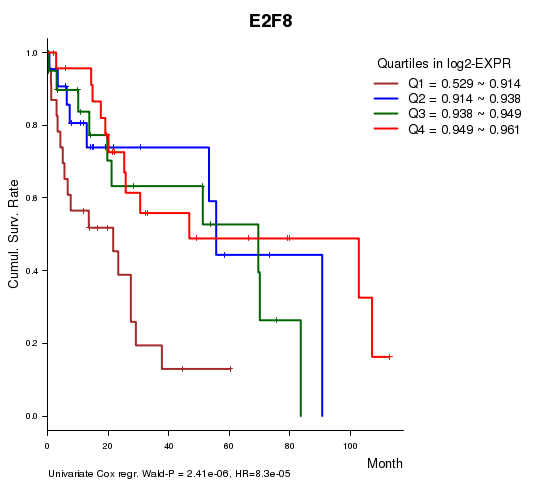
Table S3. Basic characteristics of clinical feature: 'AGE'
| AGE | Mean (SD) | 61.23 (14) |
| Significant markers | N = 1 | |
| pos. correlated | 1 | |
| neg. correlated | 0 |
Table S4. Get Full Table List of one gene significantly correlated to 'AGE' by Spearman correlation test
| SpearmanCorr | corrP | Q | |
|---|---|---|---|
| SHOX2 | 0.4451 | 1.966e-06 | 0.0386 |
Figure S2. Get High-res Image As an example, this figure shows the association of SHOX2 to 'AGE'. P value = 1.97e-06 with Spearman correlation analysis. The straight line presents the best linear regression.
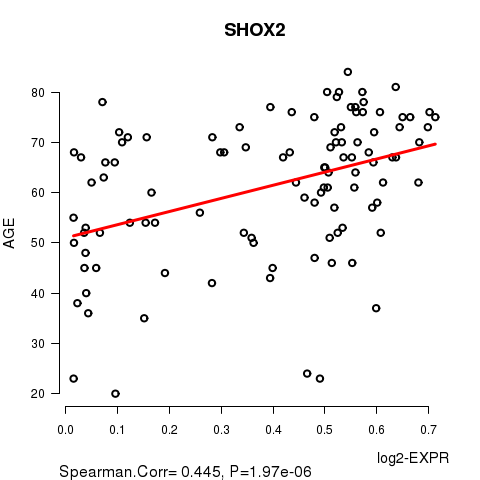
Table S5. Basic characteristics of clinical feature: 'NEOPLASM.DISEASESTAGE'
| NEOPLASM.DISEASESTAGE | Labels | N |
| STAGE I | 40 | |
| STAGE II | 23 | |
| STAGE III | 2 | |
| STAGE IIIA | 22 | |
| STAGE IIIB | 3 | |
| STAGE IIIC | 5 | |
| STAGE IV | 1 | |
| STAGE IVA | 1 | |
| STAGE IVB | 1 | |
| Significant markers | N = 112 |
Table S6. Get Full Table List of top 10 genes differentially expressed by 'NEOPLASM.DISEASESTAGE'
| ANOVA_P | Q | |
|---|---|---|
| SEPSECS | 1.863e-58 | 3.66e-54 |
| SLC12A9 | 7.725e-57 | 1.52e-52 |
| DTD1 | 1.948e-51 | 3.83e-47 |
| AHR | 2.425e-37 | 4.77e-33 |
| C16ORF61 | 8.378e-37 | 1.65e-32 |
| CENPN | 8.378e-37 | 1.65e-32 |
| SLC25A38 | 5.705e-36 | 1.12e-31 |
| KLHL7 | 5.267e-28 | 1.03e-23 |
| HSPB11 | 1.074e-24 | 2.11e-20 |
| LRRC42 | 1.074e-24 | 2.11e-20 |
Figure S3. Get High-res Image As an example, this figure shows the association of SEPSECS to 'NEOPLASM.DISEASESTAGE'. P value = 1.86e-58 with ANOVA analysis.

Table S7. Basic characteristics of clinical feature: 'PATHOLOGY.T.STAGE'
| PATHOLOGY.T.STAGE | Mean (SD) | 2.02 (0.99) |
| N | ||
| 1 | 43 | |
| 2 | 25 | |
| 3 | 31 | |
| 4 | 7 | |
| Significant markers | N = 1 | |
| pos. correlated | 1 | |
| neg. correlated | 0 |
Table S8. Get Full Table List of one gene significantly correlated to 'PATHOLOGY.T.STAGE' by Spearman correlation test
| SpearmanCorr | corrP | Q | |
|---|---|---|---|
| TPCN2 | 0.4792 | 2.032e-07 | 0.00399 |
Figure S4. Get High-res Image As an example, this figure shows the association of TPCN2 to 'PATHOLOGY.T.STAGE'. P value = 2.03e-07 with Spearman correlation analysis.
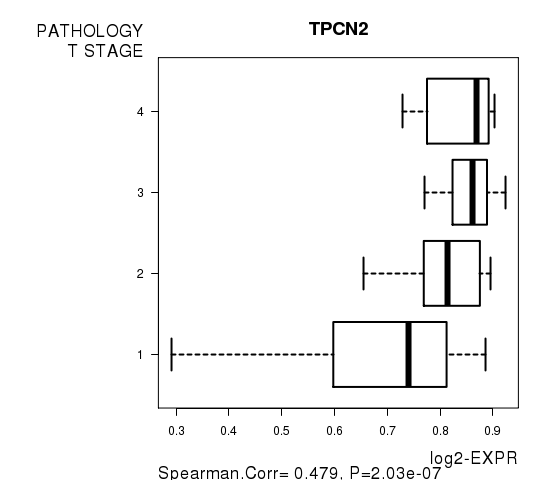
Table S9. Basic characteristics of clinical feature: 'PATHOLOGY.N.STAGE'
| PATHOLOGY.N.STAGE | Labels | N |
| class0 | 68 | |
| class1 | 3 | |
| Significant markers | N = 143 | |
| Higher in class1 | 30 | |
| Higher in class0 | 113 |
Table S10. Get Full Table List of top 10 genes differentially expressed by 'PATHOLOGY.N.STAGE'
| T(pos if higher in 'class1') | ttestP | Q | AUC | |
|---|---|---|---|---|
| PTP4A3 | -13.34 | 1.342e-18 | 2.64e-14 | 0.951 |
| THBD | -9.69 | 2.082e-14 | 4.09e-10 | 0.7843 |
| MSC | -9.59 | 2.814e-14 | 5.53e-10 | 0.8873 |
| C19ORF45 | -9.72 | 2.603e-13 | 5.11e-09 | 0.8775 |
| TSFM | -9.18 | 6.296e-13 | 1.24e-08 | 0.9853 |
| ZNF90 | -9.56 | 7.995e-13 | 1.57e-08 | 0.8529 |
| KLHL3 | -8.52 | 2.716e-12 | 5.34e-08 | 0.7696 |
| GRAMD1A | -8.28 | 6.406e-12 | 1.26e-07 | 0.7941 |
| CCNJ | -8.17 | 1.174e-11 | 2.31e-07 | 0.8137 |
| WDR17 | -8.19 | 1.899e-11 | 3.73e-07 | 0.8284 |
Figure S5. Get High-res Image As an example, this figure shows the association of PTP4A3 to 'PATHOLOGY.N.STAGE'. P value = 1.34e-18 with T-test analysis.
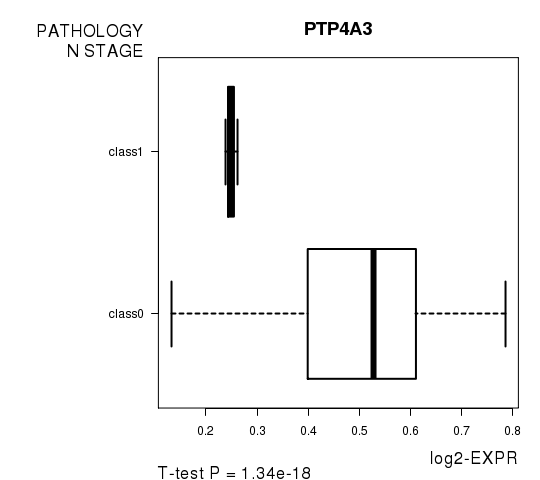
Table S11. Basic characteristics of clinical feature: 'PATHOLOGY.M.STAGE'
| PATHOLOGY.M.STAGE | Labels | N |
| M0 | 83 | |
| M1 | 2 | |
| MX | 22 | |
| Significant markers | N = 34 |
Table S12. Get Full Table List of top 10 genes differentially expressed by 'PATHOLOGY.M.STAGE'
| ANOVA_P | Q | |
|---|---|---|
| SEPSECS | 7.968e-18 | 1.57e-13 |
| SLC12A9 | 3.738e-16 | 7.35e-12 |
| DTD1 | 1.636e-14 | 3.22e-10 |
| KLHL7 | 2.866e-14 | 5.63e-10 |
| AHR | 3.98e-13 | 7.82e-09 |
| C16ORF61 | 1.005e-12 | 1.98e-08 |
| CENPN | 1.005e-12 | 1.98e-08 |
| HSPB11 | 5.833e-12 | 1.15e-07 |
| LRRC42 | 5.833e-12 | 1.15e-07 |
| ALG10B | 5.972e-11 | 1.17e-06 |
Figure S6. Get High-res Image As an example, this figure shows the association of SEPSECS to 'PATHOLOGY.M.STAGE'. P value = 7.97e-18 with ANOVA analysis.
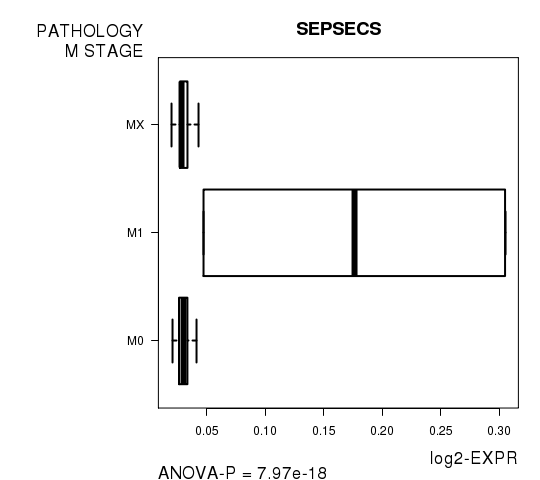
Table S13. Basic characteristics of clinical feature: 'GENDER'
| GENDER | Labels | N |
| FEMALE | 42 | |
| MALE | 65 | |
| Significant markers | N = 9 | |
| Higher in MALE | 3 | |
| Higher in FEMALE | 6 |
Table S14. Get Full Table List of 9 genes differentially expressed by 'GENDER'
| T(pos if higher in 'MALE') | ttestP | Q | AUC | |
|---|---|---|---|---|
| ALG11__2 | 10.85 | 2.313e-14 | 4.55e-10 | 0.9443 |
| UTP14C | 10.85 | 2.313e-14 | 4.55e-10 | 0.9443 |
| ALDH3A1 | -6.46 | 3.8e-09 | 7.47e-05 | 0.7894 |
| ZNF35 | 5.39 | 4.674e-07 | 0.00919 | 0.7557 |
| SLC22A11 | -5.38 | 5.537e-07 | 0.0109 | 0.7271 |
| MAP3K8 | -5.3 | 7.679e-07 | 0.0151 | 0.7711 |
| TINAG | -5.08 | 1.687e-06 | 0.0332 | 0.741 |
| FAM83A | -5.11 | 1.795e-06 | 0.0353 | 0.7641 |
| LOC100131726 | -5.11 | 1.795e-06 | 0.0353 | 0.7641 |
Figure S7. Get High-res Image As an example, this figure shows the association of ALG11__2 to 'GENDER'. P value = 2.31e-14 with T-test analysis.
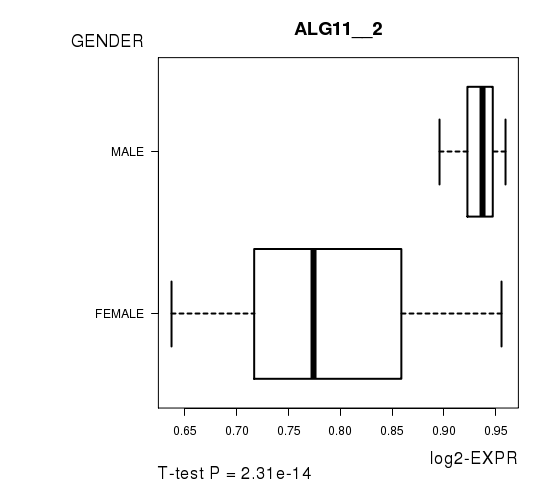
Table S15. Basic characteristics of clinical feature: 'COMPLETENESS.OF.RESECTION'
| COMPLETENESS.OF.RESECTION | Labels | N |
| R0 | 86 | |
| R1 | 6 | |
| R2 | 1 | |
| RX | 9 | |
| Significant markers | N = 14 |
Table S16. Get Full Table List of top 10 genes differentially expressed by 'COMPLETENESS.OF.RESECTION'
| ANOVA_P | Q | |
|---|---|---|
| SEPSECS | 2.133e-64 | 4.19e-60 |
| C5ORF42 | 5.531e-24 | 1.09e-19 |
| BIVM | 2.029e-19 | 3.99e-15 |
| KDELC1 | 2.029e-19 | 3.99e-15 |
| CCDC94 | 4.319e-19 | 8.49e-15 |
| ZNF540 | 2.824e-13 | 5.55e-09 |
| ZNF571 | 2.824e-13 | 5.55e-09 |
| C1ORF101 | 1.627e-07 | 0.0032 |
| CAMLG | 4.432e-07 | 0.00871 |
| ZBTB7C | 1.847e-06 | 0.0363 |
Figure S8. Get High-res Image As an example, this figure shows the association of SEPSECS to 'COMPLETENESS.OF.RESECTION'. P value = 2.13e-64 with ANOVA analysis.
-
Expresson data file = LIHC-TP.meth.by_min_expr_corr.data.txt
-
Clinical data file = LIHC-TP.clin.merged.picked.txt
-
Number of patients = 107
-
Number of genes = 19657
-
Number of clinical features = 8
For survival clinical features, Wald's test in univariate Cox regression analysis with proportional hazards model (Andersen and Gill 1982) was used to estimate the P values using the 'coxph' function in R. Kaplan-Meier survival curves were plot using the four quartile subgroups of patients based on expression levels
For continuous numerical clinical features, Spearman's rank correlation coefficients (Spearman 1904) and two-tailed P values were estimated using 'cor.test' function in R
For multi-class clinical features (ordinal or nominal), one-way analysis of variance (Howell 2002) was applied to compare the log2-expression levels between different clinical classes using 'anova' function in R
For two-class clinical features, two-tailed Student's t test with unequal variance (Lehmann and Romano 2005) was applied to compare the log2-expression levels between the two clinical classes using 't.test' function in R
For multiple hypothesis correction, Q value is the False Discovery Rate (FDR) analogue of the P value (Benjamini and Hochberg 1995), defined as the minimum FDR at which the test may be called significant. We used the 'Benjamini and Hochberg' method of 'p.adjust' function in R to convert P values into Q values.
In addition to the links below, the full results of the analysis summarized in this report can also be downloaded programmatically using firehose_get, or interactively from either the Broad GDAC website or TCGA Data Coordination Center Portal.