This pipeline uses various statistical tests to identify mRNAs whose expression levels correlated to selected clinical features.
Testing the association between 17758 genes and 8 clinical features across 115 samples, statistically thresholded by Q value < 0.05, 7 clinical features related to at least one genes.
-
1 gene correlated to 'AGE'.
-
PMS2L2|5380
-
3 genes correlated to 'NEOPLASM.DISEASESTAGE'.
-
THNSL2|55258 , KCNT1|57582 , LOC399815|399815
-
5 genes correlated to 'PATHOLOGY.T.STAGE'.
-
TFAP2A|7020 , RNF123|63891 , POLA2|23649 , CARKD|55739 , RBPJ|3516
-
32 genes correlated to 'PATHOLOGY.N.STAGE'.
-
PI4KAP2|375133 , WARS2|10352 , AGPAT2|10555 , PRSS35|167681 , SFRS6|6431 , ...
-
1 gene correlated to 'PATHOLOGY.M.STAGE'.
-
KCNT1|57582
-
32 genes correlated to 'GENDER'.
-
XIST|7503 , ZFY|7544 , RPS4Y1|6192 , TSIX|9383 , PRKY|5616 , ...
-
1 gene correlated to 'COMPLETENESS.OF.RESECTION'.
-
PGA5|5222
-
No genes correlated to 'Time to Death'
Complete statistical result table is provided in Supplement Table 1
Table 1. Get Full Table This table shows the clinical features, statistical methods used, and the number of genes that are significantly associated with each clinical feature at Q value < 0.05.
| Clinical feature | Statistical test | Significant genes | Associated with | Associated with | ||
|---|---|---|---|---|---|---|
| Time to Death | Cox regression test | N=0 | ||||
| AGE | Spearman correlation test | N=1 | older | N=1 | younger | N=0 |
| NEOPLASM DISEASESTAGE | ANOVA test | N=3 | ||||
| PATHOLOGY T STAGE | Spearman correlation test | N=5 | higher stage | N=3 | lower stage | N=2 |
| PATHOLOGY N STAGE | t test | N=32 | class1 | N=23 | class0 | N=9 |
| PATHOLOGY M STAGE | ANOVA test | N=1 | ||||
| GENDER | t test | N=32 | male | N=18 | female | N=14 |
| COMPLETENESS OF RESECTION | ANOVA test | N=1 |
Table S1. Basic characteristics of clinical feature: 'Time to Death'
| Time to Death | Duration (Months) | 0-113 (median=14.9) |
| censored | N = 61 | |
| death | N = 51 | |
| Significant markers | N = 0 |
Table S2. Basic characteristics of clinical feature: 'AGE'
| AGE | Mean (SD) | 61.51 (14) |
| Significant markers | N = 1 | |
| pos. correlated | 1 | |
| neg. correlated | 0 |
Table S3. Get Full Table List of one gene significantly correlated to 'AGE' by Spearman correlation test
| SpearmanCorr | corrP | Q | |
|---|---|---|---|
| PMS2L2|5380 | 0.4249 | 2.715e-06 | 0.0482 |
Figure S1. Get High-res Image As an example, this figure shows the association of PMS2L2|5380 to 'AGE'. P value = 2.71e-06 with Spearman correlation analysis. The straight line presents the best linear regression.
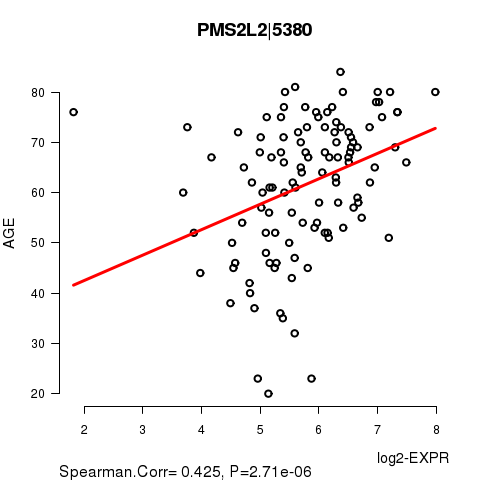
Table S4. Basic characteristics of clinical feature: 'NEOPLASM.DISEASESTAGE'
| NEOPLASM.DISEASESTAGE | Labels | N |
| STAGE I | 43 | |
| STAGE II | 25 | |
| STAGE III | 2 | |
| STAGE IIIA | 25 | |
| STAGE IIIB | 2 | |
| STAGE IIIC | 5 | |
| STAGE IV | 1 | |
| STAGE IVA | 1 | |
| STAGE IVB | 1 | |
| Significant markers | N = 3 |
Table S5. Get Full Table List of 3 genes differentially expressed by 'NEOPLASM.DISEASESTAGE'
| ANOVA_P | Q | |
|---|---|---|
| THNSL2|55258 | 1.577e-08 | 0.00028 |
| KCNT1|57582 | 1.764e-08 | 0.000313 |
| LOC399815|399815 | 1.988e-06 | 0.0353 |
Figure S2. Get High-res Image As an example, this figure shows the association of THNSL2|55258 to 'NEOPLASM.DISEASESTAGE'. P value = 1.58e-08 with ANOVA analysis.

Table S6. Basic characteristics of clinical feature: 'PATHOLOGY.T.STAGE'
| PATHOLOGY.T.STAGE | Mean (SD) | 2.01 (0.97) |
| N | ||
| 1 | 46 | |
| 2 | 28 | |
| 3 | 33 | |
| 4 | 7 | |
| Significant markers | N = 5 | |
| pos. correlated | 3 | |
| neg. correlated | 2 |
Table S7. Get Full Table List of 5 genes significantly correlated to 'PATHOLOGY.T.STAGE' by Spearman correlation test
| SpearmanCorr | corrP | Q | |
|---|---|---|---|
| TFAP2A|7020 | 0.4561 | 5.504e-07 | 0.00977 |
| RNF123|63891 | -0.4383 | 1.073e-06 | 0.019 |
| POLA2|23649 | 0.4353 | 1.299e-06 | 0.0231 |
| CARKD|55739 | -0.4244 | 2.532e-06 | 0.045 |
| RBPJ|3516 | 0.4232 | 2.714e-06 | 0.0482 |
Figure S3. Get High-res Image As an example, this figure shows the association of TFAP2A|7020 to 'PATHOLOGY.T.STAGE'. P value = 5.5e-07 with Spearman correlation analysis.
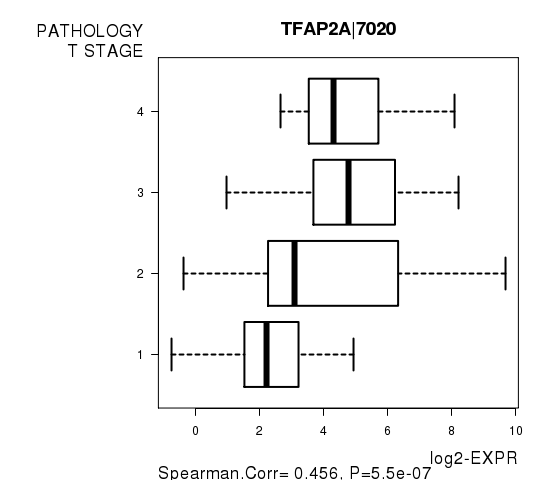
Table S8. Basic characteristics of clinical feature: 'PATHOLOGY.N.STAGE'
| PATHOLOGY.N.STAGE | Labels | N |
| class0 | 73 | |
| class1 | 3 | |
| Significant markers | N = 32 | |
| Higher in class1 | 23 | |
| Higher in class0 | 9 |
Table S9. Get Full Table List of top 10 genes differentially expressed by 'PATHOLOGY.N.STAGE'
| T(pos if higher in 'class1') | ttestP | Q | AUC | |
|---|---|---|---|---|
| PI4KAP2|375133 | 8.83 | 1.598e-10 | 2.54e-06 | 0.8995 |
| WARS2|10352 | 8.95 | 3.243e-10 | 5.16e-06 | 0.9132 |
| AGPAT2|10555 | 7.1 | 6.399e-10 | 1.02e-05 | 0.8082 |
| PRSS35|167681 | -7.33 | 3.03e-09 | 4.83e-05 | 0.8545 |
| SFRS6|6431 | 7.04 | 7.369e-09 | 0.000117 | 0.7991 |
| ATP5F1|515 | 6.42 | 1.409e-08 | 0.000224 | 0.7854 |
| WNT5A|7474 | 6.76 | 1.501e-08 | 0.000239 | 0.7991 |
| STAB2|55576 | -6.63 | 2.319e-08 | 0.000369 | 0.7814 |
| ARMCX3|51566 | 6.68 | 2.827e-08 | 0.00045 | 0.7717 |
| CYTH4|27128 | 6.04 | 5.752e-08 | 0.000915 | 0.8037 |
Figure S4. Get High-res Image As an example, this figure shows the association of PI4KAP2|375133 to 'PATHOLOGY.N.STAGE'. P value = 1.6e-10 with T-test analysis.
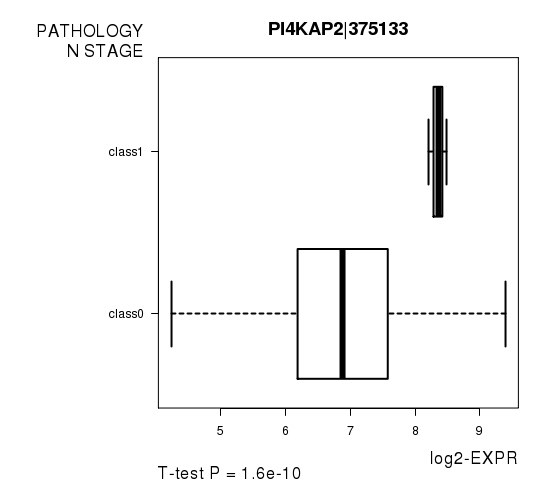
Table S10. Basic characteristics of clinical feature: 'PATHOLOGY.M.STAGE'
| PATHOLOGY.M.STAGE | Labels | N |
| M0 | 88 | |
| M1 | 2 | |
| MX | 25 | |
| Significant markers | N = 1 |
Table S11. Get Full Table List of one gene differentially expressed by 'PATHOLOGY.M.STAGE'
| ANOVA_P | Q | |
|---|---|---|
| KCNT1|57582 | 7.998e-11 | 1.42e-06 |
Figure S5. Get High-res Image As an example, this figure shows the association of KCNT1|57582 to 'PATHOLOGY.M.STAGE'. P value = 8e-11 with ANOVA analysis.

Table S12. Basic characteristics of clinical feature: 'GENDER'
| GENDER | Labels | N |
| FEMALE | 44 | |
| MALE | 71 | |
| Significant markers | N = 32 | |
| Higher in MALE | 18 | |
| Higher in FEMALE | 14 |
Table S13. Get Full Table List of top 10 genes differentially expressed by 'GENDER'
| T(pos if higher in 'MALE') | ttestP | Q | AUC | |
|---|---|---|---|---|
| XIST|7503 | -13.76 | 2.615e-23 | 4.64e-19 | 0.9662 |
| ZFY|7544 | 21.02 | 7e-20 | 1.24e-15 | 0.9947 |
| RPS4Y1|6192 | 21.92 | 2.007e-19 | 3.56e-15 | 0.996 |
| TSIX|9383 | -12.15 | 6.692e-17 | 1.19e-12 | 0.9671 |
| PRKY|5616 | 15.75 | 1.706e-15 | 3.03e-11 | 0.9927 |
| DDX3Y|8653 | 18.92 | 1.447e-13 | 2.57e-09 | 0.9982 |
| NLGN4Y|22829 | 13.8 | 3.923e-13 | 6.96e-09 | 0.985 |
| KDM5D|8284 | 17.08 | 3.441e-12 | 6.11e-08 | 0.996 |
| KDM5C|8242 | -6.74 | 1.099e-09 | 1.95e-05 | 0.8182 |
| BMP8B|656 | -6.37 | 9.276e-09 | 0.000165 | 0.8075 |
Figure S6. Get High-res Image As an example, this figure shows the association of XIST|7503 to 'GENDER'. P value = 2.62e-23 with T-test analysis.
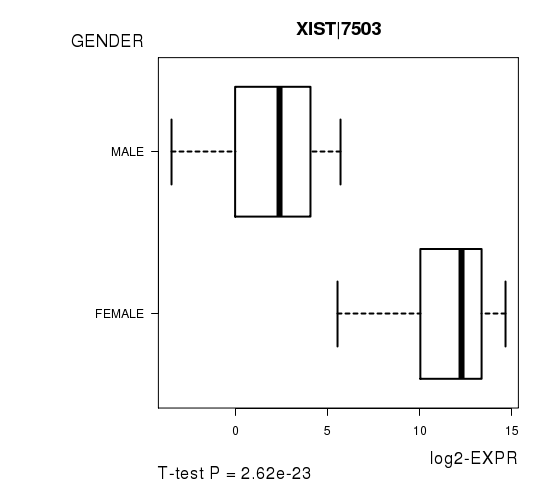
Table S14. Basic characteristics of clinical feature: 'COMPLETENESS.OF.RESECTION'
| COMPLETENESS.OF.RESECTION | Labels | N |
| R0 | 91 | |
| R1 | 10 | |
| R2 | 1 | |
| RX | 8 | |
| Significant markers | N = 1 |
Table S15. Get Full Table List of one gene differentially expressed by 'COMPLETENESS.OF.RESECTION'
| ANOVA_P | Q | |
|---|---|---|
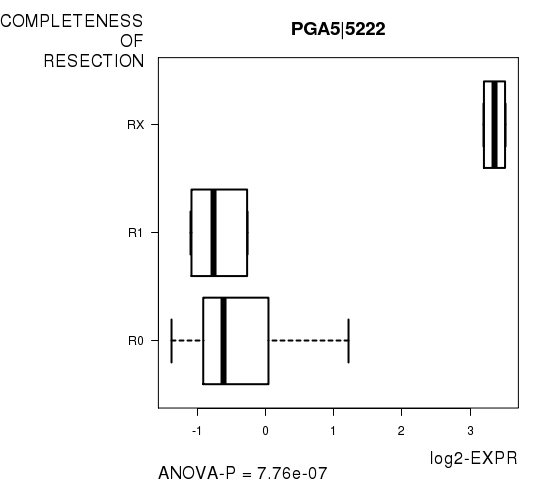
| PGA5|5222 | 7.76e-07 | 0.0138 |
Figure S7. Get High-res Image As an example, this figure shows the association of PGA5|5222 to 'COMPLETENESS.OF.RESECTION'. P value = 7.76e-07 with ANOVA analysis.
-
Expresson data file = LIHC-TP.uncv2.mRNAseq_RSEM_normalized_log2.txt
-
Clinical data file = LIHC-TP.clin.merged.picked.txt
-
Number of patients = 115
-
Number of genes = 17758
-
Number of clinical features = 8
For survival clinical features, Wald's test in univariate Cox regression analysis with proportional hazards model (Andersen and Gill 1982) was used to estimate the P values using the 'coxph' function in R. Kaplan-Meier survival curves were plot using the four quartile subgroups of patients based on expression levels
For continuous numerical clinical features, Spearman's rank correlation coefficients (Spearman 1904) and two-tailed P values were estimated using 'cor.test' function in R
For multi-class clinical features (ordinal or nominal), one-way analysis of variance (Howell 2002) was applied to compare the log2-expression levels between different clinical classes using 'anova' function in R
For two-class clinical features, two-tailed Student's t test with unequal variance (Lehmann and Romano 2005) was applied to compare the log2-expression levels between the two clinical classes using 't.test' function in R
For multiple hypothesis correction, Q value is the False Discovery Rate (FDR) analogue of the P value (Benjamini and Hochberg 1995), defined as the minimum FDR at which the test may be called significant. We used the 'Benjamini and Hochberg' method of 'p.adjust' function in R to convert P values into Q values.
In addition to the links below, the full results of the analysis summarized in this report can also be downloaded programmatically using firehose_get, or interactively from either the Broad GDAC website or TCGA Data Coordination Center Portal.