This pipeline uses various statistical tests to identify RPPAs whose expression levels correlated to selected clinical features.
Testing the association between 165 genes and 5 clinical features across 407 samples, statistically thresholded by Q value < 0.05, 3 clinical features related to at least one genes.
-
2 genes correlated to 'Time to Death'.
-
MAPK1 MAPK3|MAPK_PT202_Y204-R-V , MAP2K1|MEK1_PS217_S221-R-V
-
4 genes correlated to 'AGE'.
-
PGR|PR-R-V , ESR1|ER-ALPHA-R-V , ERBB2|HER2-M-V , ERBB2|HER2_PY1248-R-V
-
1 gene correlated to 'COMPLETENESS.OF.RESECTION'.
-
MET|C-MET-M-C
-
No genes correlated to 'PRIMARY.SITE.OF.DISEASE', and 'KARNOFSKY.PERFORMANCE.SCORE'.
Complete statistical result table is provided in Supplement Table 1
Table 1. Get Full Table This table shows the clinical features, statistical methods used, and the number of genes that are significantly associated with each clinical feature at Q value < 0.05.
| Clinical feature | Statistical test | Significant genes | Associated with | Associated with | ||
|---|---|---|---|---|---|---|
| Time to Death | Cox regression test | N=2 | shorter survival | N=2 | longer survival | N=0 |
| AGE | Spearman correlation test | N=4 | older | N=3 | younger | N=1 |
| PRIMARY SITE OF DISEASE | ANOVA test | N=0 | ||||
| KARNOFSKY PERFORMANCE SCORE | Spearman correlation test | N=0 | ||||
| COMPLETENESS OF RESECTION | ANOVA test | N=1 |
Table S1. Basic characteristics of clinical feature: 'Time to Death'
| Time to Death | Duration (Months) | 0.3-180.2 (median=28.5) |
| censored | N = 189 | |
| death | N = 212 | |
| Significant markers | N = 2 | |
| associated with shorter survival | 2 | |
| associated with longer survival | 0 |
Table S2. Get Full Table List of 2 genes significantly associated with 'Time to Death' by Cox regression test
| HazardRatio | Wald_P | Q | C_index | |
|---|---|---|---|---|
| MAPK1 MAPK3|MAPK_PT202_Y204-R-V | 1.27 | 0.0001224 | 0.02 | 0.574 |
| MAP2K1|MEK1_PS217_S221-R-V | 1.9 | 0.0001462 | 0.024 | 0.58 |
Figure S1. Get High-res Image As an example, this figure shows the association of MAPK1 MAPK3|MAPK_PT202_Y204-R-V to 'Time to Death'. four curves present the cumulative survival rates of 4 quartile subsets of patients. P value = 0.000122 with univariate Cox regression analysis using continuous log-2 expression values.
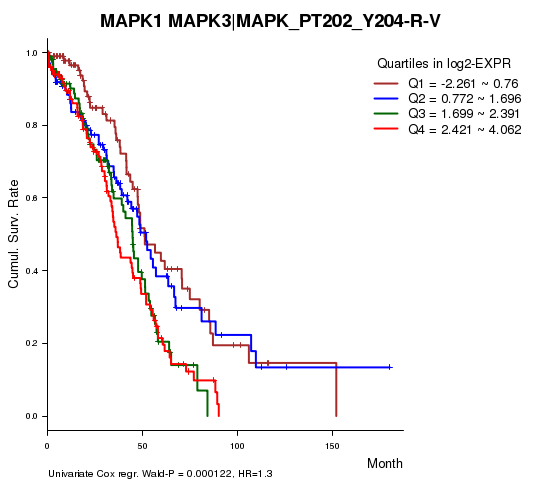
Table S3. Basic characteristics of clinical feature: 'AGE'
| AGE | Mean (SD) | 59.67 (12) |
| Significant markers | N = 4 | |
| pos. correlated | 3 | |
| neg. correlated | 1 |
Table S4. Get Full Table List of 4 genes significantly correlated to 'AGE' by Spearman correlation test
| SpearmanCorr | corrP | Q | |
|---|---|---|---|
| PGR|PR-R-V | -0.1954 | 8.394e-05 | 0.0139 |
| ESR1|ER-ALPHA-R-V | 0.1902 | 0.0001296 | 0.0213 |
| ERBB2|HER2-M-V | 0.1876 | 0.0001607 | 0.0262 |
| ERBB2|HER2_PY1248-R-V | 0.1816 | 0.0002611 | 0.0423 |
Figure S2. Get High-res Image As an example, this figure shows the association of PGR|PR-R-V to 'AGE'. P value = 8.39e-05 with Spearman correlation analysis. The straight line presents the best linear regression.
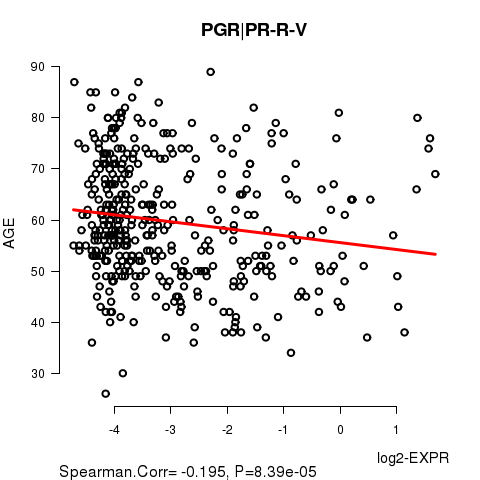
Table S5. Basic characteristics of clinical feature: 'PRIMARY.SITE.OF.DISEASE'
| PRIMARY.SITE.OF.DISEASE | Labels | N |
| OMENTUM | 2 | |
| OVARY | 403 | |
| PERITONEUM OVARY | 2 | |
| Significant markers | N = 0 |
No gene related to 'KARNOFSKY.PERFORMANCE.SCORE'.
Table S6. Basic characteristics of clinical feature: 'KARNOFSKY.PERFORMANCE.SCORE'
| KARNOFSKY.PERFORMANCE.SCORE | Mean (SD) | 74.9 (12) |
| Score | N | |
| 40 | 1 | |
| 60 | 14 | |
| 80 | 33 | |
| 100 | 3 | |
| Significant markers | N = 0 |
Table S7. Basic characteristics of clinical feature: 'COMPLETENESS.OF.RESECTION'
| COMPLETENESS.OF.RESECTION | Labels | N |
| R0 | 13 | |
| R1 | 28 | |
| R2 | 2 | |
| Significant markers | N = 1 |
Table S8. Get Full Table List of one gene differentially expressed by 'COMPLETENESS.OF.RESECTION'
| ANOVA_P | Q | |
|---|---|---|
| MET|C-MET-M-C | 9.338e-05 | 0.0154 |
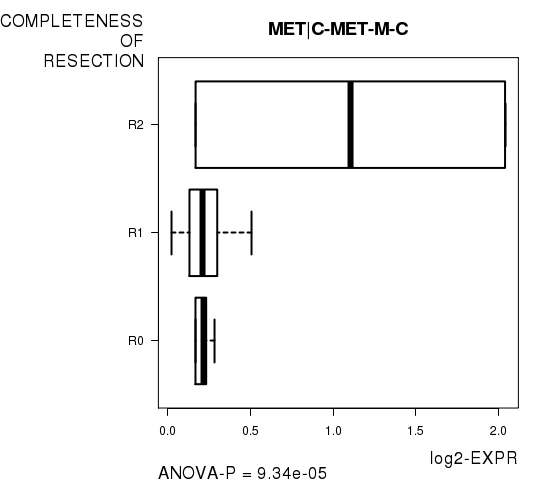
Figure S3. Get High-res Image As an example, this figure shows the association of MET|C-MET-M-C to 'COMPLETENESS.OF.RESECTION'. P value = 9.34e-05 with ANOVA analysis.
-
Expresson data file = OV-TP.rppa.txt
-
Clinical data file = OV-TP.clin.merged.picked.txt
-
Number of patients = 407
-
Number of genes = 165
-
Number of clinical features = 5
For survival clinical features, Wald's test in univariate Cox regression analysis with proportional hazards model (Andersen and Gill 1982) was used to estimate the P values using the 'coxph' function in R. Kaplan-Meier survival curves were plot using the four quartile subgroups of patients based on expression levels
For continuous numerical clinical features, Spearman's rank correlation coefficients (Spearman 1904) and two-tailed P values were estimated using 'cor.test' function in R
For multi-class clinical features (ordinal or nominal), one-way analysis of variance (Howell 2002) was applied to compare the log2-expression levels between different clinical classes using 'anova' function in R
For multiple hypothesis correction, Q value is the False Discovery Rate (FDR) analogue of the P value (Benjamini and Hochberg 1995), defined as the minimum FDR at which the test may be called significant. We used the 'Benjamini and Hochberg' method of 'p.adjust' function in R to convert P values into Q values.
In addition to the links below, the full results of the analysis summarized in this report can also be downloaded programmatically using firehose_get, or interactively from either the Broad GDAC website or TCGA Data Coordination Center Portal.