This pipeline uses various statistical tests to identify genes whose promoter methylation levels correlated to selected clinical features.
Testing the association between 20008 genes and 5 clinical features across 162 samples, statistically thresholded by Q value < 0.05, 3 clinical features related to at least one genes.
-
1 gene correlated to 'AGE'.
-
LYNX1
-
15 genes correlated to 'PATHOLOGY.N.STAGE'.
-
DYRK2 , DLEU2__2 , CCL2 , TDRKH , KCNJ2 , ...
-
7 genes correlated to 'COMPLETENESS.OF.RESECTION'.
-
CTNNA3__1 , LRRTM3__1 , CTNNA3 , LRRTM3 , AKR1B10 , ...
-
No genes correlated to 'PATHOLOGY.T.STAGE', and 'NUMBER.OF.LYMPH.NODES'.
Complete statistical result table is provided in Supplement Table 1
Table 1. Get Full Table This table shows the clinical features, statistical methods used, and the number of genes that are significantly associated with each clinical feature at Q value < 0.05.
| Clinical feature | Statistical test | Significant genes | Associated with | Associated with | ||
|---|---|---|---|---|---|---|
| AGE | Spearman correlation test | N=1 | older | N=1 | younger | N=0 |
| PATHOLOGY T STAGE | Spearman correlation test | N=0 | ||||
| PATHOLOGY N STAGE | t test | N=15 | class1 | N=0 | class0 | N=15 |
| COMPLETENESS OF RESECTION | ANOVA test | N=7 | ||||
| NUMBER OF LYMPH NODES | Spearman correlation test | N=0 |
Table S1. Basic characteristics of clinical feature: 'AGE'
| AGE | Mean (SD) | 60.04 (6.8) |
| Significant markers | N = 1 | |
| pos. correlated | 1 | |
| neg. correlated | 0 |
Table S2. Get Full Table List of one gene significantly correlated to 'AGE' by Spearman correlation test
| SpearmanCorr | corrP | Q | |
|---|---|---|---|
| LYNX1 | 0.3624 | 2.313e-06 | 0.0463 |
Figure S1. Get High-res Image As an example, this figure shows the association of LYNX1 to 'AGE'. P value = 2.31e-06 with Spearman correlation analysis. The straight line presents the best linear regression.
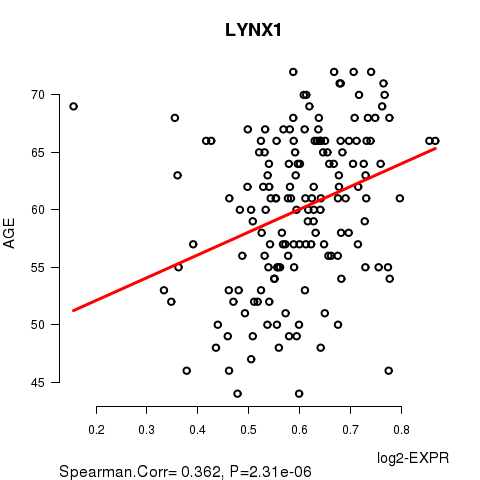
Table S3. Basic characteristics of clinical feature: 'PATHOLOGY.T.STAGE'
| PATHOLOGY.T.STAGE | Mean (SD) | 2.61 (0.55) |
| N | ||
| 2 | 68 | |
| 3 | 88 | |
| 4 | 5 | |
| Significant markers | N = 0 |
Table S4. Basic characteristics of clinical feature: 'PATHOLOGY.N.STAGE'
| PATHOLOGY.N.STAGE | Labels | N |
| class0 | 128 | |
| class1 | 15 | |
| Significant markers | N = 15 | |
| Higher in class1 | 0 | |
| Higher in class0 | 15 |
Table S5. Get Full Table List of top 10 genes differentially expressed by 'PATHOLOGY.N.STAGE'
| T(pos if higher in 'class1') | ttestP | Q | AUC | |
|---|---|---|---|---|
| DYRK2 | -6.8 | 3.481e-09 | 6.96e-05 | 0.7432 |
| DLEU2__2 | -6.19 | 6.253e-08 | 0.00125 | 0.8177 |
| CCL2 | -6.08 | 7.085e-08 | 0.00142 | 0.8333 |
| TDRKH | -5.68 | 1.115e-07 | 0.00223 | 0.7054 |
| KCNJ2 | -5.59 | 1.283e-07 | 0.00257 | 0.7307 |
| RRM2 | -5.79 | 3.398e-07 | 0.0068 | 0.7583 |
| NUP54 | -5.28 | 8.503e-07 | 0.017 | 0.6745 |
| DDX21 | -5.26 | 8.622e-07 | 0.0172 | 0.7172 |
| ABCE1 | -5.6 | 1.092e-06 | 0.0218 | 0.7635 |
| ANAPC10 | -5.6 | 1.092e-06 | 0.0218 | 0.7635 |
Figure S2. Get High-res Image As an example, this figure shows the association of DYRK2 to 'PATHOLOGY.N.STAGE'. P value = 3.48e-09 with T-test analysis.
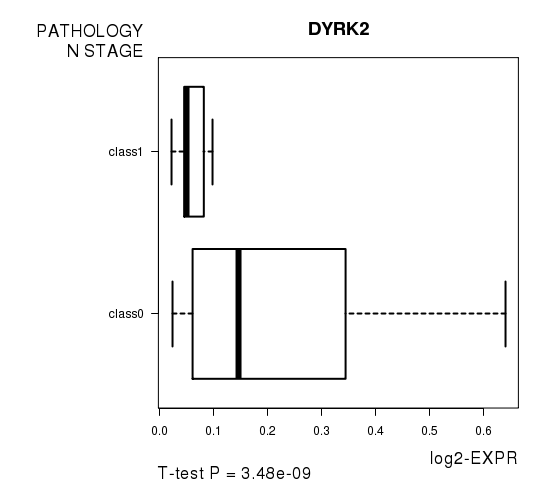
Table S6. Basic characteristics of clinical feature: 'COMPLETENESS.OF.RESECTION'
| COMPLETENESS.OF.RESECTION | Labels | N |
| R0 | 119 | |
| R1 | 31 | |
| RX | 3 | |
| Significant markers | N = 7 |
Table S7. Get Full Table List of 7 genes differentially expressed by 'COMPLETENESS.OF.RESECTION'
| ANOVA_P | Q | |
|---|---|---|
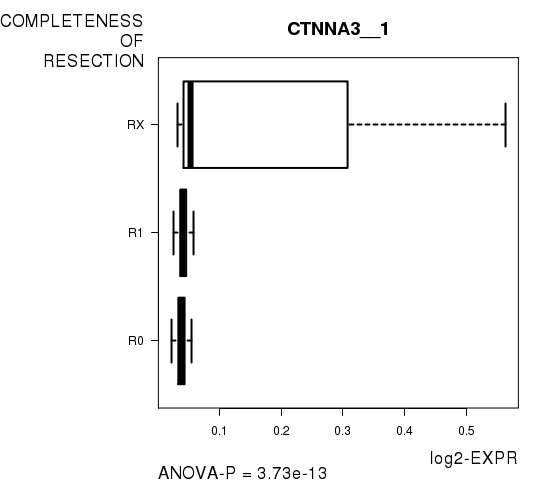
| CTNNA3__1 | 3.73e-13 | 7.46e-09 |
| LRRTM3__1 | 3.73e-13 | 7.46e-09 |
| CTNNA3 | 8.428e-13 | 1.69e-08 |
| LRRTM3 | 8.428e-13 | 1.69e-08 |
| AKR1B10 | 2.937e-09 | 5.87e-05 |
| CAPN3 | 6.627e-07 | 0.0133 |
| ZNF814 | 1.515e-06 | 0.0303 |
Figure S3. Get High-res Image As an example, this figure shows the association of CTNNA3__1 to 'COMPLETENESS.OF.RESECTION'. P value = 3.73e-13 with ANOVA analysis.
-
Expresson data file = PRAD-TP.meth.by_min_expr_corr.data.txt
-
Clinical data file = PRAD-TP.clin.merged.picked.txt
-
Number of patients = 162
-
Number of genes = 20008
-
Number of clinical features = 5
For continuous numerical clinical features, Spearman's rank correlation coefficients (Spearman 1904) and two-tailed P values were estimated using 'cor.test' function in R
For two-class clinical features, two-tailed Student's t test with unequal variance (Lehmann and Romano 2005) was applied to compare the log2-expression levels between the two clinical classes using 't.test' function in R
For multi-class clinical features (ordinal or nominal), one-way analysis of variance (Howell 2002) was applied to compare the log2-expression levels between different clinical classes using 'anova' function in R
For multiple hypothesis correction, Q value is the False Discovery Rate (FDR) analogue of the P value (Benjamini and Hochberg 1995), defined as the minimum FDR at which the test may be called significant. We used the 'Benjamini and Hochberg' method of 'p.adjust' function in R to convert P values into Q values.
In addition to the links below, the full results of the analysis summarized in this report can also be downloaded programmatically using firehose_get, or interactively from either the Broad GDAC website or TCGA Data Coordination Center Portal.