This pipeline uses various statistical tests to identify RPPAs whose expression levels correlated to selected clinical features.
Testing the association between 189 genes and 5 clinical features across 137 samples, statistically thresholded by Q value < 0.05, 1 clinical feature related to at least one genes.
-
3 genes correlated to 'PATHOLOGY.T.STAGE'.
-
EIF4G1|EIF4G-R-C , DVL3|DVL3-R-V , EEF2K|EEF2K-R-V
-
No genes correlated to 'AGE', 'PATHOLOGY.N.STAGE', 'COMPLETENESS.OF.RESECTION', and 'NUMBER.OF.LYMPH.NODES'.
Complete statistical result table is provided in Supplement Table 1
Table 1. Get Full Table This table shows the clinical features, statistical methods used, and the number of genes that are significantly associated with each clinical feature at Q value < 0.05.
| Clinical feature | Statistical test | Significant genes | Associated with | Associated with | ||
|---|---|---|---|---|---|---|
| AGE | Spearman correlation test | N=0 | ||||
| PATHOLOGY T STAGE | Spearman correlation test | N=3 | higher stage | N=3 | lower stage | N=0 |
| PATHOLOGY N STAGE | t test | N=0 | ||||
| COMPLETENESS OF RESECTION | ANOVA test | N=0 | ||||
| NUMBER OF LYMPH NODES | Spearman correlation test | N=0 |
Table S1. Basic characteristics of clinical feature: 'AGE'
| AGE | Mean (SD) | 60.23 (7.1) |
| Significant markers | N = 0 |
Table S2. Basic characteristics of clinical feature: 'PATHOLOGY.T.STAGE'
| PATHOLOGY.T.STAGE | Mean (SD) | 2.65 (0.55) |
| N | ||
| 2 | 53 | |
| 3 | 79 | |
| 4 | 5 | |
| Significant markers | N = 3 | |
| pos. correlated | 3 | |
| neg. correlated | 0 |
Table S3. Get Full Table List of 3 genes significantly correlated to 'PATHOLOGY.T.STAGE' by Spearman correlation test
| SpearmanCorr | corrP | Q | |
|---|---|---|---|
| EIF4G1|EIF4G-R-C | 0.3464 | 3.38e-05 | 0.00639 |
| DVL3|DVL3-R-V | 0.3391 | 5.053e-05 | 0.0095 |
| EEF2K|EEF2K-R-V | 0.3255 | 0.0001041 | 0.0195 |
Figure S1. Get High-res Image As an example, this figure shows the association of EIF4G1|EIF4G-R-C to 'PATHOLOGY.T.STAGE'. P value = 3.38e-05 with Spearman correlation analysis.
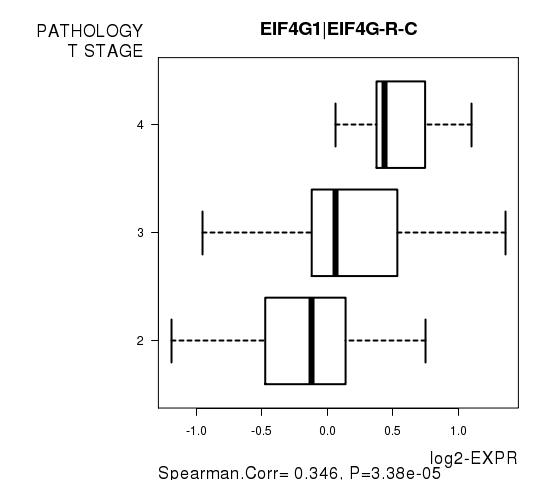
Table S4. Basic characteristics of clinical feature: 'PATHOLOGY.N.STAGE'
| PATHOLOGY.N.STAGE | Labels | N |
| class0 | 109 | |
| class1 | 13 | |
| Significant markers | N = 0 |
Table S5. Basic characteristics of clinical feature: 'COMPLETENESS.OF.RESECTION'
| COMPLETENESS.OF.RESECTION | Labels | N |
| R0 | 100 | |
| R1 | 27 | |
| RX | 3 | |
| Significant markers | N = 0 |
-
Expresson data file = PRAD-TP.rppa.txt
-
Clinical data file = PRAD-TP.clin.merged.picked.txt
-
Number of patients = 137
-
Number of genes = 189
-
Number of clinical features = 5
For continuous numerical clinical features, Spearman's rank correlation coefficients (Spearman 1904) and two-tailed P values were estimated using 'cor.test' function in R
For two-class clinical features, two-tailed Student's t test with unequal variance (Lehmann and Romano 2005) was applied to compare the log2-expression levels between the two clinical classes using 't.test' function in R
For multi-class clinical features (ordinal or nominal), one-way analysis of variance (Howell 2002) was applied to compare the log2-expression levels between different clinical classes using 'anova' function in R
For multiple hypothesis correction, Q value is the False Discovery Rate (FDR) analogue of the P value (Benjamini and Hochberg 1995), defined as the minimum FDR at which the test may be called significant. We used the 'Benjamini and Hochberg' method of 'p.adjust' function in R to convert P values into Q values.
In addition to the links below, the full results of the analysis summarized in this report can also be downloaded programmatically using firehose_get, or interactively from either the Broad GDAC website or TCGA Data Coordination Center Portal.