This pipeline uses various statistical tests to identify miRs whose expression levels correlated to selected clinical features.
Testing the association between 470 genes and 5 clinical features across 164 samples, statistically thresholded by Q value < 0.05, 2 clinical features related to at least one genes.
-
5 genes correlated to 'PATHOLOGY.T.STAGE'.
-
HSA-MIR-30A , HSA-MIR-3676 , HSA-MIR-190 , HSA-MIR-598 , HSA-MIR-486
-
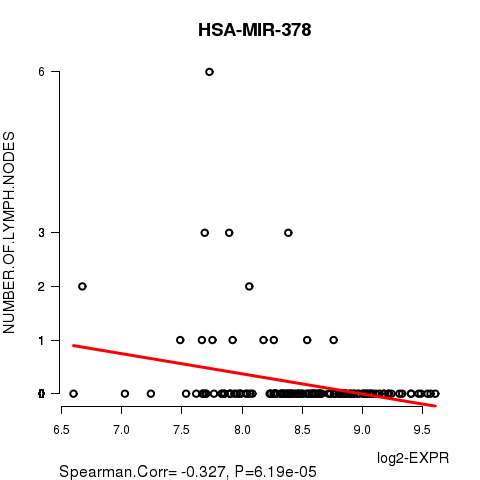
1 gene correlated to 'NUMBER.OF.LYMPH.NODES'.
-
HSA-MIR-378
-
No genes correlated to 'AGE', 'PATHOLOGY.N.STAGE', and 'COMPLETENESS.OF.RESECTION'.
Complete statistical result table is provided in Supplement Table 1
Table 1. Get Full Table This table shows the clinical features, statistical methods used, and the number of genes that are significantly associated with each clinical feature at Q value < 0.05.
| Clinical feature | Statistical test | Significant genes | Associated with | Associated with | ||
|---|---|---|---|---|---|---|
| AGE | Spearman correlation test | N=0 | ||||
| PATHOLOGY T STAGE | Spearman correlation test | N=5 | higher stage | N=0 | lower stage | N=5 |
| PATHOLOGY N STAGE | t test | N=0 | ||||
| COMPLETENESS OF RESECTION | ANOVA test | N=0 | ||||
| NUMBER OF LYMPH NODES | Spearman correlation test | N=1 | higher number.of.lymph.nodes | N=0 | lower number.of.lymph.nodes | N=1 |
Table S1. Basic characteristics of clinical feature: 'AGE'
| AGE | Mean (SD) | 60.17 (6.9) |
| Significant markers | N = 0 |
Table S2. Basic characteristics of clinical feature: 'PATHOLOGY.T.STAGE'
| PATHOLOGY.T.STAGE | Mean (SD) | 2.6 (0.54) |
| N | ||
| 2 | 70 | |
| 3 | 89 | |
| 4 | 4 | |
| Significant markers | N = 5 | |
| pos. correlated | 0 | |
| neg. correlated | 5 |
Table S3. Get Full Table List of 5 genes significantly correlated to 'PATHOLOGY.T.STAGE' by Spearman correlation test
| SpearmanCorr | corrP | Q | |
|---|---|---|---|
| HSA-MIR-30A | -0.3348 | 1.251e-05 | 0.00588 |
| HSA-MIR-3676 | -0.3217 | 2.983e-05 | 0.014 |
| HSA-MIR-190 | -0.3094 | 6.162e-05 | 0.0288 |
| HSA-MIR-598 | -0.3042 | 7.901e-05 | 0.0369 |
| HSA-MIR-486 | -0.3002 | 9.878e-05 | 0.046 |
Figure S1. Get High-res Image As an example, this figure shows the association of HSA-MIR-30A to 'PATHOLOGY.T.STAGE'. P value = 1.25e-05 with Spearman correlation analysis.
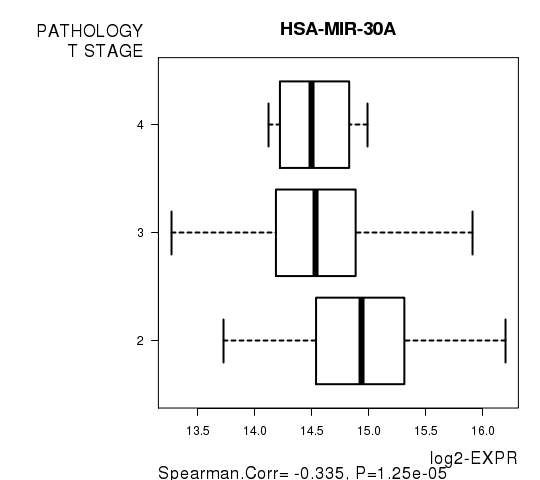
Table S4. Basic characteristics of clinical feature: 'PATHOLOGY.N.STAGE'
| PATHOLOGY.N.STAGE | Labels | N |
| class0 | 130 | |
| class1 | 14 | |
| Significant markers | N = 0 |
Table S5. Basic characteristics of clinical feature: 'COMPLETENESS.OF.RESECTION'
| COMPLETENESS.OF.RESECTION | Labels | N |
| R0 | 122 | |
| R1 | 30 | |
| RX | 3 | |
| Significant markers | N = 0 |
Table S6. Basic characteristics of clinical feature: 'NUMBER.OF.LYMPH.NODES'
| NUMBER.OF.LYMPH.NODES | Mean (SD) | 0.19 (0.72) |
| Significant markers | N = 1 | |
| pos. correlated | 0 | |
| neg. correlated | 1 |
Table S7. Get Full Table List of one gene significantly correlated to 'NUMBER.OF.LYMPH.NODES' by Spearman correlation test
| SpearmanCorr | corrP | Q | |
|---|---|---|---|
| HSA-MIR-378 | -0.3274 | 6.19e-05 | 0.0291 |
Figure S2. Get High-res Image As an example, this figure shows the association of HSA-MIR-378 to 'NUMBER.OF.LYMPH.NODES'. P value = 6.19e-05 with Spearman correlation analysis. The straight line presents the best linear regression.
-
Expresson data file = PRAD-TP.miRseq_RPKM_log2.txt
-
Clinical data file = PRAD-TP.clin.merged.picked.txt
-
Number of patients = 164
-
Number of genes = 470
-
Number of clinical features = 5
For continuous numerical clinical features, Spearman's rank correlation coefficients (Spearman 1904) and two-tailed P values were estimated using 'cor.test' function in R
For two-class clinical features, two-tailed Student's t test with unequal variance (Lehmann and Romano 2005) was applied to compare the log2-expression levels between the two clinical classes using 't.test' function in R
For multi-class clinical features (ordinal or nominal), one-way analysis of variance (Howell 2002) was applied to compare the log2-expression levels between different clinical classes using 'anova' function in R
For multiple hypothesis correction, Q value is the False Discovery Rate (FDR) analogue of the P value (Benjamini and Hochberg 1995), defined as the minimum FDR at which the test may be called significant. We used the 'Benjamini and Hochberg' method of 'p.adjust' function in R to convert P values into Q values.
In addition to the links below, the full results of the analysis summarized in this report can also be downloaded programmatically using firehose_get, or interactively from either the Broad GDAC website or TCGA Data Coordination Center Portal.