This pipeline computes the correlation between significant arm-level copy number variations (cnvs) and selected clinical features.
Testing the association between copy number variation 77 arm-level events and 11 clinical features across 162 patients, 2 significant findings detected with Q value < 0.25.
-
4P GAIN MUTATION ANALYSIS cnv correlated to 'NUMBER.OF.LYMPH.NODES'.
-
2Q LOSS MUTATION ANALYSIS cnv correlated to 'NUMBER.OF.LYMPH.NODES'.
Table 1. Get Full Table Overview of the association between significant copy number variation of 77 arm-level events and 11 clinical features. Shown in the table are P values (Q values). Thresholded by Q value < 0.25, 2 significant findings detected.
|
Clinical Features |
Time to Death |
AGE |
NEOPLASM DISEASESTAGE |
PATHOLOGY T STAGE |
PATHOLOGY N STAGE |
PATHOLOGY M STAGE |
GENDER |
HISTOLOGICAL TYPE |
RADIATIONS RADIATION REGIMENINDICATION |
COMPLETENESS OF RESECTION |
NUMBER OF LYMPH NODES |
||
| nCNV (%) | nWild-Type | logrank test | t-test | Chi-square test | Fisher's exact test | Fisher's exact test | Fisher's exact test | Fisher's exact test | Fisher's exact test | Fisher's exact test | Fisher's exact test | t-test | |
| 4P GAIN MUTATION ANALYSIS | 8 (5%) | 154 |
0.701 (1.00) |
0.538 (1.00) |
0.258 (1.00) |
0.606 (1.00) |
0.304 (1.00) |
0.287 (1.00) |
0.292 (1.00) |
1 (1.00) |
1 (1.00) |
1 (1.00) |
2.96e-05 (0.025) |
| 2Q LOSS MUTATION ANALYSIS | 6 (4%) | 156 |
0.515 (1.00) |
0.0182 (1.00) |
0.249 (1.00) |
1 (1.00) |
0.0467 (1.00) |
0.776 (1.00) |
1 (1.00) |
1 (1.00) |
1 (1.00) |
1 (1.00) |
1.39e-08 (1.17e-05) |
| 1P GAIN MUTATION ANALYSIS | 11 (7%) | 151 |
0.0118 (1.00) |
0.829 (1.00) |
0.268 (1.00) |
0.0176 (1.00) |
0.378 (1.00) |
0.106 (1.00) |
1 (1.00) |
0.0388 (1.00) |
1 (1.00) |
0.216 (1.00) |
0.451 (1.00) |
| 1Q GAIN MUTATION ANALYSIS | 32 (20%) | 130 |
0.983 (1.00) |
0.282 (1.00) |
0.273 (1.00) |
0.0025 (1.00) |
0.182 (1.00) |
0.615 (1.00) |
0.429 (1.00) |
0.277 (1.00) |
1 (1.00) |
0.532 (1.00) |
0.0533 (1.00) |
| 2P GAIN MUTATION ANALYSIS | 33 (20%) | 129 |
0.535 (1.00) |
0.544 (1.00) |
0.263 (1.00) |
0.416 (1.00) |
0.0937 (1.00) |
0.216 (1.00) |
0.0303 (1.00) |
0.0716 (1.00) |
1 (1.00) |
0.151 (1.00) |
0.845 (1.00) |
| 2Q GAIN MUTATION ANALYSIS | 35 (22%) | 127 |
0.94 (1.00) |
0.606 (1.00) |
0.194 (1.00) |
0.248 (1.00) |
0.0568 (1.00) |
0.292 (1.00) |
0.0341 (1.00) |
0.0415 (1.00) |
0.611 (1.00) |
0.266 (1.00) |
0.402 (1.00) |
| 3P GAIN MUTATION ANALYSIS | 26 (16%) | 136 |
0.55 (1.00) |
0.851 (1.00) |
0.182 (1.00) |
0.846 (1.00) |
0.319 (1.00) |
0.0317 (1.00) |
0.671 (1.00) |
0.697 (1.00) |
0.247 (1.00) |
0.861 (1.00) |
0.606 (1.00) |
| 3Q GAIN MUTATION ANALYSIS | 33 (20%) | 129 |
0.914 (1.00) |
0.95 (1.00) |
0.309 (1.00) |
0.741 (1.00) |
0.374 (1.00) |
0.0459 (1.00) |
0.557 (1.00) |
0.303 (1.00) |
0.603 (1.00) |
0.636 (1.00) |
0.924 (1.00) |
| 4Q GAIN MUTATION ANALYSIS | 4 (2%) | 158 |
0.442 (1.00) |
0.921 (1.00) |
1 (1.00) |
0.656 (1.00) |
0.655 (1.00) |
0.126 (1.00) |
1 (1.00) |
1 (1.00) |
1 (1.00) |
0.0153 (1.00) |
|
| 5P GAIN MUTATION ANALYSIS | 31 (19%) | 131 |
0.47 (1.00) |
0.702 (1.00) |
0.552 (1.00) |
0.071 (1.00) |
0.552 (1.00) |
0.464 (1.00) |
0.111 (1.00) |
0.0727 (1.00) |
0.323 (1.00) |
0.519 (1.00) |
0.926 (1.00) |
| 5Q GAIN MUTATION ANALYSIS | 21 (13%) | 141 |
0.365 (1.00) |
0.665 (1.00) |
0.325 (1.00) |
0.432 (1.00) |
0.486 (1.00) |
0.768 (1.00) |
0.249 (1.00) |
0.218 (1.00) |
1 (1.00) |
0.629 (1.00) |
0.342 (1.00) |
| 6P GAIN MUTATION ANALYSIS | 39 (24%) | 123 |
0.942 (1.00) |
0.716 (1.00) |
0.613 (1.00) |
0.25 (1.00) |
0.156 (1.00) |
0.0967 (1.00) |
0.854 (1.00) |
0.19 (1.00) |
0.0302 (1.00) |
0.365 (1.00) |
0.444 (1.00) |
| 6Q GAIN MUTATION ANALYSIS | 35 (22%) | 127 |
0.733 (1.00) |
0.649 (1.00) |
0.117 (1.00) |
0.289 (1.00) |
0.202 (1.00) |
0.022 (1.00) |
0.848 (1.00) |
0.0726 (1.00) |
0.0202 (1.00) |
0.279 (1.00) |
0.923 (1.00) |
| 7P GAIN MUTATION ANALYSIS | 101 (62%) | 61 |
0.287 (1.00) |
0.583 (1.00) |
0.0617 (1.00) |
0.442 (1.00) |
0.236 (1.00) |
0.827 (1.00) |
0.332 (1.00) |
0.0154 (1.00) |
0.411 (1.00) |
0.492 (1.00) |
0.16 (1.00) |
| 7Q GAIN MUTATION ANALYSIS | 90 (56%) | 72 |
0.373 (1.00) |
0.476 (1.00) |
0.00452 (1.00) |
0.782 (1.00) |
0.0543 (1.00) |
0.533 (1.00) |
0.207 (1.00) |
0.0172 (1.00) |
0.228 (1.00) |
0.448 (1.00) |
0.144 (1.00) |
| 8P GAIN MUTATION ANALYSIS | 41 (25%) | 121 |
0.979 (1.00) |
0.639 (1.00) |
0.13 (1.00) |
0.134 (1.00) |
0.779 (1.00) |
0.575 (1.00) |
0.589 (1.00) |
1 (1.00) |
0.643 (1.00) |
0.228 (1.00) |
0.0993 (1.00) |
| 8Q GAIN MUTATION ANALYSIS | 88 (54%) | 74 |
0.0928 (1.00) |
0.598 (1.00) |
0.0188 (1.00) |
0.109 (1.00) |
0.163 (1.00) |
0.219 (1.00) |
1 (1.00) |
0.0867 (1.00) |
0.221 (1.00) |
0.109 (1.00) |
0.318 (1.00) |
| 9P GAIN MUTATION ANALYSIS | 41 (25%) | 121 |
0.637 (1.00) |
0.413 (1.00) |
0.189 (1.00) |
0.841 (1.00) |
0.634 (1.00) |
0.807 (1.00) |
0.857 (1.00) |
0.32 (1.00) |
1 (1.00) |
0.583 (1.00) |
0.609 (1.00) |
| 9Q GAIN MUTATION ANALYSIS | 32 (20%) | 130 |
0.648 (1.00) |
0.176 (1.00) |
0.0166 (1.00) |
0.935 (1.00) |
0.929 (1.00) |
1 (1.00) |
0.328 (1.00) |
0.291 (1.00) |
1 (1.00) |
1 (1.00) |
0.923 (1.00) |
| 10P GAIN MUTATION ANALYSIS | 12 (7%) | 150 |
0.939 (1.00) |
0.733 (1.00) |
0.884 (1.00) |
0.529 (1.00) |
0.852 (1.00) |
0.672 (1.00) |
0.772 (1.00) |
0.601 (1.00) |
0.375 (1.00) |
1 (1.00) |
0.184 (1.00) |
| 10Q GAIN MUTATION ANALYSIS | 6 (4%) | 156 |
0.968 (1.00) |
0.475 (1.00) |
0.337 (1.00) |
0.641 (1.00) |
0.0846 (1.00) |
0.737 (1.00) |
0.0938 (1.00) |
1 (1.00) |
0.206 (1.00) |
1 (1.00) |
0.406 (1.00) |
| 11P GAIN MUTATION ANALYSIS | 28 (17%) | 134 |
0.273 (1.00) |
0.503 (1.00) |
0.884 (1.00) |
0.481 (1.00) |
0.623 (1.00) |
0.269 (1.00) |
0.836 (1.00) |
0.127 (1.00) |
1 (1.00) |
1 (1.00) |
0.666 (1.00) |
| 11Q GAIN MUTATION ANALYSIS | 24 (15%) | 138 |
0.6 (1.00) |
0.162 (1.00) |
0.708 (1.00) |
0.294 (1.00) |
0.311 (1.00) |
0.111 (1.00) |
1 (1.00) |
0.221 (1.00) |
0.593 (1.00) |
1 (1.00) |
0.0323 (1.00) |
| 12P GAIN MUTATION ANALYSIS | 33 (20%) | 129 |
0.702 (1.00) |
0.402 (1.00) |
0.732 (1.00) |
0.492 (1.00) |
0.361 (1.00) |
0.626 (1.00) |
0.7 (1.00) |
0.471 (1.00) |
0.0996 (1.00) |
0.265 (1.00) |
0.45 (1.00) |
| 12Q GAIN MUTATION ANALYSIS | 22 (14%) | 140 |
0.776 (1.00) |
0.238 (1.00) |
0.886 (1.00) |
0.658 (1.00) |
0.716 (1.00) |
0.941 (1.00) |
0.818 (1.00) |
0.688 (1.00) |
0.59 (1.00) |
0.85 (1.00) |
0.775 (1.00) |
| 13Q GAIN MUTATION ANALYSIS | 108 (67%) | 54 |
0.0483 (1.00) |
0.273 (1.00) |
0.359 (1.00) |
0.302 (1.00) |
0.0286 (1.00) |
0.0341 (1.00) |
0.738 (1.00) |
0.00104 (0.875) |
0.401 (1.00) |
0.903 (1.00) |
0.897 (1.00) |
| 14Q GAIN MUTATION ANALYSIS | 8 (5%) | 154 |
0.298 (1.00) |
0.968 (1.00) |
0.8 (1.00) |
1 (1.00) |
0.445 (1.00) |
0.825 (1.00) |
0.471 (1.00) |
1 (1.00) |
0.266 (1.00) |
1 (1.00) |
0.746 (1.00) |
| 15Q GAIN MUTATION ANALYSIS | 5 (3%) | 157 |
0.34 (1.00) |
0.706 (1.00) |
0.607 (1.00) |
0.107 (1.00) |
0.273 (1.00) |
1 (1.00) |
0.179 (1.00) |
0.0557 (1.00) |
0.174 (1.00) |
1 (1.00) |
0.5 (1.00) |
| 16P GAIN MUTATION ANALYSIS | 38 (23%) | 124 |
0.932 (1.00) |
0.628 (1.00) |
0.505 (1.00) |
0.884 (1.00) |
0.431 (1.00) |
0.81 (1.00) |
0.58 (1.00) |
0.0389 (1.00) |
0.626 (1.00) |
0.685 (1.00) |
0.931 (1.00) |
| 16Q GAIN MUTATION ANALYSIS | 38 (23%) | 124 |
0.344 (1.00) |
0.56 (1.00) |
0.704 (1.00) |
1 (1.00) |
0.233 (1.00) |
0.31 (1.00) |
0.854 (1.00) |
0.0389 (1.00) |
0.626 (1.00) |
0.929 (1.00) |
0.439 (1.00) |
| 17P GAIN MUTATION ANALYSIS | 8 (5%) | 154 |
0.62 (1.00) |
0.548 (1.00) |
0.813 (1.00) |
0.0474 (1.00) |
0.702 (1.00) |
0.825 (1.00) |
1 (1.00) |
0.51 (1.00) |
1 (1.00) |
1 (1.00) |
0.551 (1.00) |
| 17Q GAIN MUTATION ANALYSIS | 29 (18%) | 133 |
0.41 (1.00) |
0.66 (1.00) |
0.633 (1.00) |
0.981 (1.00) |
0.444 (1.00) |
0.522 (1.00) |
0.683 (1.00) |
0.464 (1.00) |
0.592 (1.00) |
0.89 (1.00) |
0.298 (1.00) |
| 18P GAIN MUTATION ANALYSIS | 9 (6%) | 153 |
0.933 (1.00) |
0.413 (1.00) |
0.132 (1.00) |
0.444 (1.00) |
0.653 (1.00) |
0.345 (1.00) |
1 (1.00) |
0.165 (1.00) |
0.294 (1.00) |
0.126 (1.00) |
0.259 (1.00) |
| 18Q GAIN MUTATION ANALYSIS | 6 (4%) | 156 |
0.203 (1.00) |
0.397 (1.00) |
0.0794 (1.00) |
0.17 (1.00) |
0.0846 (1.00) |
0.145 (1.00) |
0.221 (1.00) |
0.412 (1.00) |
0.206 (1.00) |
0.041 (1.00) |
0.175 (1.00) |
| 19P GAIN MUTATION ANALYSIS | 29 (18%) | 133 |
0.855 (1.00) |
0.951 (1.00) |
0.62 (1.00) |
0.149 (1.00) |
0.858 (1.00) |
0.299 (1.00) |
0.539 (1.00) |
0.129 (1.00) |
0.592 (1.00) |
0.455 (1.00) |
0.967 (1.00) |
| 19Q GAIN MUTATION ANALYSIS | 30 (19%) | 132 |
0.523 (1.00) |
0.93 (1.00) |
0.551 (1.00) |
0.118 (1.00) |
0.742 (1.00) |
0.311 (1.00) |
0.418 (1.00) |
0.0747 (1.00) |
0.594 (1.00) |
0.239 (1.00) |
0.044 (1.00) |
| 20P GAIN MUTATION ANALYSIS | 103 (64%) | 59 |
0.384 (1.00) |
0.58 (1.00) |
0.0492 (1.00) |
0.824 (1.00) |
0.297 (1.00) |
0.825 (1.00) |
0.194 (1.00) |
0.0139 (1.00) |
1 (1.00) |
0.141 (1.00) |
0.97 (1.00) |
| 20Q GAIN MUTATION ANALYSIS | 142 (88%) | 20 |
0.0364 (1.00) |
0.142 (1.00) |
0.0845 (1.00) |
0.53 (1.00) |
0.023 (1.00) |
0.634 (1.00) |
0.811 (1.00) |
0.00106 (0.893) |
0.552 (1.00) |
0.11 (1.00) |
0.557 (1.00) |
| 21Q GAIN MUTATION ANALYSIS | 10 (6%) | 152 |
0.75 (1.00) |
0.617 (1.00) |
0.306 (1.00) |
0.752 (1.00) |
0.905 (1.00) |
0.639 (1.00) |
1 (1.00) |
1 (1.00) |
1 (1.00) |
0.661 (1.00) |
0.125 (1.00) |
| 22Q GAIN MUTATION ANALYSIS | 9 (6%) | 153 |
0.00296 (1.00) |
0.905 (1.00) |
0.475 (1.00) |
0.707 (1.00) |
0.39 (1.00) |
1 (1.00) |
1 (1.00) |
1 (1.00) |
1 (1.00) |
0.61 (1.00) |
0.359 (1.00) |
| XQ GAIN MUTATION ANALYSIS | 34 (21%) | 128 |
0.827 (1.00) |
0.067 (1.00) |
0.613 (1.00) |
0.226 (1.00) |
0.448 (1.00) |
0.637 (1.00) |
0.121 (1.00) |
0.307 (1.00) |
0.345 (1.00) |
0.778 (1.00) |
0.517 (1.00) |
| 1P LOSS MUTATION ANALYSIS | 42 (26%) | 120 |
0.462 (1.00) |
0.495 (1.00) |
0.926 (1.00) |
0.841 (1.00) |
0.566 (1.00) |
0.822 (1.00) |
0.284 (1.00) |
0.0223 (1.00) |
0.181 (1.00) |
0.735 (1.00) |
0.365 (1.00) |
| 1Q LOSS MUTATION ANALYSIS | 24 (15%) | 138 |
0.78 (1.00) |
0.798 (1.00) |
0.329 (1.00) |
0.76 (1.00) |
0.222 (1.00) |
0.276 (1.00) |
0.119 (1.00) |
0.218 (1.00) |
0.0426 (1.00) |
0.724 (1.00) |
0.522 (1.00) |
| 2P LOSS MUTATION ANALYSIS | 11 (7%) | 151 |
0.491 (1.00) |
0.00112 (0.944) |
0.347 (1.00) |
0.614 (1.00) |
0.491 (1.00) |
1 (1.00) |
0.551 (1.00) |
0.592 (1.00) |
0.349 (1.00) |
0.705 (1.00) |
0.878 (1.00) |
| 3P LOSS MUTATION ANALYSIS | 15 (9%) | 147 |
0.14 (1.00) |
0.718 (1.00) |
0.0387 (1.00) |
0.145 (1.00) |
0.207 (1.00) |
0.0201 (1.00) |
0.0545 (1.00) |
0.0794 (1.00) |
0.0967 (1.00) |
0.0119 (1.00) |
0.0926 (1.00) |
| 3Q LOSS MUTATION ANALYSIS | 10 (6%) | 152 |
0.0961 (1.00) |
0.743 (1.00) |
0.0298 (1.00) |
0.4 (1.00) |
0.166 (1.00) |
0.0422 (1.00) |
0.112 (1.00) |
0.00297 (1.00) |
0.0452 (1.00) |
0.0177 (1.00) |
0.158 (1.00) |
| 4P LOSS MUTATION ANALYSIS | 57 (35%) | 105 |
0.416 (1.00) |
0.722 (1.00) |
0.534 (1.00) |
0.478 (1.00) |
0.447 (1.00) |
0.98 (1.00) |
0.328 (1.00) |
0.545 (1.00) |
0.0208 (1.00) |
0.202 (1.00) |
0.397 (1.00) |
| 4Q LOSS MUTATION ANALYSIS | 65 (40%) | 97 |
0.18 (1.00) |
0.832 (1.00) |
0.485 (1.00) |
0.482 (1.00) |
0.807 (1.00) |
0.8 (1.00) |
0.262 (1.00) |
0.252 (1.00) |
0.0387 (1.00) |
0.137 (1.00) |
0.586 (1.00) |
| 5P LOSS MUTATION ANALYSIS | 25 (15%) | 137 |
0.474 (1.00) |
0.494 (1.00) |
0.816 (1.00) |
0.895 (1.00) |
0.706 (1.00) |
0.946 (1.00) |
0.131 (1.00) |
0.694 (1.00) |
0.232 (1.00) |
0.388 (1.00) |
0.209 (1.00) |
| 5Q LOSS MUTATION ANALYSIS | 39 (24%) | 123 |
0.542 (1.00) |
0.631 (1.00) |
0.748 (1.00) |
0.805 (1.00) |
1 (1.00) |
0.688 (1.00) |
0.464 (1.00) |
0.19 (1.00) |
0.00324 (1.00) |
0.63 (1.00) |
0.795 (1.00) |
| 6P LOSS MUTATION ANALYSIS | 14 (9%) | 148 |
0.0137 (1.00) |
0.701 (1.00) |
0.131 (1.00) |
0.367 (1.00) |
0.0194 (1.00) |
0.81 (1.00) |
1 (1.00) |
0.0794 (1.00) |
0.424 (1.00) |
0.453 (1.00) |
0.951 (1.00) |
| 6Q LOSS MUTATION ANALYSIS | 22 (14%) | 140 |
0.0823 (1.00) |
0.837 (1.00) |
0.0108 (1.00) |
0.425 (1.00) |
0.0717 (1.00) |
1 (1.00) |
0.176 (1.00) |
0.0137 (1.00) |
0.59 (1.00) |
0.644 (1.00) |
0.27 (1.00) |
| 8P LOSS MUTATION ANALYSIS | 74 (46%) | 88 |
0.226 (1.00) |
0.443 (1.00) |
0.877 (1.00) |
0.866 (1.00) |
0.387 (1.00) |
0.641 (1.00) |
0.636 (1.00) |
0.773 (1.00) |
0.413 (1.00) |
0.868 (1.00) |
0.0377 (1.00) |
| 8Q LOSS MUTATION ANALYSIS | 11 (7%) | 151 |
0.959 (1.00) |
0.42 (1.00) |
0.93 (1.00) |
0.381 (1.00) |
0.593 (1.00) |
0.672 (1.00) |
0.0672 (1.00) |
0.601 (1.00) |
1 (1.00) |
1 (1.00) |
0.649 (1.00) |
| 9P LOSS MUTATION ANALYSIS | 22 (14%) | 140 |
0.0171 (1.00) |
0.96 (1.00) |
0.188 (1.00) |
0.0921 (1.00) |
1 (1.00) |
0.0475 (1.00) |
0.369 (1.00) |
1 (1.00) |
0.59 (1.00) |
0.00975 (1.00) |
0.635 (1.00) |
| 9Q LOSS MUTATION ANALYSIS | 21 (13%) | 141 |
0.0154 (1.00) |
0.716 (1.00) |
0.416 (1.00) |
0.0317 (1.00) |
0.472 (1.00) |
0.113 (1.00) |
0.249 (1.00) |
1 (1.00) |
0.571 (1.00) |
0.00975 (1.00) |
0.126 (1.00) |
| 10P LOSS MUTATION ANALYSIS | 32 (20%) | 130 |
0.0943 (1.00) |
0.00151 (1.00) |
0.589 (1.00) |
0.809 (1.00) |
0.677 (1.00) |
0.296 (1.00) |
0.558 (1.00) |
0.0235 (1.00) |
0.0144 (1.00) |
0.252 (1.00) |
0.592 (1.00) |
| 10Q LOSS MUTATION ANALYSIS | 37 (23%) | 125 |
0.245 (1.00) |
0.066 (1.00) |
0.434 (1.00) |
0.779 (1.00) |
0.822 (1.00) |
0.351 (1.00) |
0.348 (1.00) |
0.0773 (1.00) |
0.0249 (1.00) |
0.141 (1.00) |
0.894 (1.00) |
| 11P LOSS MUTATION ANALYSIS | 24 (15%) | 138 |
0.833 (1.00) |
0.28 (1.00) |
0.513 (1.00) |
0.413 (1.00) |
0.184 (1.00) |
0.156 (1.00) |
1 (1.00) |
0.0898 (1.00) |
0.217 (1.00) |
0.316 (1.00) |
0.0684 (1.00) |
| 11Q LOSS MUTATION ANALYSIS | 29 (18%) | 133 |
0.19 (1.00) |
0.653 (1.00) |
0.791 (1.00) |
0.803 (1.00) |
0.858 (1.00) |
0.173 (1.00) |
1 (1.00) |
0.037 (1.00) |
0.0711 (1.00) |
0.278 (1.00) |
0.316 (1.00) |
| 12P LOSS MUTATION ANALYSIS | 23 (14%) | 139 |
0.113 (1.00) |
0.746 (1.00) |
0.598 (1.00) |
0.519 (1.00) |
0.603 (1.00) |
0.841 (1.00) |
0.508 (1.00) |
0.217 (1.00) |
1 (1.00) |
0.861 (1.00) |
0.895 (1.00) |
| 12Q LOSS MUTATION ANALYSIS | 21 (13%) | 141 |
0.0523 (1.00) |
0.283 (1.00) |
0.529 (1.00) |
0.917 (1.00) |
0.823 (1.00) |
0.721 (1.00) |
0.819 (1.00) |
0.221 (1.00) |
0.571 (1.00) |
1 (1.00) |
0.939 (1.00) |
| 13Q LOSS MUTATION ANALYSIS | 8 (5%) | 154 |
0.31 (1.00) |
0.582 (1.00) |
0.494 (1.00) |
0.469 (1.00) |
0.35 (1.00) |
0.171 (1.00) |
1 (1.00) |
0.135 (1.00) |
1 (1.00) |
0.61 (1.00) |
0.445 (1.00) |
| 14Q LOSS MUTATION ANALYSIS | 64 (40%) | 98 |
0.24 (1.00) |
0.644 (1.00) |
0.253 (1.00) |
0.483 (1.00) |
0.172 (1.00) |
0.858 (1.00) |
0.198 (1.00) |
0.0159 (1.00) |
0.681 (1.00) |
0.269 (1.00) |
0.841 (1.00) |
| 15Q LOSS MUTATION ANALYSIS | 70 (43%) | 92 |
0.137 (1.00) |
0.928 (1.00) |
0.254 (1.00) |
0.213 (1.00) |
0.364 (1.00) |
0.803 (1.00) |
0.152 (1.00) |
0.779 (1.00) |
0.404 (1.00) |
0.907 (1.00) |
0.029 (1.00) |
| 16P LOSS MUTATION ANALYSIS | 9 (6%) | 153 |
0.0164 (1.00) |
0.254 (1.00) |
0.0328 (1.00) |
0.776 (1.00) |
0.0918 (1.00) |
1 (1.00) |
0.733 (1.00) |
0.51 (1.00) |
1 (1.00) |
1 (1.00) |
0.58 (1.00) |
| 16Q LOSS MUTATION ANALYSIS | 15 (9%) | 147 |
0.974 (1.00) |
0.712 (1.00) |
0.191 (1.00) |
0.845 (1.00) |
0.0117 (1.00) |
0.904 (1.00) |
0.593 (1.00) |
1 (1.00) |
0.447 (1.00) |
0.736 (1.00) |
0.219 (1.00) |
| 17P LOSS MUTATION ANALYSIS | 104 (64%) | 58 |
0.785 (1.00) |
0.115 (1.00) |
0.554 (1.00) |
0.0306 (1.00) |
0.928 (1.00) |
0.273 (1.00) |
1 (1.00) |
0.226 (1.00) |
1 (1.00) |
0.753 (1.00) |
0.743 (1.00) |
| 17Q LOSS MUTATION ANALYSIS | 25 (15%) | 137 |
0.548 (1.00) |
0.596 (1.00) |
0.639 (1.00) |
0.601 (1.00) |
0.598 (1.00) |
0.655 (1.00) |
0.383 (1.00) |
0.693 (1.00) |
0.232 (1.00) |
0.329 (1.00) |
0.718 (1.00) |
| 18P LOSS MUTATION ANALYSIS | 124 (77%) | 38 |
0.775 (1.00) |
0.208 (1.00) |
0.46 (1.00) |
0.351 (1.00) |
0.597 (1.00) |
0.285 (1.00) |
0.854 (1.00) |
0.0373 (1.00) |
1 (1.00) |
0.465 (1.00) |
0.575 (1.00) |
| 18Q LOSS MUTATION ANALYSIS | 135 (83%) | 27 |
0.976 (1.00) |
0.148 (1.00) |
0.314 (1.00) |
0.0571 (1.00) |
0.754 (1.00) |
0.291 (1.00) |
0.674 (1.00) |
0.439 (1.00) |
1 (1.00) |
0.615 (1.00) |
0.768 (1.00) |
| 19P LOSS MUTATION ANALYSIS | 23 (14%) | 139 |
0.415 (1.00) |
0.897 (1.00) |
0.0118 (1.00) |
0.393 (1.00) |
0.416 (1.00) |
0.794 (1.00) |
0.508 (1.00) |
1 (1.00) |
1 (1.00) |
1 (1.00) |
0.305 (1.00) |
| 19Q LOSS MUTATION ANALYSIS | 20 (12%) | 142 |
0.613 (1.00) |
0.337 (1.00) |
0.00468 (1.00) |
0.236 (1.00) |
0.437 (1.00) |
0.934 (1.00) |
0.473 (1.00) |
1 (1.00) |
0.552 (1.00) |
0.673 (1.00) |
0.332 (1.00) |
| 20P LOSS MUTATION ANALYSIS | 24 (15%) | 138 |
0.665 (1.00) |
0.932 (1.00) |
0.0522 (1.00) |
0.889 (1.00) |
0.612 (1.00) |
1 (1.00) |
0.664 (1.00) |
0.41 (1.00) |
0.593 (1.00) |
0.309 (1.00) |
0.787 (1.00) |
| 21Q LOSS MUTATION ANALYSIS | 64 (40%) | 98 |
0.852 (1.00) |
0.38 (1.00) |
0.524 (1.00) |
0.193 (1.00) |
0.164 (1.00) |
0.643 (1.00) |
0.872 (1.00) |
0.252 (1.00) |
0.681 (1.00) |
0.462 (1.00) |
0.0652 (1.00) |
| 22Q LOSS MUTATION ANALYSIS | 56 (35%) | 106 |
0.00768 (1.00) |
0.259 (1.00) |
0.261 (1.00) |
0.348 (1.00) |
0.00805 (1.00) |
0.518 (1.00) |
0.623 (1.00) |
1 (1.00) |
0.417 (1.00) |
0.642 (1.00) |
0.429 (1.00) |
| XQ LOSS MUTATION ANALYSIS | 25 (15%) | 137 |
0.276 (1.00) |
0.927 (1.00) |
0.441 (1.00) |
0.0659 (1.00) |
0.322 (1.00) |
0.596 (1.00) |
0.282 (1.00) |
0.424 (1.00) |
1 (1.00) |
0.364 (1.00) |
0.692 (1.00) |
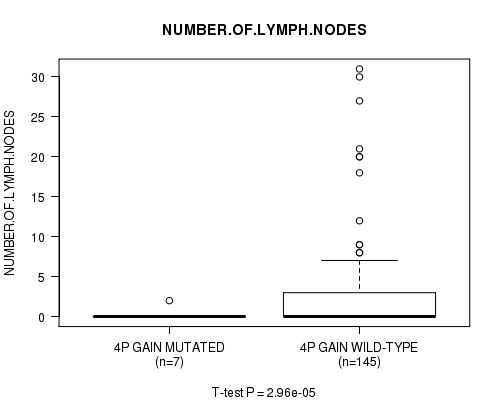
P value = 2.96e-05 (t-test), Q value = 0.025
Table S1. Gene #7: '4P GAIN MUTATION STATUS' versus Clinical Feature #11: 'NUMBER.OF.LYMPH.NODES'
| nPatients | Mean (Std.Dev) | |
|---|---|---|
| ALL | 152 | 2.6 (5.4) |
| 4P GAIN MUTATED | 7 | 0.3 (0.8) |
| 4P GAIN WILD-TYPE | 145 | 2.7 (5.5) |
Figure S1. Get High-res Image Gene #7: '4P GAIN MUTATION STATUS' versus Clinical Feature #11: 'NUMBER.OF.LYMPH.NODES'
P value = 1.39e-08 (t-test), Q value = 1.2e-05
Table S2. Gene #44: '2Q LOSS MUTATION STATUS' versus Clinical Feature #11: 'NUMBER.OF.LYMPH.NODES'
| nPatients | Mean (Std.Dev) | |
|---|---|---|
| ALL | 152 | 2.6 (5.4) |
| 2Q LOSS MUTATED | 6 | 0.0 (0.0) |
| 2Q LOSS WILD-TYPE | 146 | 2.7 (5.4) |
Figure S2. Get High-res Image Gene #44: '2Q LOSS MUTATION STATUS' versus Clinical Feature #11: 'NUMBER.OF.LYMPH.NODES'

-
Copy number data file = transformed.cor.cli.txt
-
Clinical data file = READ-TP.clin.merged.picked.txt
-
Number of patients = 162
-
Number of significantly arm-level cnvs = 77
-
Number of selected clinical features = 11
-
Exclude regions that fewer than K tumors have mutations, K = 3
For survival clinical features, the Kaplan-Meier survival curves of tumors with and without gene mutations were plotted and the statistical significance P values were estimated by logrank test (Bland and Altman 2004) using the 'survdiff' function in R
For continuous numerical clinical features, two-tailed Student's t test with unequal variance (Lehmann and Romano 2005) was applied to compare the clinical values between tumors with and without gene mutations using 't.test' function in R
For multi-class clinical features (nominal or ordinal), Chi-square tests (Greenwood and Nikulin 1996) were used to estimate the P values using the 'chisq.test' function in R
For binary or multi-class clinical features (nominal or ordinal), two-tailed Fisher's exact tests (Fisher 1922) were used to estimate the P values using the 'fisher.test' function in R
For multiple hypothesis correction, Q value is the False Discovery Rate (FDR) analogue of the P value (Benjamini and Hochberg 1995), defined as the minimum FDR at which the test may be called significant. We used the 'Benjamini and Hochberg' method of 'p.adjust' function in R to convert P values into Q values.
In addition to the links below, the full results of the analysis summarized in this report can also be downloaded programmatically using firehose_get, or interactively from either the Broad GDAC website or TCGA Data Coordination Center Portal.