This pipeline computes the correlation between significant copy number variation (cnv focal) genes and selected clinical features.
Testing the association between copy number variation 48 focal events and 3 clinical features across 57 patients, 2 significant findings detected with Q value < 0.25.
-
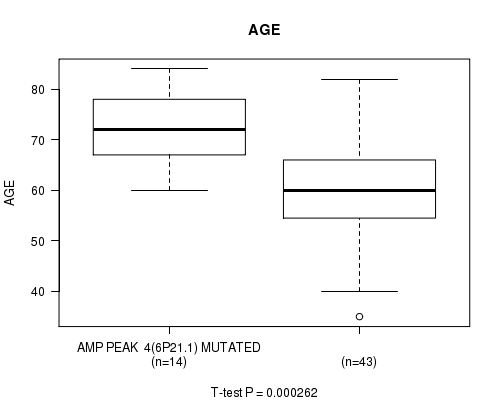
AMP PEAK 4(6P21.1) MUTATION ANALYSIS cnv correlated to 'AGE'.
-
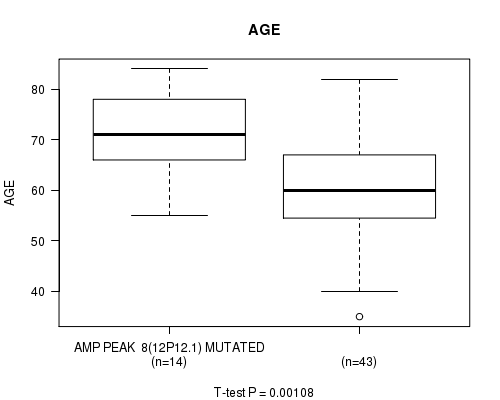
AMP PEAK 8(12P12.1) MUTATION ANALYSIS cnv correlated to 'AGE'.
Table 1. Get Full Table Overview of the association between significant copy number variation of 48 focal events and 3 clinical features. Shown in the table are P values (Q values). Thresholded by Q value < 0.25, 2 significant findings detected.
|
Clinical Features |
Time to Death |
AGE | GENDER | ||
| nCNV (%) | nWild-Type | logrank test | t-test | Fisher's exact test | |
| AMP PEAK 4(6P21 1) MUTATION ANALYSIS | 14 (25%) | 43 |
0.192 (1.00) |
0.000262 (0.0378) |
0.55 (1.00) |
| AMP PEAK 8(12P12 1) MUTATION ANALYSIS | 14 (25%) | 43 |
0.121 (1.00) |
0.00108 (0.155) |
1 (1.00) |
| AMP PEAK 1(1P32 1) MUTATION ANALYSIS | 17 (30%) | 40 |
0.0546 (1.00) |
0.459 (1.00) |
1 (1.00) |
| AMP PEAK 2(1Q24 3) MUTATION ANALYSIS | 21 (37%) | 36 |
0.379 (1.00) |
0.641 (1.00) |
0.787 (1.00) |
| AMP PEAK 3(5P15 33) MUTATION ANALYSIS | 24 (42%) | 33 |
0.0756 (1.00) |
0.0214 (1.00) |
1 (1.00) |
| AMP PEAK 5(6Q24 3) MUTATION ANALYSIS | 22 (39%) | 35 |
0.713 (1.00) |
0.176 (1.00) |
0.417 (1.00) |
| AMP PEAK 6(7P21 3) MUTATION ANALYSIS | 20 (35%) | 37 |
0.755 (1.00) |
0.103 (1.00) |
0.585 (1.00) |
| AMP PEAK 7(11Q22 2) MUTATION ANALYSIS | 11 (19%) | 46 |
0.356 (1.00) |
0.639 (1.00) |
1 (1.00) |
| AMP PEAK 9(12Q15) MUTATION ANALYSIS | 32 (56%) | 25 |
0.948 (1.00) |
0.503 (1.00) |
0.0033 (0.466) |
| AMP PEAK 10(17P11 2) MUTATION ANALYSIS | 15 (26%) | 42 |
0.0112 (1.00) |
0.042 (1.00) |
0.77 (1.00) |
| AMP PEAK 11(19P13 2) MUTATION ANALYSIS | 19 (33%) | 38 |
0.932 (1.00) |
0.225 (1.00) |
0.263 (1.00) |
| AMP PEAK 12(19Q12) MUTATION ANALYSIS | 20 (35%) | 37 |
0.0478 (1.00) |
0.00535 (0.738) |
1 (1.00) |
| AMP PEAK 13(XQ21 1) MUTATION ANALYSIS | 11 (19%) | 46 |
0.205 (1.00) |
0.147 (1.00) |
1 (1.00) |
| DEL PEAK 1(1P36 32) MUTATION ANALYSIS | 18 (32%) | 39 |
0.0226 (1.00) |
0.0613 (1.00) |
0.0239 (1.00) |
| DEL PEAK 2(1P32 3) MUTATION ANALYSIS | 12 (21%) | 45 |
0.053 (1.00) |
0.828 (1.00) |
0.0563 (1.00) |
| DEL PEAK 3(1Q44) MUTATION ANALYSIS | 19 (33%) | 38 |
0.76 (1.00) |
0.164 (1.00) |
0.576 (1.00) |
| DEL PEAK 4(2P25 3) MUTATION ANALYSIS | 15 (26%) | 42 |
0.988 (1.00) |
0.0303 (1.00) |
0.141 (1.00) |
| DEL PEAK 5(2Q37 3) MUTATION ANALYSIS | 22 (39%) | 35 |
0.859 (1.00) |
0.478 (1.00) |
0.592 (1.00) |
| DEL PEAK 6(3P21 31) MUTATION ANALYSIS | 16 (28%) | 41 |
0.178 (1.00) |
0.00213 (0.303) |
0.248 (1.00) |
| DEL PEAK 7(3Q25 2) MUTATION ANALYSIS | 17 (30%) | 40 |
0.851 (1.00) |
0.0862 (1.00) |
0.777 (1.00) |
| DEL PEAK 8(4Q34 3) MUTATION ANALYSIS | 26 (46%) | 31 |
0.558 (1.00) |
0.314 (1.00) |
0.0343 (1.00) |
| DEL PEAK 9(6P24 3) MUTATION ANALYSIS | 17 (30%) | 40 |
0.57 (1.00) |
0.383 (1.00) |
0.395 (1.00) |
| DEL PEAK 10(6Q15) MUTATION ANALYSIS | 9 (16%) | 48 |
0.785 (1.00) |
0.0244 (1.00) |
1 (1.00) |
| DEL PEAK 11(7Q36 3) MUTATION ANALYSIS | 13 (23%) | 44 |
0.595 (1.00) |
0.0779 (1.00) |
1 (1.00) |
| DEL PEAK 12(8P23 3) MUTATION ANALYSIS | 17 (30%) | 40 |
0.716 (1.00) |
0.531 (1.00) |
0.565 (1.00) |
| DEL PEAK 13(9P24 3) MUTATION ANALYSIS | 24 (42%) | 33 |
0.479 (1.00) |
0.00351 (0.488) |
1 (1.00) |
| DEL PEAK 14(9P21 3) MUTATION ANALYSIS | 29 (51%) | 28 |
0.675 (1.00) |
0.0781 (1.00) |
0.793 (1.00) |
| DEL PEAK 15(9Q34 3) MUTATION ANALYSIS | 14 (25%) | 43 |
0.156 (1.00) |
0.0277 (1.00) |
0.07 (1.00) |
| DEL PEAK 16(10P15 3) MUTATION ANALYSIS | 26 (46%) | 31 |
0.559 (1.00) |
0.0293 (1.00) |
0.113 (1.00) |
| DEL PEAK 17(10Q23 31) MUTATION ANALYSIS | 26 (46%) | 31 |
0.288 (1.00) |
0.161 (1.00) |
0.00791 (1.00) |
| DEL PEAK 18(11P15 5) MUTATION ANALYSIS | 26 (46%) | 31 |
0.247 (1.00) |
0.00349 (0.488) |
0.792 (1.00) |
| DEL PEAK 19(11Q22 3) MUTATION ANALYSIS | 22 (39%) | 35 |
0.178 (1.00) |
0.0159 (1.00) |
0.592 (1.00) |
| DEL PEAK 20(11Q24 3) MUTATION ANALYSIS | 26 (46%) | 31 |
0.0966 (1.00) |
0.0114 (1.00) |
1 (1.00) |
| DEL PEAK 21(12P13 1) MUTATION ANALYSIS | 16 (28%) | 41 |
0.98 (1.00) |
0.439 (1.00) |
0.141 (1.00) |
| DEL PEAK 22(13Q14 2) MUTATION ANALYSIS | 38 (67%) | 19 |
0.334 (1.00) |
0.0595 (1.00) |
0.092 (1.00) |
| DEL PEAK 23(14Q24 1) MUTATION ANALYSIS | 27 (47%) | 30 |
0.158 (1.00) |
0.246 (1.00) |
0.189 (1.00) |
| DEL PEAK 24(16Q12 1) MUTATION ANALYSIS | 31 (54%) | 26 |
0.184 (1.00) |
0.159 (1.00) |
0.186 (1.00) |
| DEL PEAK 25(17P13 1) MUTATION ANALYSIS | 15 (26%) | 42 |
0.438 (1.00) |
0.948 (1.00) |
0.0379 (1.00) |
| DEL PEAK 26(17Q25 3) MUTATION ANALYSIS | 16 (28%) | 41 |
0.524 (1.00) |
0.4 (1.00) |
1 (1.00) |
| DEL PEAK 27(18P11 32) MUTATION ANALYSIS | 19 (33%) | 38 |
0.948 (1.00) |
0.747 (1.00) |
0.167 (1.00) |
| DEL PEAK 28(18Q23) MUTATION ANALYSIS | 21 (37%) | 36 |
0.922 (1.00) |
0.0214 (1.00) |
0.787 (1.00) |
| DEL PEAK 29(19P13 3) MUTATION ANALYSIS | 15 (26%) | 42 |
0.837 (1.00) |
0.873 (1.00) |
0.00705 (0.966) |
| DEL PEAK 30(19Q13 33) MUTATION ANALYSIS | 17 (30%) | 40 |
0.344 (1.00) |
0.976 (1.00) |
0.777 (1.00) |
| DEL PEAK 31(21Q22 3) MUTATION ANALYSIS | 21 (37%) | 36 |
0.63 (1.00) |
0.0152 (1.00) |
0.787 (1.00) |
| DEL PEAK 32(22Q13 32) MUTATION ANALYSIS | 26 (46%) | 31 |
0.407 (1.00) |
0.515 (1.00) |
0.0343 (1.00) |
| DEL PEAK 33(XP21 1) MUTATION ANALYSIS | 12 (21%) | 45 |
0.435 (1.00) |
0.74 (1.00) |
0.53 (1.00) |
| DEL PEAK 34(XQ21 1) MUTATION ANALYSIS | 23 (40%) | 34 |
0.109 (1.00) |
0.757 (1.00) |
0.182 (1.00) |
| DEL PEAK 35(XQ27 1) MUTATION ANALYSIS | 25 (44%) | 32 |
0.872 (1.00) |
0.986 (1.00) |
0.186 (1.00) |
P value = 0.000262 (t-test), Q value = 0.038
Table S1. Gene #4: 'AMP PEAK 4(6P21.1) MUTATION STATUS' versus Clinical Feature #2: 'AGE'
| nPatients | Mean (Std.Dev) | |
|---|---|---|
| ALL | 57 | 63.4 (11.5) |
| AMP PEAK 4(6P21.1) MUTATED | 14 | 71.5 (7.5) |
| AMP PEAK 4(6P21.1) WILD-TYPE | 43 | 60.7 (11.4) |
Figure S1. Get High-res Image Gene #4: 'AMP PEAK 4(6P21.1) MUTATION STATUS' versus Clinical Feature #2: 'AGE'
P value = 0.00108 (t-test), Q value = 0.15
Table S2. Gene #8: 'AMP PEAK 8(12P12.1) MUTATION STATUS' versus Clinical Feature #2: 'AGE'
| nPatients | Mean (Std.Dev) | |
|---|---|---|
| ALL | 57 | 63.4 (11.5) |
| AMP PEAK 8(12P12.1) MUTATED | 14 | 71.2 (8.6) |
| AMP PEAK 8(12P12.1) WILD-TYPE | 43 | 60.8 (11.3) |
Figure S2. Get High-res Image Gene #8: 'AMP PEAK 8(12P12.1) MUTATION STATUS' versus Clinical Feature #2: 'AGE'
-
Copy number data file = transformed.cor.cli.txt
-
Clinical data file = SARC-TP.clin.merged.picked.txt
-
Number of patients = 57
-
Number of significantly focal cnvs = 48
-
Number of selected clinical features = 3
-
Exclude genes that fewer than K tumors have mutations, K = 3
For survival clinical features, the Kaplan-Meier survival curves of tumors with and without gene mutations were plotted and the statistical significance P values were estimated by logrank test (Bland and Altman 2004) using the 'survdiff' function in R
For continuous numerical clinical features, two-tailed Student's t test with unequal variance (Lehmann and Romano 2005) was applied to compare the clinical values between tumors with and without gene mutations using 't.test' function in R
For binary or multi-class clinical features (nominal or ordinal), two-tailed Fisher's exact tests (Fisher 1922) were used to estimate the P values using the 'fisher.test' function in R
For multiple hypothesis correction, Q value is the False Discovery Rate (FDR) analogue of the P value (Benjamini and Hochberg 1995), defined as the minimum FDR at which the test may be called significant. We used the 'Benjamini and Hochberg' method of 'p.adjust' function in R to convert P values into Q values.
In addition to the links below, the full results of the analysis summarized in this report can also be downloaded programmatically using firehose_get, or interactively from either the Broad GDAC website or TCGA Data Coordination Center Portal.