This pipeline uses various statistical tests to identify mRNAs whose expression levels correlated to selected clinical features.
Testing the association between 17825 genes and 3 clinical features across 50 samples, statistically thresholded by Q value < 0.05, 2 clinical features related to at least one genes.
-
1 gene correlated to 'AGE'.
-
RIMS1|22999
-
14 genes correlated to 'GENDER'.
-
PRKY|5616 , UTY|7404 , NLGN4Y|22829 , RPS4Y1|6192 , ZFY|7544 , ...
-
No genes correlated to 'Time to Death'
Complete statistical result table is provided in Supplement Table 1
Table 1. Get Full Table This table shows the clinical features, statistical methods used, and the number of genes that are significantly associated with each clinical feature at Q value < 0.05.
| Clinical feature | Statistical test | Significant genes | Associated with | Associated with | ||
|---|---|---|---|---|---|---|
| Time to Death | Cox regression test | N=0 | ||||
| AGE | Spearman correlation test | N=1 | older | N=1 | younger | N=0 |
| GENDER | t test | N=14 | male | N=12 | female | N=2 |
Table S1. Basic characteristics of clinical feature: 'Time to Death'
| Time to Death | Duration (Months) | 0.1-143.4 (median=18.1) |
| censored | N = 34 | |
| death | N = 16 | |
| Significant markers | N = 0 |
Table S2. Basic characteristics of clinical feature: 'AGE'
| AGE | Mean (SD) | 63.08 (12) |
| Significant markers | N = 1 | |
| pos. correlated | 1 | |
| neg. correlated | 0 |
Table S3. Get Full Table List of one gene significantly correlated to 'AGE' by Spearman correlation test
| SpearmanCorr | corrP | Q | |
|---|---|---|---|
| RIMS1|22999 | 0.7077 | 1.99e-06 | 0.0355 |
Figure S1. Get High-res Image As an example, this figure shows the association of RIMS1|22999 to 'AGE'. P value = 1.99e-06 with Spearman correlation analysis. The straight line presents the best linear regression.
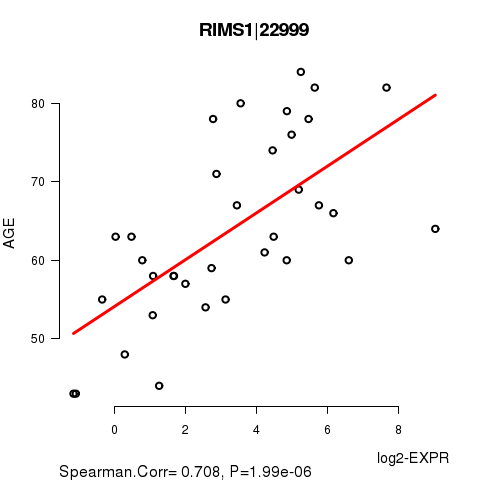
Table S4. Basic characteristics of clinical feature: 'GENDER'
| GENDER | Labels | N |
| FEMALE | 26 | |
| MALE | 24 | |
| Significant markers | N = 14 | |
| Higher in MALE | 12 | |
| Higher in FEMALE | 2 |
Table S5. Get Full Table List of top 10 genes differentially expressed by 'GENDER'
| T(pos if higher in 'MALE') | ttestP | Q | AUC | |
|---|---|---|---|---|
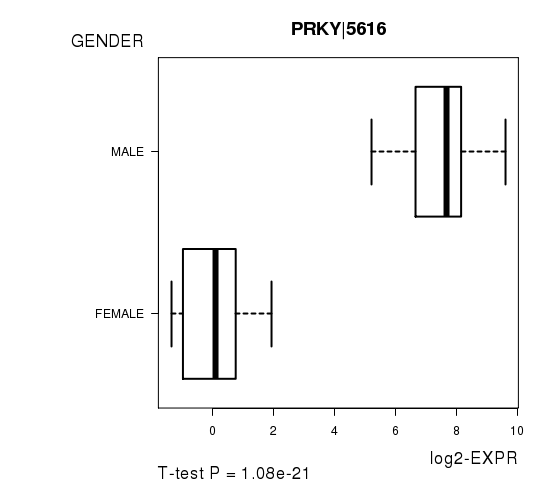
| PRKY|5616 | 19.29 | 1.078e-21 | 1.92e-17 | 1 |
| UTY|7404 | 21.11 | 5.296e-18 | 9.44e-14 | 1 |
| NLGN4Y|22829 | 14.41 | 1.138e-15 | 2.03e-11 | 1 |
| RPS4Y1|6192 | 19.44 | 1.201e-14 | 2.14e-10 | 1 |
| ZFY|7544 | 19.02 | 3.557e-14 | 6.34e-10 | 1 |
| TMSB4Y|9087 | 13.24 | 9.908e-13 | 1.77e-08 | 1 |
| KDM5D|8284 | 17.27 | 3.67e-12 | 6.54e-08 | 1 |
| DDX3Y|8653 | 18.44 | 2.454e-11 | 4.37e-07 | 1 |
| EIF1AY|9086 | 18.56 | 6.246e-11 | 1.11e-06 | 1 |
| XIST|7503 | -10.63 | 8.084e-10 | 1.44e-05 | 0.9495 |
Figure S2. Get High-res Image As an example, this figure shows the association of PRKY|5616 to 'GENDER'. P value = 1.08e-21 with T-test analysis.
-
Expresson data file = SARC-TP.uncv2.mRNAseq_RSEM_normalized_log2.txt
-
Clinical data file = SARC-TP.clin.merged.picked.txt
-
Number of patients = 50
-
Number of genes = 17825
-
Number of clinical features = 3
For survival clinical features, Wald's test in univariate Cox regression analysis with proportional hazards model (Andersen and Gill 1982) was used to estimate the P values using the 'coxph' function in R. Kaplan-Meier survival curves were plot using the four quartile subgroups of patients based on expression levels
For continuous numerical clinical features, Spearman's rank correlation coefficients (Spearman 1904) and two-tailed P values were estimated using 'cor.test' function in R
For two-class clinical features, two-tailed Student's t test with unequal variance (Lehmann and Romano 2005) was applied to compare the log2-expression levels between the two clinical classes using 't.test' function in R
For multiple hypothesis correction, Q value is the False Discovery Rate (FDR) analogue of the P value (Benjamini and Hochberg 1995), defined as the minimum FDR at which the test may be called significant. We used the 'Benjamini and Hochberg' method of 'p.adjust' function in R to convert P values into Q values.
In addition to the links below, the full results of the analysis summarized in this report can also be downloaded programmatically using firehose_get, or interactively from either the Broad GDAC website or TCGA Data Coordination Center Portal.