This pipeline computes the correlation between significantly recurrent gene mutations and selected clinical features.
Testing the association between mutation status of 26 genes and 11 clinical features across 219 patients, 7 significant findings detected with Q value < 0.25.
-
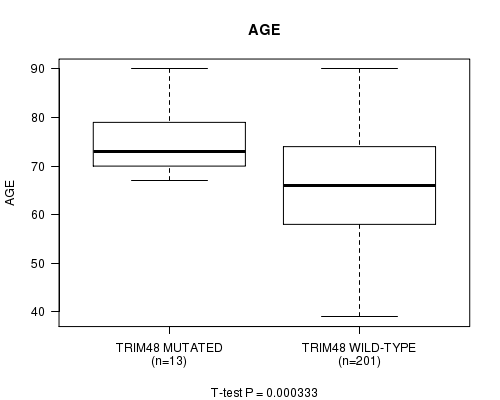
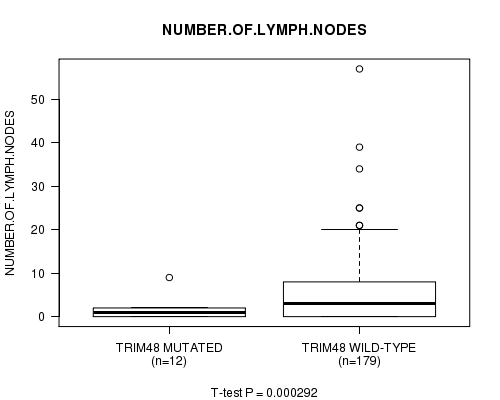
TRIM48 mutation correlated to 'AGE' and 'NUMBER.OF.LYMPH.NODES'.
-
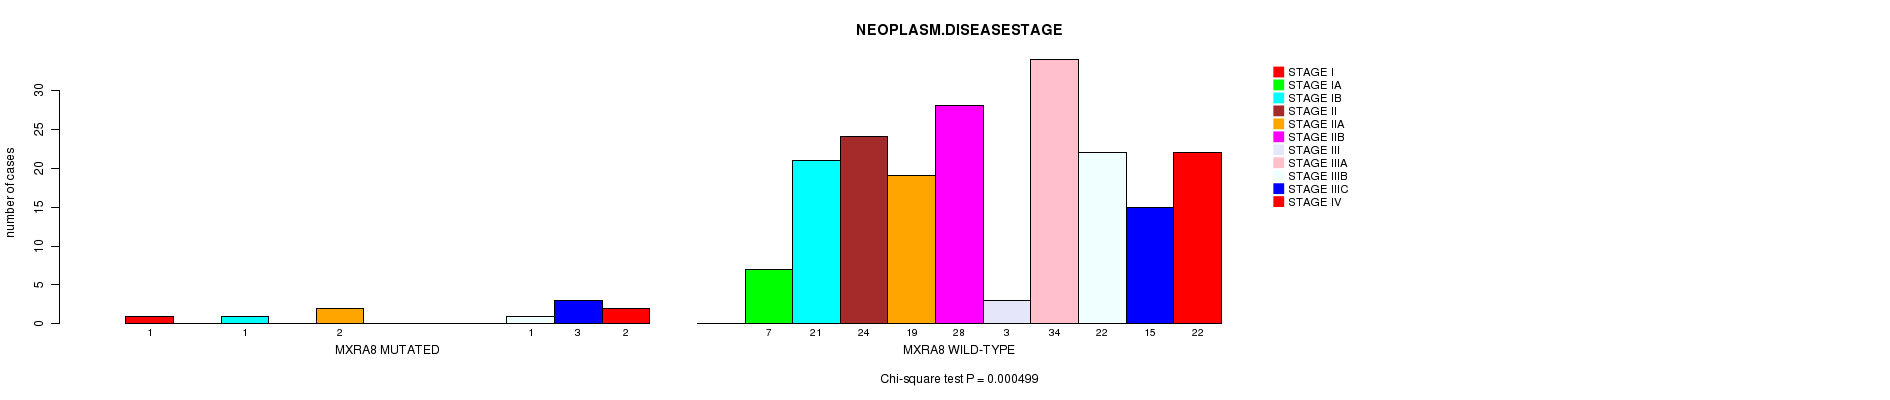
MXRA8 mutation correlated to 'NEOPLASM.DISEASESTAGE'.
-
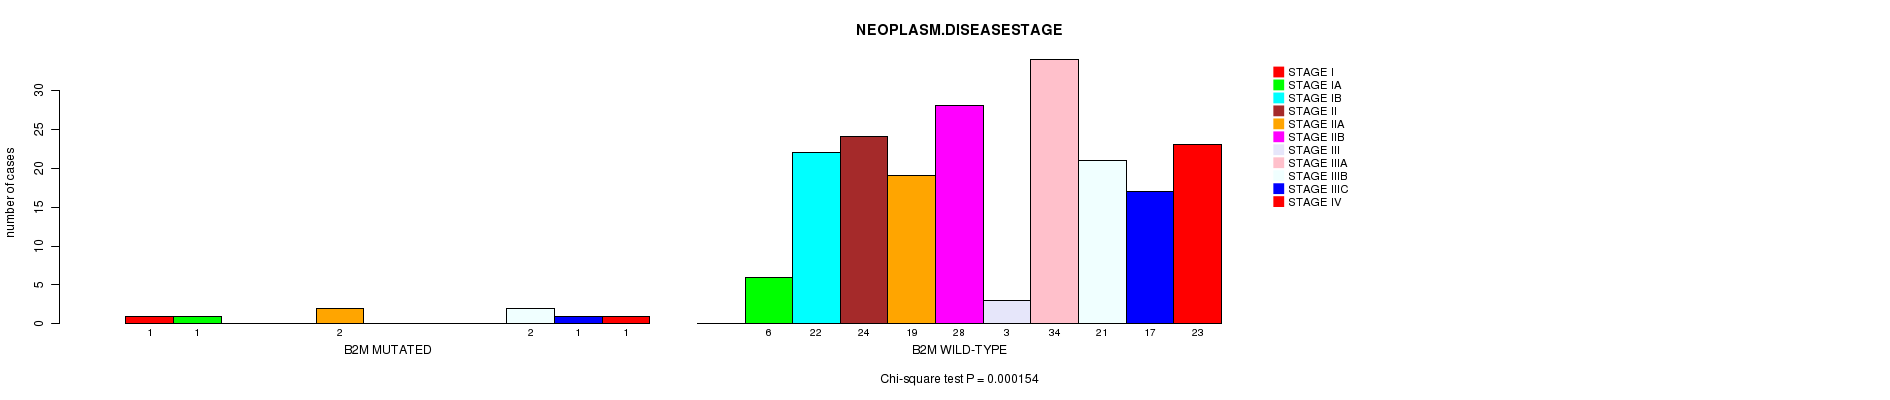
B2M mutation correlated to 'NEOPLASM.DISEASESTAGE'.
-
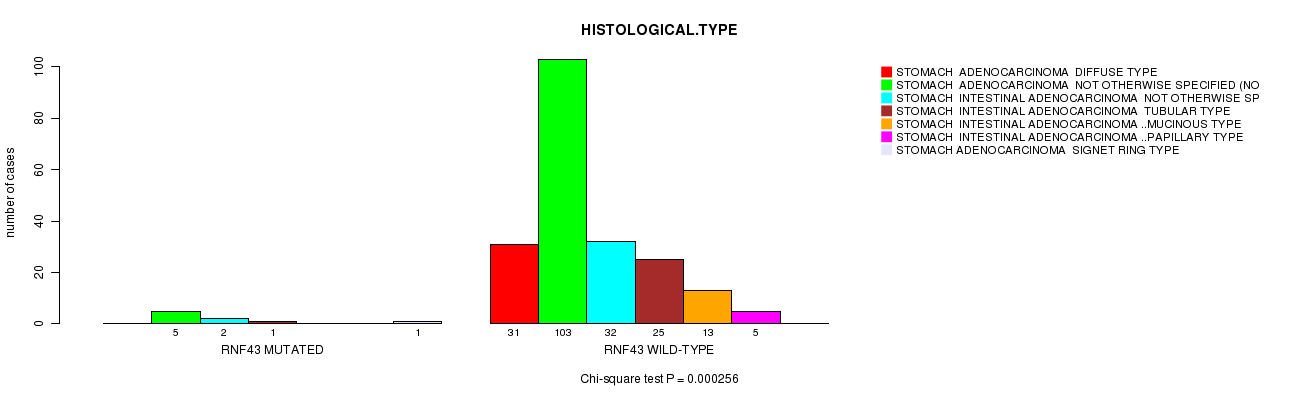
RNF43 mutation correlated to 'HISTOLOGICAL.TYPE'.
-
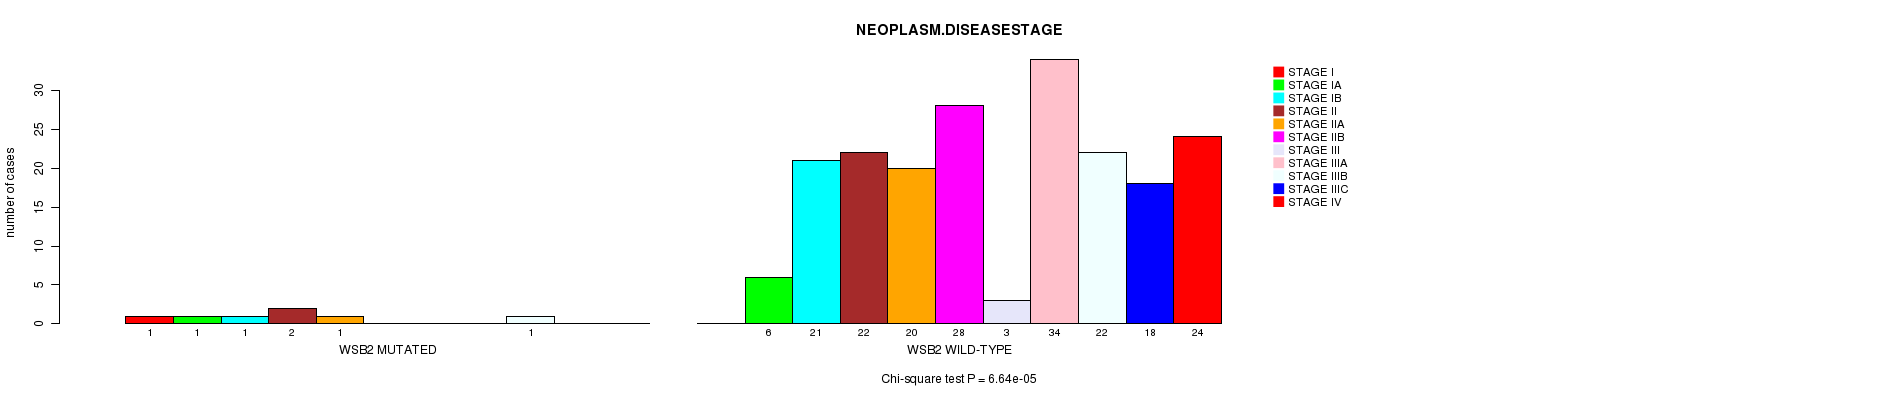
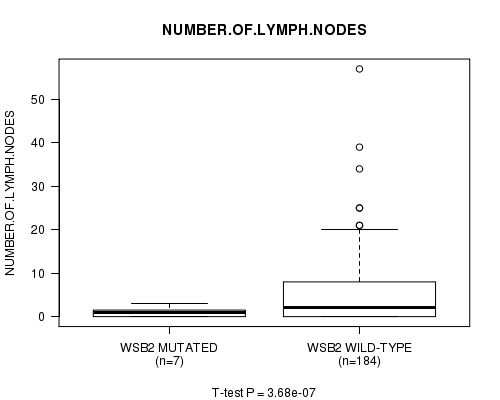
WSB2 mutation correlated to 'NEOPLASM.DISEASESTAGE' and 'NUMBER.OF.LYMPH.NODES'.
Table 1. Get Full Table Overview of the association between mutation status of 26 genes and 11 clinical features. Shown in the table are P values (Q values). Thresholded by Q value < 0.25, 7 significant findings detected.
|
Clinical Features |
Time to Death |
AGE |
NEOPLASM DISEASESTAGE |
PATHOLOGY T STAGE |
PATHOLOGY N STAGE |
PATHOLOGY M STAGE |
GENDER |
HISTOLOGICAL TYPE |
RADIATIONS RADIATION REGIMENINDICATION |
COMPLETENESS OF RESECTION |
NUMBER OF LYMPH NODES |
||
| nMutated (%) | nWild-Type | logrank test | t-test | Chi-square test | Fisher's exact test | Fisher's exact test | Fisher's exact test | Fisher's exact test | Chi-square test | Fisher's exact test | Fisher's exact test | t-test | |
| TRIM48 | 14 (6%) | 205 |
0.818 (1.00) |
0.000333 (0.0936) |
0.153 (1.00) |
0.097 (1.00) |
0.378 (1.00) |
0.612 (1.00) |
0.786 (1.00) |
0.589 (1.00) |
0.33 (1.00) |
0.374 (1.00) |
0.000292 (0.0823) |
| WSB2 | 7 (3%) | 212 |
0.664 (1.00) |
0.0177 (1.00) |
6.64e-05 (0.0189) |
0.0135 (1.00) |
0.311 (1.00) |
0.325 (1.00) |
0.248 (1.00) |
0.257 (1.00) |
1 (1.00) |
1 (1.00) |
3.68e-07 (0.000105) |
| MXRA8 | 10 (5%) | 209 |
0.141 (1.00) |
0.185 (1.00) |
0.000499 (0.14) |
0.0783 (1.00) |
0.646 (1.00) |
0.319 (1.00) |
0.523 (1.00) |
0.915 (1.00) |
1 (1.00) |
0.505 (1.00) |
0.723 (1.00) |
| B2M | 8 (4%) | 211 |
0.452 (1.00) |
0.355 (1.00) |
0.000154 (0.0438) |
0.283 (1.00) |
0.732 (1.00) |
0.372 (1.00) |
0.716 (1.00) |
0.498 (1.00) |
1 (1.00) |
1 (1.00) |
0.506 (1.00) |
| RNF43 | 9 (4%) | 210 |
0.0337 (1.00) |
0.277 (1.00) |
0.069 (1.00) |
0.102 (1.00) |
0.107 (1.00) |
0.417 (1.00) |
0.16 (1.00) |
0.000256 (0.0726) |
1 (1.00) |
0.196 (1.00) |
0.49 (1.00) |
| PIK3CA | 48 (22%) | 171 |
0.735 (1.00) |
0.476 (1.00) |
0.219 (1.00) |
0.478 (1.00) |
0.904 (1.00) |
0.215 (1.00) |
0.868 (1.00) |
0.863 (1.00) |
1 (1.00) |
0.474 (1.00) |
0.226 (1.00) |
| PGM5 | 22 (10%) | 197 |
0.955 (1.00) |
0.0233 (1.00) |
0.0232 (1.00) |
0.0149 (1.00) |
0.891 (1.00) |
0.745 (1.00) |
0.00546 (1.00) |
0.925 (1.00) |
0.474 (1.00) |
0.572 (1.00) |
0.986 (1.00) |
| KRAS | 25 (11%) | 194 |
0.436 (1.00) |
0.47 (1.00) |
0.0676 (1.00) |
0.775 (1.00) |
0.5 (1.00) |
1 (1.00) |
0.0317 (1.00) |
0.29 (1.00) |
1 (1.00) |
0.0265 (1.00) |
0.0772 (1.00) |
| CBWD1 | 28 (13%) | 191 |
0.348 (1.00) |
0.0252 (1.00) |
0.686 (1.00) |
0.249 (1.00) |
0.654 (1.00) |
0.882 (1.00) |
0.0219 (1.00) |
0.0648 (1.00) |
0.564 (1.00) |
0.84 (1.00) |
0.066 (1.00) |
| TP53 | 98 (45%) | 121 |
0.183 (1.00) |
0.665 (1.00) |
0.75 (1.00) |
0.492 (1.00) |
0.864 (1.00) |
0.0424 (1.00) |
0.677 (1.00) |
0.159 (1.00) |
0.411 (1.00) |
0.203 (1.00) |
0.639 (1.00) |
| ARID1A | 41 (19%) | 178 |
0.224 (1.00) |
0.294 (1.00) |
0.277 (1.00) |
0.135 (1.00) |
0.42 (1.00) |
0.133 (1.00) |
0.597 (1.00) |
0.326 (1.00) |
0.597 (1.00) |
0.242 (1.00) |
0.263 (1.00) |
| SMAD4 | 19 (9%) | 200 |
0.0325 (1.00) |
0.377 (1.00) |
0.759 (1.00) |
1 (1.00) |
0.783 (1.00) |
0.585 (1.00) |
0.625 (1.00) |
0.837 (1.00) |
1 (1.00) |
0.439 (1.00) |
0.438 (1.00) |
| RHOA | 13 (6%) | 206 |
0.828 (1.00) |
0.291 (1.00) |
0.775 (1.00) |
0.87 (1.00) |
0.744 (1.00) |
1 (1.00) |
0.572 (1.00) |
0.4 (1.00) |
1 (1.00) |
0.783 (1.00) |
0.268 (1.00) |
| IRF2 | 15 (7%) | 204 |
0.96 (1.00) |
0.8 (1.00) |
0.339 (1.00) |
0.112 (1.00) |
0.501 (1.00) |
0.645 (1.00) |
0.593 (1.00) |
0.763 (1.00) |
1 (1.00) |
0.0267 (1.00) |
0.11 (1.00) |
| CDH1 | 18 (8%) | 201 |
0.571 (1.00) |
0.111 (1.00) |
0.408 (1.00) |
0.395 (1.00) |
0.465 (1.00) |
0.69 (1.00) |
0.624 (1.00) |
0.358 (1.00) |
1 (1.00) |
0.191 (1.00) |
0.386 (1.00) |
| PTEN | 14 (6%) | 205 |
0.78 (1.00) |
0.0497 (1.00) |
0.328 (1.00) |
0.87 (1.00) |
0.434 (1.00) |
0.474 (1.00) |
0.0208 (1.00) |
0.733 (1.00) |
1 (1.00) |
0.0514 (1.00) |
0.249 (1.00) |
| FBXW7 | 19 (9%) | 200 |
0.598 (1.00) |
0.312 (1.00) |
0.753 (1.00) |
0.0999 (1.00) |
0.984 (1.00) |
1 (1.00) |
0.812 (1.00) |
0.575 (1.00) |
0.424 (1.00) |
0.362 (1.00) |
0.0394 (1.00) |
| PTH2 | 4 (2%) | 215 |
0.485 (1.00) |
0.488 (1.00) |
0.588 (1.00) |
0.623 (1.00) |
0.22 (1.00) |
1 (1.00) |
0.304 (1.00) |
0.886 (1.00) |
1 (1.00) |
1 (1.00) |
0.712 (1.00) |
| FAM46D | 6 (3%) | 213 |
0.243 (1.00) |
0.568 (1.00) |
0.803 (1.00) |
0.38 (1.00) |
1 (1.00) |
1 (1.00) |
1 (1.00) |
0.995 (1.00) |
1 (1.00) |
1 (1.00) |
0.645 (1.00) |
| APC | 33 (15%) | 186 |
0.11 (1.00) |
0.0504 (1.00) |
0.268 (1.00) |
0.4 (1.00) |
0.366 (1.00) |
0.654 (1.00) |
0.704 (1.00) |
0.516 (1.00) |
0.594 (1.00) |
0.278 (1.00) |
0.722 (1.00) |
| MAP2K7 | 14 (6%) | 205 |
0.33 (1.00) |
0.119 (1.00) |
0.518 (1.00) |
0.14 (1.00) |
0.356 (1.00) |
1 (1.00) |
0.415 (1.00) |
0.824 (1.00) |
1 (1.00) |
0.693 (1.00) |
0.758 (1.00) |
| BCOR | 16 (7%) | 203 |
0.0103 (1.00) |
0.137 (1.00) |
0.386 (1.00) |
0.886 (1.00) |
0.617 (1.00) |
0.0995 (1.00) |
1 (1.00) |
0.993 (1.00) |
1 (1.00) |
0.178 (1.00) |
0.513 (1.00) |
| TRPS1 | 30 (14%) | 189 |
0.99 (1.00) |
0.381 (1.00) |
0.159 (1.00) |
0.972 (1.00) |
0.856 (1.00) |
0.56 (1.00) |
0.427 (1.00) |
0.846 (1.00) |
1 (1.00) |
0.381 (1.00) |
0.924 (1.00) |
| C13ORF33 | 6 (3%) | 213 |
0.332 (1.00) |
0.367 (1.00) |
0.00174 (0.483) |
0.134 (1.00) |
0.0359 (1.00) |
1 (1.00) |
0.684 (1.00) |
0.873 (1.00) |
0.155 (1.00) |
1 (1.00) |
0.198 (1.00) |
| HRCT1 | 4 (2%) | 215 |
0.537 (1.00) |
0.123 (1.00) |
0.362 (1.00) |
0.372 (1.00) |
0.156 (1.00) |
1 (1.00) |
1 (1.00) |
0.941 (1.00) |
1 (1.00) |
1 (1.00) |
0.254 (1.00) |
| IAPP | 4 (2%) | 215 |
0.858 (1.00) |
0.355 (1.00) |
0.312 (1.00) |
0.52 (1.00) |
0.629 (1.00) |
0.181 (1.00) |
1 (1.00) |
0.966 (1.00) |
1 (1.00) |
0.158 (1.00) |
0.00157 (0.438) |
P value = 0.000333 (t-test), Q value = 0.094
Table S1. Gene #1: 'TRIM48 MUTATION STATUS' versus Clinical Feature #2: 'AGE'
| nPatients | Mean (Std.Dev) | |
|---|---|---|
| ALL | 214 | 66.5 (10.9) |
| TRIM48 MUTATED | 13 | 75.8 (7.3) |
| TRIM48 WILD-TYPE | 201 | 65.9 (10.8) |
Figure S1. Get High-res Image Gene #1: 'TRIM48 MUTATION STATUS' versus Clinical Feature #2: 'AGE'
P value = 0.000292 (t-test), Q value = 0.082
Table S2. Gene #1: 'TRIM48 MUTATION STATUS' versus Clinical Feature #11: 'NUMBER.OF.LYMPH.NODES'
| nPatients | Mean (Std.Dev) | |
|---|---|---|
| ALL | 191 | 5.2 (7.5) |
| TRIM48 MUTATED | 12 | 1.7 (2.5) |
| TRIM48 WILD-TYPE | 179 | 5.4 (7.6) |
Figure S2. Get High-res Image Gene #1: 'TRIM48 MUTATION STATUS' versus Clinical Feature #11: 'NUMBER.OF.LYMPH.NODES'
P value = 0.000499 (Chi-square test), Q value = 0.14
Table S3. Gene #10: 'MXRA8 MUTATION STATUS' versus Clinical Feature #3: 'NEOPLASM.DISEASESTAGE'
| nPatients | STAGE I | STAGE IA | STAGE IB | STAGE II | STAGE IIA | STAGE IIB | STAGE III | STAGE IIIA | STAGE IIIB | STAGE IIIC | STAGE IV |
|---|---|---|---|---|---|---|---|---|---|---|---|
| ALL | 1 | 7 | 22 | 24 | 21 | 28 | 3 | 34 | 23 | 18 | 24 |
| MXRA8 MUTATED | 1 | 0 | 1 | 0 | 2 | 0 | 0 | 0 | 1 | 3 | 2 |
| MXRA8 WILD-TYPE | 0 | 7 | 21 | 24 | 19 | 28 | 3 | 34 | 22 | 15 | 22 |
Figure S3. Get High-res Image Gene #10: 'MXRA8 MUTATION STATUS' versus Clinical Feature #3: 'NEOPLASM.DISEASESTAGE'
P value = 0.000154 (Chi-square test), Q value = 0.044
Table S4. Gene #15: 'B2M MUTATION STATUS' versus Clinical Feature #3: 'NEOPLASM.DISEASESTAGE'
| nPatients | STAGE I | STAGE IA | STAGE IB | STAGE II | STAGE IIA | STAGE IIB | STAGE III | STAGE IIIA | STAGE IIIB | STAGE IIIC | STAGE IV |
|---|---|---|---|---|---|---|---|---|---|---|---|
| ALL | 1 | 7 | 22 | 24 | 21 | 28 | 3 | 34 | 23 | 18 | 24 |
| B2M MUTATED | 1 | 1 | 0 | 0 | 2 | 0 | 0 | 0 | 2 | 1 | 1 |
| B2M WILD-TYPE | 0 | 6 | 22 | 24 | 19 | 28 | 3 | 34 | 21 | 17 | 23 |
Figure S4. Get High-res Image Gene #15: 'B2M MUTATION STATUS' versus Clinical Feature #3: 'NEOPLASM.DISEASESTAGE'
P value = 0.000256 (Chi-square test), Q value = 0.073
Table S5. Gene #19: 'RNF43 MUTATION STATUS' versus Clinical Feature #8: 'HISTOLOGICAL.TYPE'
| nPatients | STOMACH ADENOCARCINOMA DIFFUSE TYPE | STOMACH ADENOCARCINOMA NOT OTHERWISE SPECIFIED (NOS) | STOMACH INTESTINAL ADENOCARCINOMA NOT OTHERWISE SPECIFIED (NOS) | STOMACH INTESTINAL ADENOCARCINOMA TUBULAR TYPE | STOMACH INTESTINAL ADENOCARCINOMA MUCINOUS TYPE | STOMACH INTESTINAL ADENOCARCINOMA PAPILLARY TYPE | STOMACH ADENOCARCINOMA SIGNET RING TYPE |
|---|---|---|---|---|---|---|---|
| ALL | 31 | 108 | 34 | 26 | 13 | 5 | 1 |
| RNF43 MUTATED | 0 | 5 | 2 | 1 | 0 | 0 | 1 |
| RNF43 WILD-TYPE | 31 | 103 | 32 | 25 | 13 | 5 | 0 |
Figure S5. Get High-res Image Gene #19: 'RNF43 MUTATION STATUS' versus Clinical Feature #8: 'HISTOLOGICAL.TYPE'
P value = 6.64e-05 (Chi-square test), Q value = 0.019
Table S6. Gene #21: 'WSB2 MUTATION STATUS' versus Clinical Feature #3: 'NEOPLASM.DISEASESTAGE'
| nPatients | STAGE I | STAGE IA | STAGE IB | STAGE II | STAGE IIA | STAGE IIB | STAGE III | STAGE IIIA | STAGE IIIB | STAGE IIIC | STAGE IV |
|---|---|---|---|---|---|---|---|---|---|---|---|
| ALL | 1 | 7 | 22 | 24 | 21 | 28 | 3 | 34 | 23 | 18 | 24 |
| WSB2 MUTATED | 1 | 1 | 1 | 2 | 1 | 0 | 0 | 0 | 1 | 0 | 0 |
| WSB2 WILD-TYPE | 0 | 6 | 21 | 22 | 20 | 28 | 3 | 34 | 22 | 18 | 24 |
Figure S6. Get High-res Image Gene #21: 'WSB2 MUTATION STATUS' versus Clinical Feature #3: 'NEOPLASM.DISEASESTAGE'
P value = 3.68e-07 (t-test), Q value = 0.00011
Table S7. Gene #21: 'WSB2 MUTATION STATUS' versus Clinical Feature #11: 'NUMBER.OF.LYMPH.NODES'
| nPatients | Mean (Std.Dev) | |
|---|---|---|
| ALL | 191 | 5.2 (7.5) |
| WSB2 MUTATED | 7 | 1.0 (1.2) |
| WSB2 WILD-TYPE | 184 | 5.3 (7.6) |
Figure S7. Get High-res Image Gene #21: 'WSB2 MUTATION STATUS' versus Clinical Feature #11: 'NUMBER.OF.LYMPH.NODES'
-
Mutation data file = STAD-TP.mutsig.cluster.txt
-
Clinical data file = STAD-TP.clin.merged.picked.txt
-
Number of patients = 219
-
Number of significantly mutated genes = 26
-
Number of selected clinical features = 11
-
Exclude genes that fewer than K tumors have mutations, K = 3
For survival clinical features, the Kaplan-Meier survival curves of tumors with and without gene mutations were plotted and the statistical significance P values were estimated by logrank test (Bland and Altman 2004) using the 'survdiff' function in R
For continuous numerical clinical features, two-tailed Student's t test with unequal variance (Lehmann and Romano 2005) was applied to compare the clinical values between tumors with and without gene mutations using 't.test' function in R
For multi-class clinical features (nominal or ordinal), Chi-square tests (Greenwood and Nikulin 1996) were used to estimate the P values using the 'chisq.test' function in R
For binary or multi-class clinical features (nominal or ordinal), two-tailed Fisher's exact tests (Fisher 1922) were used to estimate the P values using the 'fisher.test' function in R
For multiple hypothesis correction, Q value is the False Discovery Rate (FDR) analogue of the P value (Benjamini and Hochberg 1995), defined as the minimum FDR at which the test may be called significant. We used the 'Benjamini and Hochberg' method of 'p.adjust' function in R to convert P values into Q values.
In addition to the links below, the full results of the analysis summarized in this report can also be downloaded programmatically using firehose_get, or interactively from either the Broad GDAC website or TCGA Data Coordination Center Portal.