This pipeline uses various statistical tests to identify genes whose promoter methylation levels correlated to selected clinical features.
Testing the association between 20206 genes and 5 clinical features across 362 samples, statistically thresholded by Q value < 0.05, 4 clinical features related to at least one genes.
-
196 genes correlated to 'AGE'.
-
ANGPT4 , TUFT1 , GPR158 , LOC100271836 , HDAC11 , ...
-
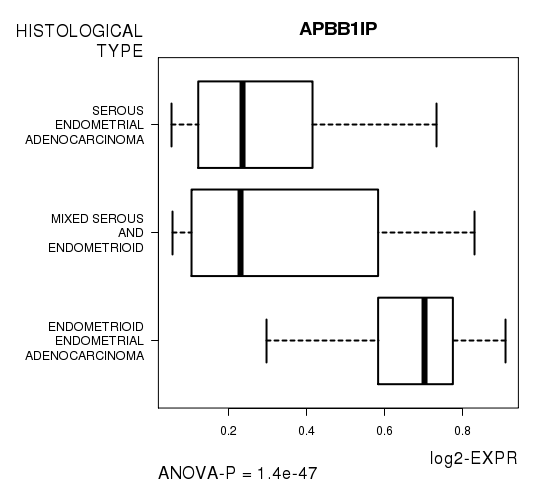
2564 genes correlated to 'HISTOLOGICAL.TYPE'.
-
APBB1IP , SSTR1 , CRYAB , HSPB2 , CARD11 , ...
-
6 genes correlated to 'RADIATIONS.RADIATION.REGIMENINDICATION'.
-
MAP2K2 , GPR89A , WBP4 , FZD8 , C22ORF13 , ...
-
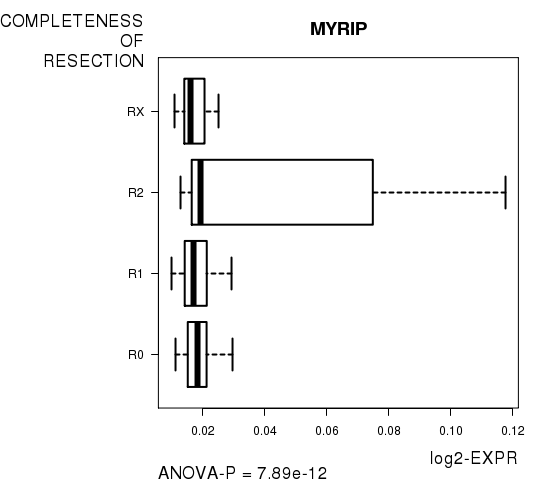
18 genes correlated to 'COMPLETENESS.OF.RESECTION'.
-
MYRIP , TRIM37 , TNFRSF19 , BICC1 , TMEM145 , ...
-
No genes correlated to 'Time to Death'
Complete statistical result table is provided in Supplement Table 1
Table 1. Get Full Table This table shows the clinical features, statistical methods used, and the number of genes that are significantly associated with each clinical feature at Q value < 0.05.
| Clinical feature | Statistical test | Significant genes | Associated with | Associated with | ||
|---|---|---|---|---|---|---|
| Time to Death | Cox regression test | N=0 | ||||
| AGE | Spearman correlation test | N=196 | older | N=61 | younger | N=135 |
| HISTOLOGICAL TYPE | ANOVA test | N=2564 | ||||
| RADIATIONS RADIATION REGIMENINDICATION | t test | N=6 | yes | N=6 | no | N=0 |
| COMPLETENESS OF RESECTION | ANOVA test | N=18 |
Table S1. Basic characteristics of clinical feature: 'Time to Death'
| Time to Death | Duration (Months) | 0-191.8 (median=16.8) |
| censored | N = 318 | |
| death | N = 40 | |
| Significant markers | N = 0 |
Table S2. Basic characteristics of clinical feature: 'AGE'
| AGE | Mean (SD) | 63.92 (11) |
| Significant markers | N = 196 | |
| pos. correlated | 61 | |
| neg. correlated | 135 |
Table S3. Get Full Table List of top 10 genes significantly correlated to 'AGE' by Spearman correlation test
| SpearmanCorr | corrP | Q | |
|---|---|---|---|
| ANGPT4 | 0.3543 | 4.394e-12 | 8.88e-08 |
| TUFT1 | -0.3429 | 2.263e-11 | 4.57e-07 |
| GPR158 | -0.3417 | 2.708e-11 | 5.47e-07 |
| LOC100271836 | -0.3413 | 2.863e-11 | 5.78e-07 |
| HDAC11 | -0.3351 | 6.787e-11 | 1.37e-06 |
| TBC1D23 | -0.3329 | 9.103e-11 | 1.84e-06 |
| GDNF | -0.3299 | 1.381e-10 | 2.79e-06 |
| SLFN14 | 0.3234 | 3.31e-10 | 6.69e-06 |
| GPR142 | 0.3148 | 1.005e-09 | 2.03e-05 |
| CACNB1 | -0.314 | 1.123e-09 | 2.27e-05 |
Figure S1. Get High-res Image As an example, this figure shows the association of ANGPT4 to 'AGE'. P value = 4.39e-12 with Spearman correlation analysis. The straight line presents the best linear regression.
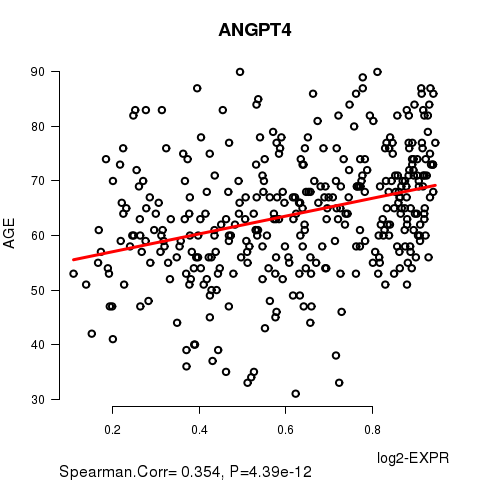
Table S4. Basic characteristics of clinical feature: 'HISTOLOGICAL.TYPE'
| HISTOLOGICAL.TYPE | Labels | N |
| ENDOMETRIOID ENDOMETRIAL ADENOCARCINOMA | 267 | |
| MIXED SEROUS AND ENDOMETRIOID | 17 | |
| SEROUS ENDOMETRIAL ADENOCARCINOMA | 77 | |
| Significant markers | N = 2564 |
Table S5. Get Full Table List of top 10 genes differentially expressed by 'HISTOLOGICAL.TYPE'
| ANOVA_P | Q | |
|---|---|---|
| APBB1IP | 1.405e-47 | 2.84e-43 |
| SSTR1 | 3.603e-47 | 7.28e-43 |
| CRYAB | 1.414e-40 | 2.86e-36 |
| HSPB2 | 1.414e-40 | 2.86e-36 |
| CARD11 | 1.563e-40 | 3.16e-36 |
| ADAMTS16 | 7.949e-40 | 1.61e-35 |
| PRKCB | 1.785e-38 | 3.61e-34 |
| CGN | 2.142e-38 | 4.33e-34 |
| KCNA6 | 9.302e-38 | 1.88e-33 |
| GRIK3 | 5.288e-37 | 1.07e-32 |
Figure S2. Get High-res Image As an example, this figure shows the association of APBB1IP to 'HISTOLOGICAL.TYPE'. P value = 1.4e-47 with ANOVA analysis.
6 genes related to 'RADIATIONS.RADIATION.REGIMENINDICATION'.
Table S6. Basic characteristics of clinical feature: 'RADIATIONS.RADIATION.REGIMENINDICATION'
| RADIATIONS.RADIATION.REGIMENINDICATION | Labels | N |
| NO | 83 | |
| YES | 279 | |
| Significant markers | N = 6 | |
| Higher in YES | 6 | |
| Higher in NO | 0 |
Table S7. Get Full Table List of 6 genes differentially expressed by 'RADIATIONS.RADIATION.REGIMENINDICATION'
| T(pos if higher in 'YES') | ttestP | Q | AUC | |
|---|---|---|---|---|
| MAP2K2 | 5.67 | 7.412e-08 | 0.0015 | 0.6952 |
| GPR89A | 5.33 | 3.242e-07 | 0.00655 | 0.7156 |
| WBP4 | 5.23 | 3.969e-07 | 0.00802 | 0.6592 |
| FZD8 | 4.91 | 1.931e-06 | 0.039 | 0.669 |
| C22ORF13 | 4.87 | 2.4e-06 | 0.0485 | 0.6528 |
| SNRPD3 | 4.87 | 2.4e-06 | 0.0485 | 0.6528 |
Figure S3. Get High-res Image As an example, this figure shows the association of MAP2K2 to 'RADIATIONS.RADIATION.REGIMENINDICATION'. P value = 7.41e-08 with T-test analysis.
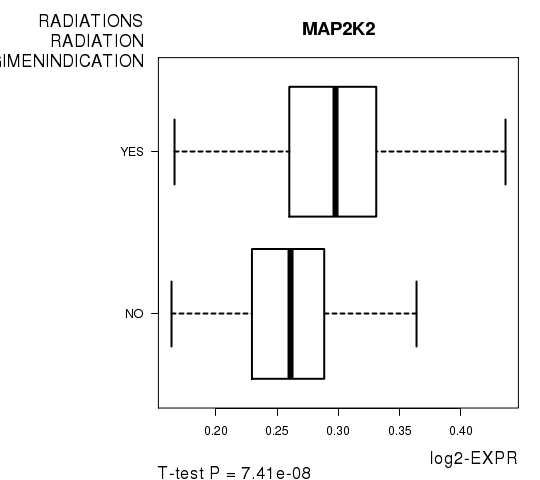
Table S8. Basic characteristics of clinical feature: 'COMPLETENESS.OF.RESECTION'
| COMPLETENESS.OF.RESECTION | Labels | N |
| R0 | 239 | |
| R1 | 18 | |
| R2 | 12 | |
| RX | 25 | |
| Significant markers | N = 18 |
Table S9. Get Full Table List of top 10 genes differentially expressed by 'COMPLETENESS.OF.RESECTION'
| ANOVA_P | Q | |
|---|---|---|
| MYRIP | 7.886e-12 | 1.59e-07 |
| TRIM37 | 5.54e-11 | 1.12e-06 |
| TNFRSF19 | 1.524e-09 | 3.08e-05 |
| BICC1 | 1.665e-09 | 3.36e-05 |
| TMEM145 | 4.332e-08 | 0.000875 |
| CPPED1 | 5.198e-08 | 0.00105 |
| FAM82A1 | 1.091e-07 | 0.0022 |
| CEBPA | 1.533e-07 | 0.0031 |
| LOC80054 | 1.533e-07 | 0.0031 |
| NDUFA12 | 2.533e-07 | 0.00512 |
Figure S4. Get High-res Image As an example, this figure shows the association of MYRIP to 'COMPLETENESS.OF.RESECTION'. P value = 7.89e-12 with ANOVA analysis.
-
Expresson data file = UCEC-TP.meth.by_min_expr_corr.data.txt
-
Clinical data file = UCEC-TP.clin.merged.picked.txt
-
Number of patients = 362
-
Number of genes = 20206
-
Number of clinical features = 5
For survival clinical features, Wald's test in univariate Cox regression analysis with proportional hazards model (Andersen and Gill 1982) was used to estimate the P values using the 'coxph' function in R. Kaplan-Meier survival curves were plot using the four quartile subgroups of patients based on expression levels
For continuous numerical clinical features, Spearman's rank correlation coefficients (Spearman 1904) and two-tailed P values were estimated using 'cor.test' function in R
For multi-class clinical features (ordinal or nominal), one-way analysis of variance (Howell 2002) was applied to compare the log2-expression levels between different clinical classes using 'anova' function in R
For two-class clinical features, two-tailed Student's t test with unequal variance (Lehmann and Romano 2005) was applied to compare the log2-expression levels between the two clinical classes using 't.test' function in R
For multiple hypothesis correction, Q value is the False Discovery Rate (FDR) analogue of the P value (Benjamini and Hochberg 1995), defined as the minimum FDR at which the test may be called significant. We used the 'Benjamini and Hochberg' method of 'p.adjust' function in R to convert P values into Q values.
In addition to the links below, the full results of the analysis summarized in this report can also be downloaded programmatically using firehose_get, or interactively from either the Broad GDAC website or TCGA Data Coordination Center Portal.